AD26 VACCINE PROTECTS AGAINST SARS-COV-2 SEVERE CLINICAL DISEASE IN HAMSTERS - NATURE
←
→
Page content transcription
If your browser does not render page correctly, please read the page content below
Letters
                                                                                                     https://doi.org/10.1038/s41591-020-1070-6

Ad26 vaccine protects against SARS-CoV-2
severe clinical disease in hamsters
Lisa H. Tostanoski 1,10, Frank Wegmann 2,10, Amanda J. Martinot 1,3,10, Carolin Loos 4,5,10,
Katherine McMahan1,10, Noe B. Mercado 1,10, Jingyou Yu1,10, Chi N. Chan 6, Stephen Bondoc6,
Carly E. Starke6, Michael Nekorchuk6, Kathleen Busman-Sahay 6, Cesar Piedra-Mora1,3,
Linda M. Wrijil 3, Sarah Ducat 3, Jerome Custers2, Caroline Atyeo4,7, Stephanie Fischinger 4,7,
John S. Burke 4, Jared Feldman4,7, Blake M. Hauser 4,7, Timothy M. Caradonna4,7, Esther A. Bondzie1,
Gabriel Dagotto 1,7, Makda S. Gebre1,7, Catherine Jacob-Dolan 1,7, Zijin Lin1, Shant H. Mahrokhian 1,
Felix Nampanya1, Ramya Nityanandam1, Laurent Pessaint8, Maciel Porto8, Vaneesha Ali8,
Dalia Benetiene8, Komlan Tevi8, Hanne Andersen 8, Mark G. Lewis8, Aaron G. Schmidt4,7,9,
Douglas A. Lauffenburger 5, Galit Alter 4,9, Jacob D. Estes6, Hanneke Schuitemaker2,
Roland Zahn 2 and Dan H. Barouch 1,4,7,9 ✉

Coronavirus disease 2019 (COVID-19) in humans is often a                   vector-based vaccine19 encoding a stabilized SARS-CoV-2 spike (S)
clinically mild illness, but some individuals develop severe               in this stringent model.
pneumonia, respiratory failure and death1–4. Studies of severe                 We inoculated 20 Syrian golden hamsters (10–12 weeks old) with
acute respiratory syndrome coronavirus 2 (SARS-CoV-2)                      5 × 10⁴ 50% tissue culture infective dose (TCID50) (n = 4; low-dose)
infection in hamsters5–7 and nonhuman primates8–10 have                    or 5 × 10⁵ TCID50 (n = 16; high-dose) SARS-CoV-2 by the intranasal
generally reported mild clinical disease, and preclinical                  route. In the high-dose group, four animals were necropsied on day
SARS-CoV-2 vaccine studies have demonstrated reduction of                  2, four animals were necropsied on day 4 for tissue viral loads and
viral replication in the upper and lower respiratory tracts in             histopathology and the remaining eight animals were followed lon-
nonhuman primates11–13. Here we show that high-dose intrana-               gitudinally. All remaining animals were necropsied on day 14. In the
sal SARS-CoV-2 infection in hamsters results in severe clinical            low-dose group, hamsters lost a median of 14.7% of body weight by
disease, including high levels of virus replication in tissues,            day 6 but fully recovered by day 14 (Fig. 1a,b), consistent with pre-
extensive pneumonia, weight loss and mortality in a subset of              vious studies5–7. In the high-dose group, hamsters lost a median of
animals. A single immunization with an adenovirus serotype                 19.9% of body weight by day 6. Of the eight animals in this group that
26 vector-based vaccine expressing a stabilized SARS-CoV-2                 were followed longitudinally, four met Institutional Animal Care and
spike protein elicited binding and neutralizing antibody                   Use Committee humane euthanasia criteria of more than 20% weight
responses and protected against SARS-CoV-2-induced                         loss and respiratory distress on day 6, and two additional animals met
weight loss, pneumonia and mortality. These data demon-                    these criteria on day 7. The remaining two animals recovered by day
strate vaccine protection against SARS-CoV-2 clinical dis-                 14. These data demonstrate that high-dose SARS-CoV-2 infection in
ease. This model should prove useful for preclinical studies of            hamsters led to severe weight loss and partial mortality.
SARS-CoV-2 vaccines, therapeutics and pathogenesis.                            Tissue viral loads were assessed in the four animals that received
    SARS-CoV-2 can infect nonhuman primates8–10, hamsters5–7, fer-         high-dose SARS-CoV-2 and were necropsied on day 2, the four ani-
rets14–16, hACE2 transgenic mice17,18 and other species16, but clinical    mals that were necropsied on day 4 and five of six of the animals that
disease in these models has generally been mild. A severe pneumo-          met euthanasia criteria on days 6–7 (Fig. 1c). High median tissue
nia model would be useful for preclinical evaluation of SARS-CoV-2         viral loads on day 2 of 1012 RNA copies per gram in lung tissue and
vaccines and other countermeasures, because SARS-CoV-2 infec-              108–109 RNA copies per gram in nares and trachea were observed,
tion in humans can lead to severe clinical disease, respiratory failure    with a median of 105–108 RNA copies per gram in heart, gastrointes-
and mortality1–4. We assessed the clinical and virologic character-        tinal tract, brain, spleen, liver and kidney, indicative of disseminated
istics of high-dose SARS-CoV-2 infection in hamsters and evalu-            infection. By days 6–7, tissue viral loads were approximately 2 logs
ated the protective efficacy of an adenovirus serotype 26 (Ad26)           lower, despite continued weight loss.

1
 Center for Virology and Vaccine Research, Beth Israel Deaconess Medical Center, Harvard Medical School, Boston, MA, USA. 2Janssen Vaccines &
Prevention BV, Leiden, Netherlands. 3Tufts University Cummings School of Veterinary Medicine, North Grafton, MA, USA. 4Ragon Institute of MGH, MIT,
and Harvard, Cambridge, MA, USA. 5Massachusetts Institute of Technology, Cambridge, MA, USA. 6Oregon Health & Sciences University, Beaverton, OR,
USA. 7Harvard Medical School, Boston, MA, USA. 8Bioqual, Rockville, MD, USA. 9Massachusetts Consortium on Pathogen Readiness, Boston, MA, USA.
10
  These authors contributed equally: Lisa H. Tostanoski, Frank Wegmann, Amanda J. Martinot, Carolin Loos, Katherine McMahan, Noe B. Mercado,
Jingyou Yu. ✉e-mail: dbarouch@bidmc.harvard.edu

Nature Medicine | www.nature.com/naturemedicine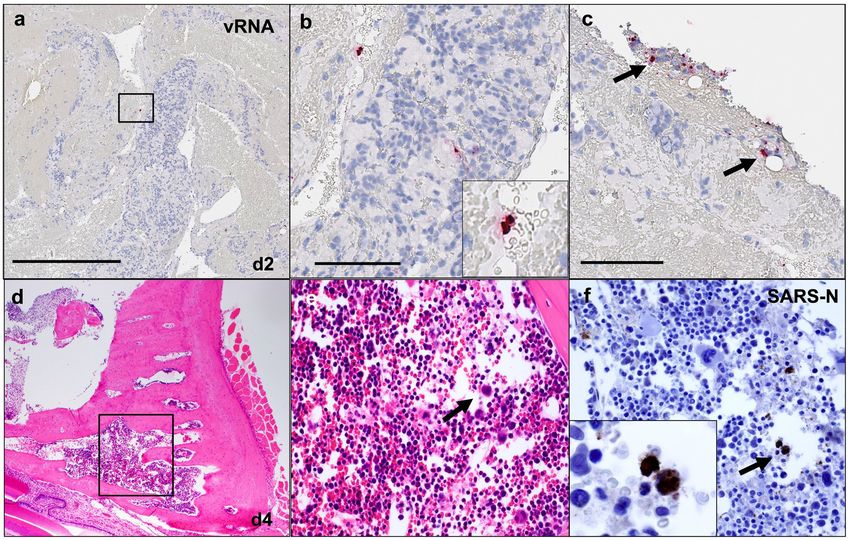
Letters NATuRE MEDICInE
a 10
Low dose
% median weight change
High dose
0
4
16
12
–10
8
4 2
–20
0 2 4 6 8 10 12 14
Days after challenge
b Low dose High dose
10 5 × 10⁴ TCID50 10 5 × 10⁵ TCID50
% weight change
0 0
0 7 14 0 7 14
–10 –10
–20 –20
******
Days after challenge * Mortality
c Day 2 Day 4 Days 6–7
12 12 12
copies per gram
10 10 10
log RNA
8 8 8
6 6 6
4 4 4
2 2 2
Lung
Nares
Trachea
Heart
GI
Brain
Spleen
Liver
Lung
Nares
Trachea
Heart
GI
Brain
Spleen
Liver
Kidney
Lung
Nares
Trachea
Heart
GI
Brain
Spleen
Liver
Kidney
Fig. 1 | Clinical disease after SARS-CoV-2 infection in hamsters. Syrian golden hamsters (10–12 weeks old; male and female; n = 20) were infected with
5 × 10⁴ TCID50 (low-dose; n = 4) or 5 × 10⁵ TCID50 (high-dose; n = 16) of SARS-CoV-2 by the intranasal route. a, Median percent weight change after
challenge. The numbers reflect the number of animals at each time point. In the high-dose group, four animals were necropsied on day 2, four animals were
necropsied on day 4, four animals met euthanization criteria on day 6 and two animals met euthanization criteria on day 7. b, Percent weight change after
challenge in individual animals. Median weight loss is depicted in red. Asterisks indicate mortality. Gray lines indicate animals with scheduled necropsies
on day 2 and day 4. c, Tissue viral loads as measured by log10 RNA copies per gram of tissue (limit of quantification, 100 copies per gram) in the scheduled
necropsies at day 2 and day 4 and in 2–5 of 6 animals that met euthanization criteria on days 6–7. Extended tissues were not harvested on day 6.
Hamsters infected with high-dose SARS-CoV-2 were assessed macrophages (Fig. 2f). Similarly, substantial SARS-CoV-2 viral
by histopathology on days 2 (n = 4), 4 (n = 4), 6–7 (n = 6) and 14 RNA (vRNA) was observed in the bronchiolar epithelium and the
(n = 2). Infection was associated with marked inflammatory infil- pulmonary interstitium in regions of inflammation (Fig. 2g,h).
trates and multifocal epithelial necrosis of the nasal turbinate Levels of both SARS-CoV-2 vRNA and SARS-CoV-N protein
(Fig. 2a) and bronchiolar epithelium, resulting in degenerative neu- expression in lung were highest on day 2 and diminished by day 4,
trophils and cellular debris in the lumen (Fig. 2b). The endothe- with minimal vRNA and SARS-CoV-N protein detected by day 7
lium of nearby vessels was reactive with adherence of mononuclear (Extended Data Fig. 1). The pneumonia was characterized by large
cells to the endothelium and transmigrating within vessel walls, inflammatory infiltrates of ionized calcium-binding adaptor protein 1
indicative of endothelialitis (Fig. 2b). There was moderate to severe (Iba-1)+ macrophages in the lung interstitium as well as CD3+ T lym-
multifocal interstitial pneumonia characterized by pulmonary con- phocytes (Fig. 2i,j). Many viable and degenerative neutrophils were
solidation affecting 30–60% of the lung parenchyma as early as day detected throughout the lung, especially in regions of necrosis, with
2 after SARS-CoV-2 infection (Fig. 2c). Inflammatory infiltrates high expression of neutrophil myeloperoxidase (MPO) through-
consisted of massive numbers of macrophages and neutrophils out the lung (Fig. 2k). Diffuse expression of the interferon inducible
with fewer lymphocytes. The nasal turbinate epithelium (Fig. 2d) gene product MX1 was also detected in the lung (Fig. 2l). In contrast
and bronchiolar epithelial cells (Fig. 2e) were strongly positive for with the kinetics of SARS-CoV-2 vRNA and SARS-CoV-N detection,
SARS nucleocapsid protein (SARS-CoV-N) by immunohistochem- which peaked on day 2, these markers of inflammation peaked on day
istry (IHC) in regions of inflammation and necrosis. SARS-CoV-N 7 (Extended Data Fig. 1), coincident with maximal weight loss and
IHC also showed locally extensive staining of the alveolar septa mortality (Fig. 1a,b). Detection of vRNA in the lung by RNAscope did
and interstitial mononuclear cells morphologically consistent with not simply reflect the viral inoculum, as we detected not only negative
Nature Medicine | www.nature.com/naturemedicine
NATuRE MEDICInE Letters
a b c
d e f
SARS-N SARS-N SARS-N
g h i
vRNA vRNA lba-1
j k l
CD3 MPO MX1
Fig. 2 | Pathologic features of high-dose SARS-CoV-2 infection in hamsters. a, Necrosis and inflammation (arrow) in nasal turbinate, H&E (day 2).
b, Bronchiolar epithelial necrosis with cellular debris and degenerative neutrophils in lumen (arrow) and transmigration of inflammatory cells in vessel wall
(arrowhead), H&E (day 2). c, Interstitial pneumonia, hemorrhage and consolidation of lung parenchyma, H&E (day 2). d, Nasal turbinate epithelium shows
strong positivity for SARS-CoV-N by IHC (day 2). e, Bronchiolar epithelium and luminal cellular debris show strong positivity for SARS-CoV-N by IHC (day 2).
f, Pneumocytes and alveolar septa show multifocal strong positivity for SARS-CoV-N by IHC (day 2). g, Diffuse vRNA staining by RNAscope within pulmonary
interstitium (arrow, interstitial pneumonia) and within bronchiolar epithelium (arrowhead; day 2). h, Diffuse vRNA staining by RNAscope within pulmonary
interstitium (day 4). i, Iba-1 IHC (macrophages) within pulmonary interstitium (day 7). j, CD3+ T lymphocytes within pulmonary interstitium, CD3 IHC (day 4).
k, MPO IHC indicating presence of interstitial neutrophils (day 7). l, Interferon inducible gene MX1 IHC shows strong and diffuse positivity throughout the
lung (day 4). Representative sections are shown. Experiments were repeated at least three times with similar results. Scale bars, 20 μm (b, d); 50 μm (a, e, f);
and 100 μm (c, g–l). H&E, hematoxylin and eosin.
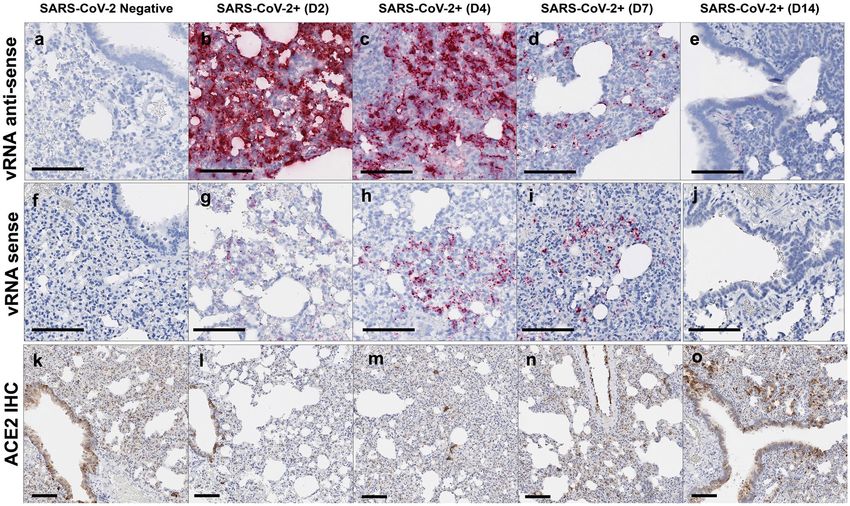
anti-sense vRNA (Extended Data Fig. 2a–e) but also positive-sense We produced recombinant, replication-incompetent Ad26 vec-
vRNA (Extended Data Fig. 2f–j), which overlapped in location and tors encoding 1) SARS-CoV-2 S with deletion of the transmem-
pattern, from day 2 to day 7 after challenge. SARS-CoV-2 vRNA brane region and cytoplasmic tail reflecting the soluble ectodomain
expression (both anti-sense and sense) was present in lung with robust with a foldon trimerization domain (S.dTM.PP) or 2) full-length
ACE2 receptor expression (Extended Data Fig. 2k–o). S (S.PP), both with mutation of the furin cleavage site and two
Systemic vRNA was also detected in distal tissues, including the proline stabilizing mutations20 (Fig. 3a). We recently reported the
brain stem, gastrointestinal tract and myocardium (Extended Data immunogenicity and protective efficacy of these vaccines against
Fig. 3a–f). Prominent endothelialitis and perivascular inflammation SARS-CoV-2 challenge in rhesus macaques13.
with macrophages and lymphocytes was observed in these tissues, We immunized 50 Syrian golden hamsters with 1010 or 109 viral
despite minimal SARS-CoV-N staining (Extended Data Fig. 3g–j). particles (vp) of Ad26 vectors encoding S.dTM.PP or S.PP (n = 10
Focal lymphocytic myocarditis was noted in one animal and corre- per group) or sham controls (n = 10). Animals received a single
sponded to the presence of vRNA (Extended Data Fig. 3k–l). Other vaccination by the intramuscular route at week 0. We observed
sites of virus detection included peripheral blood mononuclear cells receptor-binding domain (RBD)-specific binding antibodies by
in thrombi in lung (Extended Data Fig. 4a–c) and bone marrow of enzyme-linked immunosorbent assay (ELISA)10,11 (Fig. 3b) and
the nasal turbinate (Extended Data Fig. 4d–f). neutralizing antibodies (NAbs) by a pseudovirus neutralization
Nature Medicine | www.nature.com/naturemedicine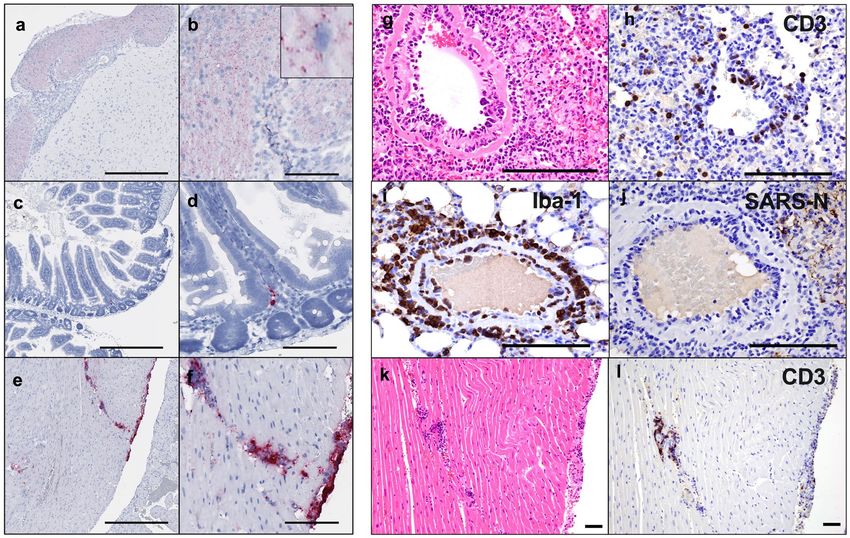
Letters                                                                                                                     NATuRE MEDICInE

assay10,11,21 (Fig. 3c) in all animals at week 2 and week 4. At week 4,        lung tissue were approximately 1012 RNA copies per gram in the
Ad26-S.PP elicited 4.0–4.7-fold higher median ELISA titers (4,470,             sham controls compared to 108 RNA copies per gram in the Ad26-S.
4,757) compared to Ad26-S.dTM.PP (1,014, 1,185) (Fig. 3b;                      dTM.PP vaccinated animals and 106 RNA copies per gram in the
P < 0.0001, two-sided Mann–Whitney tests). Similarly, Ad26-S.PP                Ad26-S.PP vaccinated animals. Reduced TCID50 infectious virus
elicited 1.8–2.6-fold higher median NAb IC50 titers (359, 375) com-            titers per gram of lung tissue were also observed for the Ad26-S.
pared to Ad26-S.dTM.PP (139, 211) (P < 0.05, two-sided Mann–                   dTM.PP and Ad26.S.PP vaccinated animals compared to sham con-
Whitney tests). For each vector, the two doses tested appeared to              trols (P = 0.02 and P = 0.01, respectively, two-sided Mann–Whitney
be similar. ELISA and NAb data were correlated at both week 2 and              tests; Extended Data Fig. 7b). By day 14, virus was still detected in
week 4 (R = 0.7074, P < 0.0001 and R = 0.7849, P < 0.0001, respec-             lung and nares of the surviving sham controls but was observed in
tively, two-sided Spearmanʼs rank correlation tests; Extended Data             only a minority of Ad26-S.dTM.PP vaccinated animals and in none
Fig. 5a).                                                                      of the Ad26-S.PP vaccinated animals (Extended Data Fig. 7c).
    We further characterized S-specific and RBD-specific antibody                  ELISA responses at week 2 (R = −0.8133, P = 0.0004) and week 4
responses in the vaccinated animals at week 4 by systems serol-                (R = −0.9288, P < 0.0001) correlated inversely with lung viral loads
ogy22. IgG, IgG2a, IgG3, IgM, Fc-receptors FcRγ2, FcRγ3 and                    at day 4 (Extended Data Fig. 8a), and NAb responses at week 2
FcRγ4 and antibody-dependent complement deposition (ADCD)                      (R = −0.7469, P = 0.0020) and week 4 (R = −0.6004, P = 0.0199)
responses were assessed (Fig. 3d–f). Higher and more consistent                correlated inversely with lung viral loads at day 4 (Extended Data
responses were observed with Ad26-S.PP than with Ad26.S.dTM.                   Fig. 8b). ELISA and NAb responses also correlated inversely with
PP (Fig. 3d,f), and a principal component analysis (PCA) of these              viral loads in nasal turbinates (Extended Data Fig. 8c,d). A deeper
antibody features confirmed that these two vaccines had distinct               analysis of immune correlates revealed that multiple antibody char-
profiles (Fig. 3e).                                                            acteristics correlated inversely with weight loss and tissue viral loads
    At week 4, all animals were challenged with 5 × 10⁵ TCID50                 (Extended Data Fig. 9a).
SARS-CoV-2 by the intranasal route. Three animals in each group                    The surviving sham controls developed potent binding and neu-
were necropsied on day 4 for tissue viral loads and histopathology,            tralizing antibody responses by day 14 after challenge (Extended
and the remaining seven animals in each group were followed until              Data Fig. 9b). Vaccinated animals also demonstrated higher ELISA
day 14. In the sham controls, hamsters lost a median of 19.6% of               and NAb responses after challenge (Extended Data Fig. 9b), consis-
body weight by day 7, and 43% (3/7) of the animals that were fol-              tent with tissue viral loads showing low and transient levels of virus
lowed longitudinally met euthanasia criteria on days 6–7 (Fig. 4a,b).          replication in these animals after high-dose SARS-CoV-2 challenge.
The Ad26-S.dTM.PP vaccinated animals lost a median of 8.7%                         Vaccinated animals also demonstrated diminished pathology
body weight, and the Ad26-S.PP vaccinated animals lost a median                compared to sham controls on day 4 after challenge (Extended Data
of 4.0% body weight (Fig. 4a,b). Maximum percent weight loss                   Fig. 10). Ad26-S.PP vaccinated animals demonstrated minimal to
was markedly lower in both vaccinated groups compared to sham                  no evidence of viral interstitial pneumonia, disruption of the bron-
controls (P < 0.0001, two-sided Mann–Whitney tests; Fig. 4c), and              chiolar epithelium or peribronchiolar aggregates of CD3+ T lympho-
animals that received Ad26-S.PP showed less weight loss than ani-              cytes and macrophages. Histiocytic and neutrophilic inflammatory
mals that received Ad26.S.dTM.PP (P < 0.0001, two-sided Mann–                  infiltrates were markedly reduced in all lung lobes, and significantly
Whitney tests; Fig. 4c). Both vaccines protected against mortality,            reduced SARS-CoV-2 vRNA was observed in Ad26-S.dTM.PP and
defined as meeting humane euthanization criteria, as compared to               Ad26-S.PP vaccinated hamsters compared to sham controls (P =
sham controls (P = 0.02, two-sided Fisher’s exact tests; Extended              0.004 and P = 0.004, respectively, two-sided Mann–Whitney tests;
Data Fig. 5b). A combined analysis of the two hamster experiments              Fig. 4d).
confirmed that both vaccines effectively protected against mortality               In this study, we demonstrated that a single immunization of an
(P = 0.007, two-sided Fisher’s exact tests; Extended Data Fig. 5c).            Ad26 vector encoding a full-length prefusion stabilized S immuno-
ELISA responses at week 2 (R = −0.8992, P < 0.0001) and week 4                 gen (S.PP) protected against severe clinical disease after high-dose
(R = −0.9344, P < 0.0001) correlated inversely with maximum per-               SARS-CoV-2 challenge in hamsters. Sham controls demonstrated
cent weight loss (Extended Data Fig. 6a). NAb responses at week 2              marked weight loss, severe pneumonia and partial mortality. In
(R = −0.7380, P < 0.0001) and week 4 (R = −0.8075, P < 0.0001) also            contrast, vaccinated animals showed minimal weight loss and
correlated inversely with maximum percent weight loss (Extended                pneumonia and no mortality. Vaccine-elicited binding and neutral-
Data Fig. 6b).                                                                 izing antibody responses correlated with protection against clinical
    Tissue viral loads were assessed in the subset of animals necrop-          disease as well as reduced virus replication in the upper and lower
sied on day 4 and in the remaining surviving animals on day 14.                respiratory tract.
On day 4 after high-dose SARS-CoV-2 challenge, virus was detected                  The severity of clinical disease in this model contrasts with
in tissues in all animals by subgenomic RNA reverse trancription–              previous studies involving SARS-CoV-2 infection in hamsters5–7
polymerase chain reaction (RT–PCR), which is thought to measure                and other species8–10,14–18. Hamsters are a permissive model for
replicating virus10,23 (Extended Data Fig. 7a). Median viral loads in          SARS-CoV-2 as a result of their homology to the human ACE2

Fig. 3 | Humoral immune responses in vaccinated hamsters. a, SARS-CoV-2 S immunogens with 1) deletion of the transmembrane region and cytoplasmic
tail reflecting the soluble ectodomain with a foldon trimerization domain (S.dTM.PP) or 2) full-length S (S.PP), both with mutation of the furin cleavage
site and two proline stabilizing mutations. The red X depicts furin cleavage site mutation; red vertical lines depict proline mutations; and the open square
depicts the foldon trimerization domain. S1 and S2 represent the first and second domain of the S protein; TM depicts the transmembrane region; and CT
depicts the cytoplasmic domain. Hamsters were vaccinated with 1010 vp or 109 vp of Ad26-S.dTM.PP or Ad26-S.PP or sham controls (n = 10 per group).
Humoral immune responses were assessed at weeks 0, 2 and 4 by b) RBD-specific binding antibody ELISA and c) pseudovirus neutralization assays. Red
bars reflect median responses. Dotted lines reflect assay limit of quantitation. d, S- and RBD-specific IgG subclass, FcγR and ADCD responses at week 4
are shown as radar plots. The size and color intensity of the wedges indicate the median of the feature for the corresponding group (antibody subclass,
red; FcγR binding, blue; ADCD, green). e, PCA plot showing the multivariate antibody profiles across vaccination groups. Each dot represents an animal;
the color of the dot denotes the group; and the ellipses show the distribution of the groups as 70% confidence levels assuming a multivariate normal
distribution. f, The heat map shows the differences in the means of z-scored features between vaccine groups S.PP and S.dTM.PP. The two groups were
compared by two-sided Mann–Whitney tests, and stars indicate the Benjamini–Hochberg-corrected q values (*q < 0.05, **q < 0.01 and ***q < 0.001).

                                                                                                            Nature Medicine | www.nature.com/naturemedicine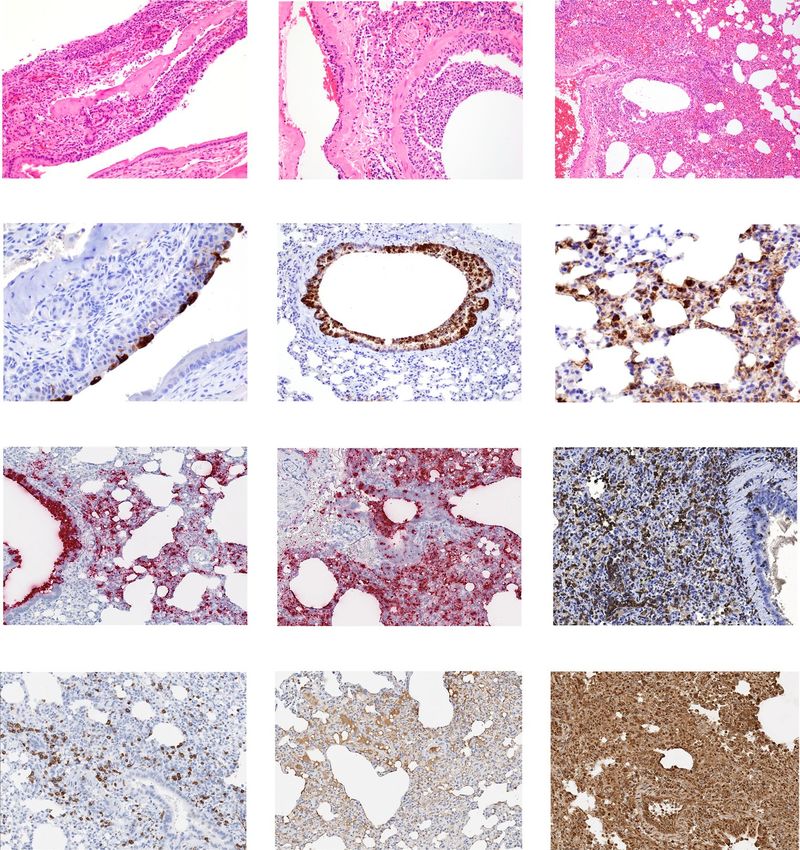
NATuRE MEDICInE Letters
receptor5, and transmission among hamsters has been reported6. also recently reported that a single immunization of Ad26-S.PP pro-
The high challenge dose resulted in extensive clinical disease in vided complete or near-complete protection against SARS-CoV-2
the present study, although biologic factors that remain to be fully challenge in rhesus macaques13. However, SARS-CoV-2 infection
defined might also affect clinical disease, such as animal age, animal in nonhuman primates does not result in severe clinical disease or
origin and viral challenge stock. mortality8–10. A severe disease model would be useful to comple-
SARS-CoV-2 vaccine studies in nonhuman primates have, to ment current nonhuman primate challenge models, because protec-
date, demonstrated protection against infection or reduction of viral tion against viral replication does not necessarily imply protection
replication in the upper and lower respiratory tracts11,12. We have against severe disease. Indeed, in the histopathologic analysis of
a S1 S2 TM CT
S.dTM.PP
S.PP
b Week 0 Week 2 Week 4
100,000 100,000 100,000
10,000 10,000 10,000
ELISA titer
ELISA titer
ELISA titer
1,000 1,000 1,000
100 100 100
10 10 10
1010 109 1010 109 Sham 1010 109 1010 109 Sham 1010 109 1010 109 Sham
S.dTM.PP S.PP S.dTM.PP S.PP S.dTM.PP S.PP
c 10,000 10,000 10,000
1,000 1,000 1,000
NAb titer
NAb titer
NAb titer
100 100 100
10 10 10
1010 109 1010 109 Sham 1010 109 1010 109 Sham 1010 109 1010 109 Sham
S.dTM.PP S.PP S.dTM.PP S.PP S.dTM.PP S.PP
d e
S.dTM.PP 1010 S.dTM.PP 109 Sham
4
Scores on PC2 (7.2%)
2 S.dTM.PP 1010
S.dTM.PP 109
ADCD RBD
0 S.PP 1010
S.PP 1010 S.PP 109
RBD
ADC
IgG S
Fc
S1
R
DS
Fc
IgG
Fc
S.PP 109
4S 1
S2
IgG
R4
R4
S
2
RB
G
2a
S
D
Ig
FcR D IgG 2a RB
FcR3
4S
Ig G −2
S1
S2 IgG2a
FcR3 S1 0 IgG2a S2
R BD IgG3
FcR 3 S
IgG
3S IgG 3 RB
FcR S2 D −10 −5 0 5
3S
R2 0.5
RB 1
Ig
c 1
Scores on PC1 (74.9%)
S
F
G
D
IgM
IgM
R2
2S
3
IgM S2
IgM S1
S2
Fc
S
FcR
R2
RBD
Fc
1
f 1.6
average z score
Difference in
S.PP 1.2
S.dTM.PP
*** *** *** *** *** *** *** *** *** *** *** *** *** * * * *** *** *** *** *** *** ** *** *** *** *** *** *** * 0.8
S RBD S1 S2 S RBD S1 S2 S RBD S1 S2 S RBD S1 S2 S RBD S1 S2 S RBD S1 S2 S RBD S1 S2 S RBD 0.4
IgG1 IgG2a IgG3 IgM FcR2 FcR3 FcR4 ADCD 0
Nature Medicine | www.nature.com/naturemedicine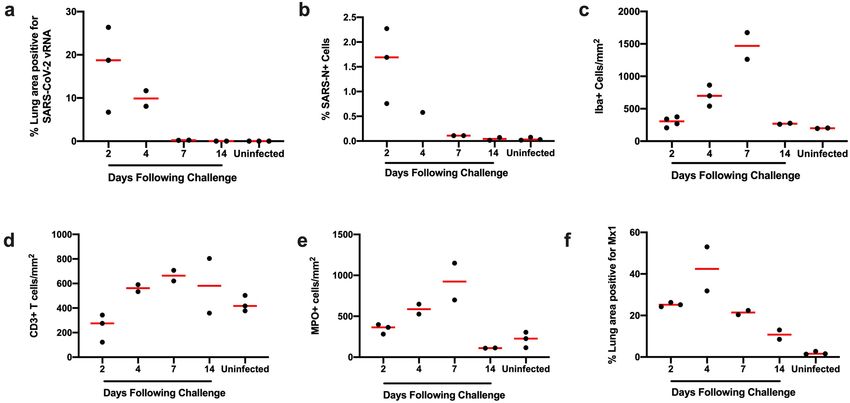
Letters NATuRE MEDICInE
a 10
S.dTM.PP 1010 vp
% median weight change
S.dTM.PP 109 vp
0 S.PP 1010 vp
S.PP 109 vp
–10 Sham
–20
0 7 14
Days after challenge
b
Sham S.dTM.PP 1010 vp S.dTM.PP 109 vp
10 10 10
0 0 0
0 7 14 0 7 14 0 7 14
–10 –10 –10
% weight change
–20 –20 –20
***
10
S.PP 10 vp S.PP 109 vp
10 10
* Mortality 0 0
0 7 14 0 7 14
–10 –10
–20 –20
Days after challenge
c P < 0.0001 d P = 0.004
P < 0.0001 P = 0.004
>20 P < 0.0001 15 P = 0.004
% RNA+ lung area
% weight loss
15
10
10
5
5
0 0
S.dTM.PP S.PP Sham S.dTM.PP S.PP Sham
Fig. 4 | Clinical disease in hamsters after high-dose SARS-CoV-2 challenge. a, Median percent weight change after challenge. b, Percent weight change
after challenge in individual animals. Median weight loss is depicted in red. Asterisks indicate mortality. Gray lines indicate animals with scheduled
necropsies on day 4. c, Maximal weight loss in the combined Ad26-S.dTM.PP (n = 14), Ad26-S.PP (n = 14) and sham control (n = 7) groups, excluding
the animals that were necropsied on day 4. P values indicate two-sided Mann–Whitney tests. n reflects all animals that were followed for weight loss and
were not necropsied on day 4. d, Quantification of percent lung area positive for anti-sense vRNA in tissue sections from Ad26-S.dTM.PP and Ad26-S.PP
vaccinated hamsters as compared to control hamsters on day 4 after challenge. P values represent two-sided Mann–Whitney tests.
hamsters in the present study, viral loads in lung decreased from In summary, our data demonstrate that a single immunization
day 2 to day 7, whereas inflammatory markers continued to escalate of Ad26-S.PP provides robust protection against severe clinical
during this time period and correlated with continued weight loss. disease after high-dose SARS-CoV-2 infection in hamsters. To our
These data suggest that progressive clinical disease in hamsters is knowledge, vaccine protection against severe SARS-CoV-2 pneu-
primarily an inflammatory process, which is triggered by infection monia and mortality has not previously been reported. Ad26-S.PP,
but continued to increase even when viral replication decreased. which is also termed Ad26.COV2.S, is currently being evaluated
Because COVID-19 in humans can progress to severe clinical in clinical trials. This hamster severe disease model should prove
disease, it is important to test SARS-CoV-2 vaccine candidates in useful for testing of SARS-CoV-2 vaccines, therapeutics and other
preclinical models that recapitulate severe clinical disease, includ- countermeasures.
ing fulminant pneumonia and mortality. The high-dose hamster
model described here achieves many of these criteria and, therefore, Online content
might be useful to study the pathogenesis of severe disease and to Any methods, additional references, Nature Research report-
test countermeasures. The primary manifestation of clinical disease ing summaries, source data, extended data, supplementary infor-
in this model was severe pneumonia rather than encephalitis that mation, acknowledgements, peer review information; details of
has been reported in certain hACE2 transgenic mouse models24. author contributions and competing interests; and statements of
Moreover, binding and neutralizing antibody responses correlated data and code availability are available at https://doi.org/10.1038/
with protection. s41591-020-1070-6.
Nature Medicine | www.nature.com/naturemedicine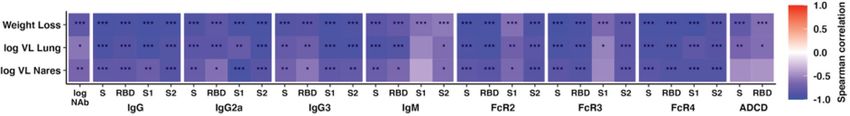
NATuRE MEDICInE                                                                                                                                          Letters
Received: 6 August 2020; Accepted: 20 August 2020;                                    15. Kim, Y. I. et al. Infection and rapid transmission of SARS-CoV-2 in ferrets.
Published: xx xx xxxx                                                                     Cell Host Microbe 27, e702 (2020).
                                                                                      16. Shi, J. et al. Susceptibility of ferrets, cats, dogs, and other domesticated
                                                                                          animals to SARS-coronavirus 2. Science 368, 1016–1020 (2020).
References                                                                            17. Bao, L. et al. The pathogenicity of SARS-CoV-2 in hACE2 transgenic mice.
1. Li, Q. et al. Early transmission dynamics in Wuhan, China, of novel                    Nature 583, 830–833 (2020).
    coronavirus-infected pneumonia. N. Engl. J. Med. 382, 1199–1207 (2020).           18. Sun, S. H. et al. A mouse model of SARS-CoV-2 infection and pathogenesis.
2. Zhu, N. et al. A novel coronavirus from patients with pneumonia in China,              Cell Host Microbe 28, e124 (2020).
    2019. N. Engl. J. Med. 382, 727–733 (2020).                                       19. Abbink, P. et al. Comparative seroprevalence and immunogenicity of six rare
3. Chen, N. et al. Epidemiological and clinical characteristics of 99 cases of 2019       serotype recombinant adenovirus vaccine vectors from subgroups B and D. J.
    novel coronavirus pneumonia in Wuhan, China: a descriptive study. Lancet              Virol. 81, 4654–4663 (2007).
    395, 507–513 (2020).                                                              20. Wrapp, D. et al. Cryo-EM structure of the 2019-nCoV spike in the prefusion
4. Huang, C. et al. Clinical features of patients infected with 2019 novel                conformation. Science 367, 1260–1263 (2020).
    coronavirus in Wuhan, China. Lancet 395, 497–506 (2020).                          21. Yang, Z. Y. et al. A DNA vaccine induces SARS coronavirus neutralization
5. Chan, J. F. et al. Simulation of the clinical and pathological manifestations of       and protective immunity in mice. Nature 428, 561–564 (2004).
    Coronavirus Disease 2019 (COVID-19) in golden Syrian hamster model:               22. Chung, A. W. et al. Dissecting polyclonal vaccine-induced humoral immunity
    implications for disease pathogenesis and transmissibility. Clin. Infect. Dis.        against HIV using systems serology. Cell 163, 988–998 (2015).
    https://doi.org/10.1093/cid/ciaa325 (2020).                                       23. Wolfel, R. et al. Virological assessment of hospitalized patients with
6. Sia, S. F. et al. Pathogenesis and transmission of SARS-CoV-2 in golden                COVID-2019. Nature 581, 465–469 (2020).
    hamsters. Nature 583, 834–838 (2020).                                             24. Netland, J., Meyerholz, D. K., Moore, S., Cassell, M. & Perlman, S. Severe
7. Imai, M. et al. Syrian hamsters as a small animal model for SARS-CoV-2                 acute respiratory syndrome coronavirus infection causes neuronal death in
    infection and countermeasure development. Proc. Natl Acad. Sci. USA 117,              the absence of encephalitis in mice transgenic for human ACE2. J. Virol. 82,
    16587–16595 (2020).                                                                   7264–7275 (2008).
8. Munster, V. J. et al. et al. Respiratory disease in rhesus macaques
    inoculated with SARS-CoV-2. Nature https://doi.org/10.1038/s41586-020-
    2324-7 (2020).                                                                    Publisher’s note Springer Nature remains neutral with regard to jurisdictional claims in
9. Rockx, B. et al. Comparative pathogenesis of COVID-19, MERS, and SARS in           published maps and institutional affiliations.
    a nonhuman primate model. Science 368, 1012–1015 (2020).                                             Open Access This article is licensed under a Creative Commons
10. Chandrashekar, A. et al. SARS-CoV-2 infection protects against rechallenge                           Attribution 4.0 International License, which permits use, sharing, adap-
    in rhesus macaques. Science 369, 812–817 (2020).                                                     tation, distribution and reproduction in any medium or format, as long
11. Yu, J. et al. DNA vaccine protection against SARS-CoV-2 in rhesus macaques.       as you give appropriate credit to the original author(s) and the source, provide a link to
    Science 369, 806–811 (2020).                                                      the Creative Commons license, and indicate if changes were made. The images or other
12. Gao, Q. et al. Rapid development of an inactivated vaccine candidate for          third party material in this article are included in the article’s Creative Commons license,
    SARS-CoV-2. Science 369, 77–81 (2020).                                            unless indicated otherwise in a credit line to the material. If material is not included in
13. Mercado, N. B. et al. Single-shot Ad26 vaccine protects against                   the article’s Creative Commons license and your intended use is not permitted by statu-
    SARS-CoV-2 in rhesus macaques. Nature https://doi.org/10.1038/s41586-020-         tory regulation or exceeds the permitted use, you will need to obtain permission directly
    2607-z (2020).                                                                    from the copyright holder. To view a copy of this license, visit http://creativecommons.
14. Blanco-Melo, D. et al. Imbalanced host response to SARS-CoV-2 drives              org/licenses/by/4.0/.
    development of COVID-19. Cell 181, e1039 (2020).                                  © The Author(s) 2020

Nature Medicine | www.nature.com/naturemedicine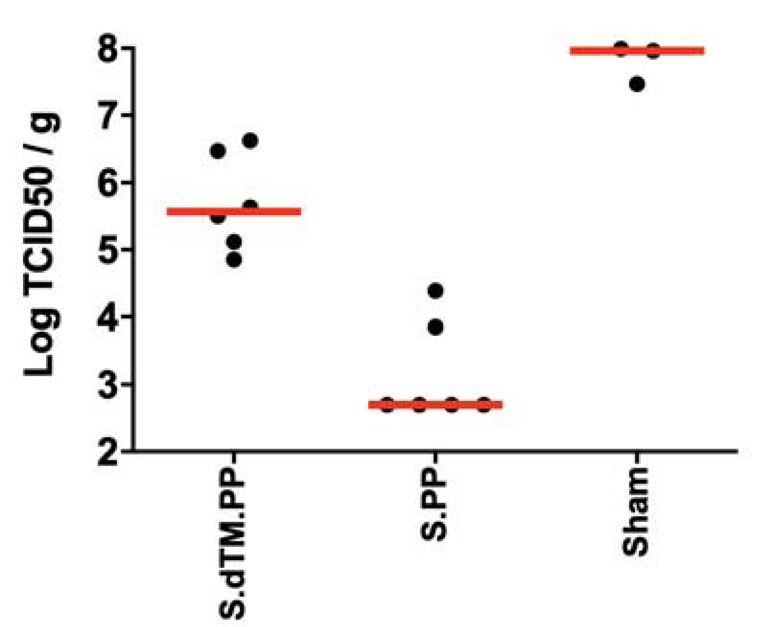
Letters                                                                                                                                    NATuRE MEDICInE

Methods                                                                                bronchioles, cartilage and connective tissue; subsequently, the Cytonuclear v1.6
Animals and study design. Seventy male and female Syrian golden hamsters               module was used to detect MPO+ or CD3+ cells and frequency was calculated as
(Envigo), 10–12 weeks old, were randomly allocated to groups. All animals were         a proportion of total alveolar tissue (polymorphonuclear leukocytes per mm2),
housed at Bioqual. Animals received Ad26 vectors expressing S.dTM.PP or S.PP           determined by running the Area Quantification v2.1.3 module. In all instances,
or sham controls (n = 10 per group). Animals received a single immunization            manual inspection of all images was performed on each sample to ensure that the
of 1010 or 109 vp Ad26 vectors by the intramuscular route without adjuvant at          annotations were accurate.
week 0. At week 4, all animals were challenged with 5.0 × 10⁵ TCID50 (6 × 10⁸ vp,
5.5 × 10⁴ plaque-forming units (PFU)) or 5.0 × 10⁴ TCID50 (6 × 10⁷ vp,                 Subgenomic mRNA assay. SARS-CoV-2 E gene subgenomic mRNA (sgmRNA) was
5.5 × 10³ PFU) SARS-CoV-2, which was derived with one passage from                     assessed by RT–PCR using primers and probes as previously described10,11,23. Briefly,
USA-WA1/2020 (NR-52281, BEI Resources)10. Virus was administered as 100 μl             total RNA was extracted from tissue homogenates from several anatomical sites
by the intranasal route (50 μl in each nare). Body weights were assessed daily. All    using a QIAcube HT (Qiagen) and RNeasy 96 QIAcube HT Kit (Qiagen). A standard
immunologic and virologic assays were performed blinded. On day 4, a subset of         curve was generated using the SARS-CoV-2 E gene sgmRNA by cloning into a
animals was euthanized for tissue viral loads and pathology. All animal studies        pcDNA3.1 expression plasmid; this insert was transcribed using an AmpliCap-Max
were conducted in compliance with all relevant local, state and federal regulations    T7 High Yield Message Maker Kit (Cellscript). Before RT–PCR, samples collected
and were approved by the Bioqual Institutional Animal Care and Use Committee.          from challenged animals or standards were reverse transcribed using Superscript III
                                                                                       VILO (Invitrogen) according to the manufacturer’s instructions. A Taqman custom
Ad26 vectors. Ad26 vectors were constructed with two variants of the                   gene expression assay (Thermo Fisher Scientific) was designed using the sequences
SARS-CoV-2 S protein sequence (Wuhan/WIV04/2019; GenBank MN996528.1).                  targeting the E gene sgmRNA. Reactions were carried out on QuantStudio 6 and 7
Sequences were codon optimized and synthesized. Replication-incompetent,               Flex Real-Time PCR Systems (Applied Biosystems) according to the manufacturer’s
E1/E3-deleted Ad26-vectors19 were produced in PER.C6.TetR cells using a plasmid        specifications. Standard curves were used to calculate sgmRNA copies per gram
containing the full Ad26 vector genome and a transgene expression cassette. Sham       tissue; the quantitative assay sensitivity was 100 copies.
controls included Ad26-Empty vectors. Vectors were sequenced and tested for
expression before use.                                                                 ELISA. RBD-specific binding antibodies were assessed by ELISA essentially as
                                                                                       described10,11. Briefly, 96-well plates were coated with 1 µg ml−1 of SARS-CoV-2
Histopathology and IHC. Tissues were fixed in freshly prepared 4%                      RBD protein (Aaron Schmidt, Massachusetts Consortium on Pathogen
paraformaldehyde for 24 h, transferred to 70% ethanol, paraffin embedded within        Readiness) or 1 µg ml−1 of SARS-CoV-2 S protein (Sino Biological) in 1×
7–10 days and block sectioned at 5 µm. Slides were baked for 30–60 min at 65 °C        Dulbeccoʼs phosphate-buffered saline (DPBS) and incubated at 4 °C overnight.
and then deparaffinized in xylene and rehydrated through a series of graded            After incubation, plates were washed once with wash buffer (0.05% Tween-20
ethanol to distilled water. For SARS-CoV-N, Iba-1 and CD3 IHC, heat-induced            in 1× DPBS) and blocked with 350 µl of casein block per well for 2–3 h at room
epitope retrieval was performed using a pressure cooker on steam setting for           temperature. After incubation, the block solution was discarded and plates were
25 min in citrate buffer (Thermo Fisher Scientific, AP-9003–500), followed by          blotted dry. Three-fold serial dilutions of heat-inactivated serum in casein block
treatment with 3% hydrogen peroxide. Slides were then rinsed in distilled water        were added to wells, and plates were incubated for 1 h at room temperature. Plates
and protein blocked (Biocare, BE965H) for 15 min followed by rinses in 1× PBS.         were washed three times and then subsequently incubated for 1 h with 0.1 µg ml−1
Primary rabbit anti-SARS-CoV-nucleoprotein antibody (Novus, NB100–56576,               of anti-hamster IgG HRP (SouthernBiotech) in casein block at room temperature
at 1:500 or 1:1,000), rabbit anti-Iba-1 antibody (Wako, 019–19741, at 1:500) or        in the dark. Plates were washed three times, and then 100 µl of SeraCare KPL
rabbit anti-CD3 (Dako, A0452, at 1:300) was applied for 30 min, followed by rabbit     TMB SureBlue Start solution was added to each well; plate development was
Mach-2 HRP-Polymer (Biocare, RHRP520L) for 30 min and then counterstained              halted by the addition of 100 µl of SeraCare KPL TMB Stop solution per well. The
with hematoxylin followed by bluing using 0.25% ammonia water. Labeling for            absorbance at 450 nm was recorded using a VersaMax or Omega microplate reader.
SARS-CoV-N, Iba-1 and CD3 was performed on a Biogenex i6000 Autostainer                ELISA endpoint titers were defined as the highest reciprocal serum dilution that
(v3.02). In some cases, CD3, Iba-1 and ACE-2 staining was performed with               yielded an absorbance two-fold above background.
CD3 at 1:400 (Thermo Fisher Scientific, cat. no. RM-9107-S, clone SP7), Iba-1 at
1:500 (Biocare, cat. no. CP290A, polyclonal) or ACE-2 (Abcam, ab108252), all of        Pseudovirus neutralization assay. The SARS-CoV-2 pseudoviruses expressing
which were detected by using Rabbit Polink-1 HRP (GBI Labs, cat. no. D13–110).         a luciferase reporter gene were generated in an approach similar to as described
Neutrophil (MPO) and type 1 IFN response (Mx1) was performed with MPO                  previously10,11,21. Briefly, the packaging construct psPAX2 (AIDS Resource and
(Dako, cat. no. A0398, polyclonal) at 1:1,000 detection using Rabbit Polink-1          Reagent Program), luciferase reporter plasmid pLenti-CMV Puro-Luc (Addgene)
HRP and Mx1 (EMD Millipore, cat. no. MABF938, clone M143/CL143) at 1:1,000             and S protein expressing pcDNA3.1-SARS CoV-2 SΔCT were co-transfected
detection using Mouse Polink-2 HRP (GBI Labs, cat. no. D37–110). Staining for          into HEK293T cells by lipofectamine 2000 (Thermo Fisher Scientific). The
CD3, Iba-1, MPO and Mx1 IHC was performed as previously described using                supernatants containing the pseudotype viruses were collected 48 h after
a Biocare intelliPATH autostainer, with all antibodies being incubated for 1 h at      transfection; pseudotype viruses were purified by filtration with a 0.45-µm filter.
room temperature. Tissue pathology was assessed independently by two veterinary        To determine the neutralization activity of the antisera from vaccinated animals,
pathologists (A.J.M. and C.P.M.).                                                      HEK293T-hACE2 cells were seeded in 96-well tissue culture plates at a density of
                                                                                       1.75 × 10⁴ cells per well overnight. Three-fold serial dilutions of heat-inactivated
RNAscope in situ hybridization. RNAscope in situ hybridization was                     serum samples were prepared and mixed with 50 µl of pseudovirus. The
performed as previously described10 using SARS-CoV2 anti-sense specific probe          mixture was incubated at 37 °C for 1 h before adding to HEK293T-hACE2
v-nCoV2019-S (ACD, cat. no. 848561) targeting the positive-sense viral RNA             cells. Forty-eight hours after infection, cells were lysed in Steady-Glo Luciferase
and SARS-CoV2 sense specific probe v-nCoV2019-orf1ab-sense (ACD, cat. no.              Assay (Promega) according to the manufacturer’s instructions. SARS-CoV-2
859151) targeting the negative-sense genomic vRNA. In brief, after slides were         neutralization titers were defined as the sample dilution at which a 50% reduction
deparaffinized in xylene and rehydrated through a series of graded ethanol to          in relative light units was observed relative to the average of the virus control wells.
distilled water, retrieval was performed for 30 min in ACD P2 retrieval buffer
(ACD, cat. no. 322000) at 95–98 °C, followed by treatment with protease III (ACD,      Luminex. To detect relative quantity of antigen-specific antibody titers, a
cat. no. 322337) diluted 1:10 in PBS for 20 min at 40 °C. Slides were then incubated   customized Luminex assay was performed as previously described25. Hereby,
with 3% H2O2 in PBS for 10 min at room temperature. Before hybridization,              fluorescently labeled microspheres (Luminex) were coupled with SARS-CoV-2
probe stocks were centrifuged at 13,000 r.p.m. using a microcentrifuge for 10 min      antigens including S protein (Eric Fischer, Dana Farber Cancer Institute), S1
and then diluted 1:2 in probe diluent (ACD, cat. no. 300041) to reduce probe           and S2 (Sino Biological), as well as RBD (Aaron Schmidt, Ragon Institute) via
aggregation tissue artifacts. Slides were developed using the RNAscope 2.5 HD          covalent N-hydroxysuccinimide (NHS)–ester linkages via EDC (Thermo Fisher
Detection Reagents-RED (ACD, cat. no. 322360).                                         Scientific) and Sulfo-NHS (Thermo Fisher Scientific). Then, 1.2 × 10³ beads per
                                                                                       region and antigen were added to a 384-well plate (Greiner) and incubated with
Quantitative image analysis. Quantitative image analysis was performed using           diluted serum (1:90 for IgG2a, IgG3, IgM; 1:500 for total IgG and Fc-receptor
HALO software (v2.3.2089.27 or v3.0.311.405; Indica Labs) on at least one lung         binding assays) for 16 h shaking at 900 r.p.m. at 4 °C. After formation of immune
lobe cross-section from each animal. In cases where more than one cross-section        complexes, microspheres were washed three times in 0.1% bovine serum albumin
was available, each lung lobe was quantified as an individual data point. For          and 0.05% Tween-20 (Luminex assay buffer) using an automated plate washer
SARS-CoV-N, the Multiplex IHC v2.3.4 algorithm was used with an exclusion              (Tecan). PE-labeled goat anti-mouse IgG, IgG2a, IgG3 and IgM detection
screen for acid hematin to determine the percentage of SAR-N protein positive          antibodies (SouthernBiotech) were diluted in Luminex assay buffer to 0.65 µg ml−1
cells as a proportion of the total number of cells. For Iba-1, the Multiplex IHC       and incubated with beads for 1 h at room temperature while shaking at 900 r.p.m.
v2.3.4 algorithm was used for quantitation. For SARS-CoV-2 RNAscope ISH and            Similarly, for the Fc-receptor binding profiles, recombinant mouse FcγR2, FcγR3
Mx1 quantification, the Area Quantification v2.1.3 module was used to determine        and FcγR4 (Duke Protein Production Facility) were biotinylated (Thermo Fisher
the percentage of total SARS-CoV-2 anti-sense or sense probe or Mx1 protein            Scientific) and conjugated to Streptavidin-PE for 10 min before addition to samples
as a proportion of the total tissue area. For MPO (neutrophil) and CD3+ cell           (SouthernBiotech). These mouse antibodies and proteins are cross-reactive to
quantification, slides were annotated to exclude blood vessels (>5 mm2), bronchi,      hamster. The coated beads were then washed and read on a flow cytometer, iQue

                                                                                                                        Nature Medicine | www.nature.com/naturemedicine
NATuRE MEDICInE Letters
(IntelliCyt), with a robot arm attached (PAA). Events were gated on each bead 26. Fischinger, S. et al. A high-throughput, bead-based, antigen-specific assay to
region; median fluorescence of PE of bead-positive events was reported. Samples assess the ability of antibodies to induce complement activation. J. Immunol.
were run in duplicate per each secondary detection agent. Methods 473, 112630 (2019).
ADCD. ADCD assays were performed as previously described26. Briefly, Acknowledgements
SARS-CoV-2 S and RBD were biotinylated (Thermo Fisher Scientific) and coupled We thank J. van Hoof, M. Mammon, P. Stoffels, D. van Manen, T. Kwaks, K. Bauer,
to 1 μm red fluorescent neutravidin beads (Thermo Fisher Scientific) for 2 h N. Callaham, L. Mistretta, A. Thomas, A. Chandrashekar, L. Peter, L. Maxfield, M. Lifton,
at 37 °C, and excess antigen was washed away afterwards. For the formation of E. Borducchi, M. Silva, A. Richardson and C. Caron for generous advice, assistance
immune complexes, 1.82 × 10⁸ antigen-coated beads were added to each well of and reagents. We acknowledge support from the Bill & Melinda Gates Foundation
a 96-well round bottom plate and incubated with 1:10 diluted samples at 37 °C (INV-006131), Janssen Vaccines & Prevention BV, the Ragon Institute of MGH, MIT
for 2 h. Lyophilized guinea pig complement was reconstituted according to the and Harvard, the Mark and Lisa Schwartz Foundation, the Massachusetts Consortium
manufacturer’s instructions (Cedarlane) with water, and 4 μl per well was added in on Pathogen Readiness and the National Institutes of Health (OD024917, AI129797,
gelatin veronal buffer containing Mg2+ and Ca2+ (GVB++, Boston BioProducts) to AI124377, AI128751, AI126603 to D.H.B.; AI007387 to L.H.T.; AI146779 to A.G.S.;
the immune complexes for 20 min at 37 °C. Immune complexes were washed with AI135098 to A.J.M.; and OD011092, OD025002 to J.D.E.). This project was funded, in
15 mM ethylenediaminetetraacetic acid in PBS, and fluorescein-conjugated goat part, by the Department of Health and Human Services Biomedical Advanced Research
IgG fraction to guinea pig complement C3 (MP Biomedicals) was added. After and Development Authority under contract HHS0100201700018C. We also acknowledge
staining, samples were fixed with 4% paraformaldehyde, and sample acquisition was a Fast Grant, Emergent Ventures, Mercatus Center at George Mason University to A.J.M.
performed via flow cytometry (IntelliCyt, iQue Screener Plus) using a robot arm
(PAA). All events were gated on single cells and bead-positive events; the median of
C3-positive events is reported. All samples were run in duplicate on separate days. Author contributions
L.H.T., H.A., M.G.L., F.W., R.Z. and D.H.B. designed the study and reviewed all data.
Statistical analysis. Analysis of immunologic, virologic and body weight data F.W., J.C., H.S. and R.Z. designed the vaccines. A.J.M., C.N.C., S.B., C.E.S., M.N., K.B.-S.,
was performed using GraphPad Prism 8.4.2 (GraphPad Software). Comparison C.P.-M., L.M.W., S.D. and J.D.E. performed the pathology. L.H.T., K.M., N.B.M., J.Y.,
of data between groups was performed using two-sided Mann–Whitney tests. E.A.B., G.D., M.S.G., C.J.D., Z.L., S.H.M., F.N. and R.N. performed the immunologic and
Mortality was assessed by two-sided Fisher’s exact tests. Correlations were assessed virologic assays. C.L., C.A., S.F., J.S.B., D.A.L. and G.A. performed the systems serology.
by two-sided Spearmanʼs rank correlation tests. P values of less than 0.05 were L.P., M.P., V.A., D.B., K.T., H.A. and M.G.L. led the clinical care of the animals. J.F.,
considered significant. All systems serology data were log10 transformed. For the B.M.H., T.M.C., Y.C., B.C. and A.G.S. provided purified proteins. D.H.B. wrote the paper
radar plots, each antibody feature was normalized such that its minimal value with all co-authors.
is 0 and the maximal value is 1 across groups before using the median within a
group. A PCA was constructed using the R version 3.6.1 package ‘ropls’ to compare Competing interests
multivariate profiles. For the visualization in the heat map, the differences in the D.H.B., F.W., J.C., H.S. and R.Z. are co-inventors on related vaccine patents. F.W., J.C.,
means of the S.dTM.PP and S.PP groups of z-scored features were shown. To H.S. and R.Z. are employees of Janssen Vaccines & Prevention BV and hold stock in
indicate significances in the heat maps, a Benjamini–Hochberg correction was Johnson & Johnson.
used to correct for multiple comparisons within a row.
Reporting Summary. Further information on research design is available in the
Nature Research Reporting Summary linked to this article.
Additional information
Data availability Extended data is available for this paper at https://doi.org/10.1038/s41591-020-1070-6.
All data are available in the manuscript or the supplementary material. Supplementary information is available for this paper at https://doi.org/10.1038/
Correspondence and requests for materials should be addressed to D.H.B. s41591-020-1070-6.
(dbarouch@bidmc.harvard.edu).
Correspondence and requests for materials should be addressed to D.H.B.
References Peer review information Joao Monteiro was the primary editor on this article and
25. Brown, E. P. et al. High-throughput, multiplexed IgG subclassing of managed its editorial process and peer review in collaboration with the rest of the
antigen-specific antibodies from clinical samples. J. Immunol. Methods 386, editorial team.
117–123 (2012). Reprints and permissions information is available at www.nature.com/reprints.
Nature Medicine | www.nature.com/naturemedicineLetters NATuRE MEDICInE
Extended Data Fig. 1 | Longitudinal quantitative image analysis of viral replication and associated inflammation in lungs. a, Percent lung area positive for
anti-sense SARS-CoV-2 viral RNA (vRNA) by RNAscope ISH. b, Percentage of total cells positive for SARS-CoV-N protein (nuclear or cytoplasmic) by IHC.
c, Iba-1 positive cells per unit area by IHC. d, CD3 positive cells per unit area. e, MPO positive cells per unit area. f, Percentage of MX1 positive lung tissue
as a proportion of total lung area. ISH, in situ hybridization; IHC, immunohistochemistry; SARS-N, SARS-CoV nucleocapsid; MPO, myeloperoxidase; MX1,
myxovirus protein 1 (a type 1 interferon inducible gene). Each dot represents one animal.
Nature Medicine | www.nature.com/naturemedicineNATuRE MEDICInE Letters Extended Data Fig. 2 | Lung viral dynamics and ACE2 receptor expression patterns. Hamsters were necropsied before (SARS-CoV-2 Negative) or after high-dose SARS-CoV-2 challenge on day 2 (D2), day 4 (D4), day 7 (D7), and day 14 (D14) following challenge. Serial sections of lung tissue were stained for vRNA anti-sense RNAscope a-e, for vRNA sense RNAscope f-j, and ACE2 IHC k-o. Anti-sense RNAscope used a sense probe; sense RNAscope used an anti-sense probe. IHC, immunohistochemistry. Representative sections are shown. Experiments were repeated at least 3 times with similar results. Scale bars = 100 μm. Nature Medicine | www.nature.com/naturemedicine
Letters                                                                                                                      NATuRE MEDICInE

Extended Data Fig. 3 | Extrapulmonary pathology. a, Anti-sense SARS-CoV-2 viral RNA (vRNA) in brainstem on day 2 following challenge. b, Higher
magnification showing cytoplasmic vRNA staining in neurons in the absence of inflammation and pathology. c, Anti-sense SARS-CoV-2 vRNA staining
in the lamina propria of small intestinal villus on day 2 following challenge. d, Higher magnification showing cytoplasmic and nuclear vRNA staining in an
individual mononuclear cell in the absence of inflammation and tissue pathology. e, Anti-sense SARS-CoV-2 vRNA staining within the myocardium and
along the epicardial surface of the heart on day 4 following challenge. f, Higher magnification showing staining of inflammatory mononuclear cell infiltrates
consistent with focal myocarditis. g, Pulmonary vessel showing endothelialitis day 4 (d4) following challenge. h, Pulmonary vessel showing CD3+ T
lymphocyte staining by IHC adhered to endothelium and within vessel wall, d4 following challenge. i, Pulmonary vessel showing Iba-1+ staining by IHC
of macrophages along endothelium and perivascularly, d4. j, Pulmonary vessel showing minimal vascular staining for SARS-CoV-N by IHC, d4. k, Heart
from (e, f) showing focal lymphocytic myocarditis as confirmed by CD3+ T lymphocyte staining l, of cells by IHC, d4. Representative sections are shown.
Experiments were repeated at least 3 times with similar results. Scale bars = 500 μm (a, c, e); 100 μm (b, d, f, g-l).

                                                                                                            Nature Medicine | www.nature.com/naturemedicine
NATuRE MEDICInE Letters Extended Data Fig. 4 | SARS-CoV-2 in blood mononuclear cells and bone marrow. a-c, SARS-CoV-2 anti-sense vRNA staining within mononuclear cells within lung thrombus on day 2 following challenge. d, Bone marrow from the nasal turbinate 4 days following challenge showing e, hematopoetic cells (H&E) that show f, positive staining for SARS-CoV-N IHC. vRNA, viral RNA; H&E, hematoxylin and eosin; IHC, immunohistochemistry. Representative sections are shown. Experiments were repeated at least 3 times with similar results. Scale bars = 500 μm (a); 200 μm (d); 100 μm (b, c, e, f). Nature Medicine | www.nature.com/naturemedicine
Letters                                                             NATuRE MEDICInE

Extended Data Fig. 5 | See next page for caption.

                                                    Nature Medicine | www.nature.com/naturemedicine
NATuRE MEDICInE Letters Extended Data Fig. 5 | Correlation of antibody titers and survival curves. a, Correlations of binding ELISA titers and pseudovirus NAb titers at week 2 and week 4. Red lines reflect the best linear fit relationship between these variables. P and R values reflect two-sided Spearman rank-correlation tests. b, Survival curve for the vaccine study. P values indicate two-sided Fisher’s exact tests. N denotes number of animals in each group. c, Combined analysis of the two hamster studies involving all animals that received the 5x10⁵ TCID50 challenge dose and were followed longitudinally. P values indicate two-sided Fisher’s exact tests. N denotes number of animals in each group. Nature Medicine | www.nature.com/naturemedicine
Letters                                                                                                                     NATuRE MEDICInE

Extended Data Fig. 6 | Antibody correlates of clinical protection. Correlations of a, binding ELISA titers and b, pseudovirus NAb titers at week 2 and week
4 with maximum percent weight loss following challenge. Red lines reflect the best linear fit relationship between these variables. P and R values reflect
two-sided Spearman rank-correlation tests.

                                                                                                           Nature Medicine | www.nature.com/naturemedicine
NATuRE MEDICInE Letters
12 12 12
Log RNA Copies / g
Log RNA Copies / g
Log RNA Copies / g
10 10 10
8 8 8
6 6 6
4 4 4
2 2 2
Lung
Trachea
GI
Brain
Spleen
Liver
Kidney
Trachea
Nares
Heart
Lung
Nares
Heart
GI
Brain
Spleen
Liver
Kidney
Lung
Trachea
GI
Brain
Spleen
Liver
Kidney
Nares
Heart
6 6 6
Log RNA Copies / g
Log RNA Copies / g
Log RNA Copies / g
4 4 4
2 2 2
Lung
Trachea
Liver
Kidney
Trachea
Nares
Heart
GI
Brain
Spleen
Lung
Nares
Heart
GI
Brain
Spleen
Liver
Kidney
Lung
Trachea
Heart
GI
Brain
Spleen
Liver
Kidney
Nares
Extended Data Fig. 7 | Tissue viral loads on day 4 and day 14. Tissue viral loads as measured by a, log10 subgenomic RNA copies per gram tissue (limit of
quantification 100 copies/g) and b, log10 infectious virus TCID50 titers per gram tissue (limit of quantification 100 TCID50/g) on day 4 (N=6 reflects both
dose groups for each vaccine) and c, log10 subgenomic RNA copies per gram tissue on day 14 (N=14 reflects both dose groups for each vaccine) following
challenge. Red lines reflect median values. Each dot represents one animal.
Nature Medicine | www.nature.com/naturemedicineLetters NATuRE MEDICInE
Extended Data Fig. 8 | Antibody correlates of protection. Correlations of a, c, binding ELISA titers and b, d, pseudovirus NAb titers at week 2 and week 4
with log10 RNA copies per gram (a, b) lung and (c, d) nasal turbinate tissue in the animals that were necropsied on day 4. Red lines reflect the best linear fit
relationship between these variables. P and R values reflect two-sided Spearman rank-correlation tests.
Nature Medicine | www.nature.com/naturemedicineNATuRE MEDICInE Letters
100000 10000
10000
ELISA Titer
1000
NAb Titer
1000
100
100
10 10
1010 109 1010 109 Sham 1010 109 1010 109 Sham
Extended Data Fig. 9 | Antibody correlates of protection and anamnestic responses. a, The heatmaps show the Spearman rank correlation between
antibody features and weight loss (N=35), lung viral loads (N=12), and nasal turbinate viral loads (N=12). N reflects all animals that were followed for
weight loss or that were necropsied for lung or nasal turbinate viral loads. Significant correlations are indicated by stars after multiple testing correction
using the Benjamini-Hochberg procedure (*q < 0.05, ** q < 0.01, *** q < 0.001). b, ELISA and NAb responses in surviving hamsters on day 14 following
SARS-CoV-2 challenge.
Nature Medicine | www.nature.com/naturemedicineYou can also read