Addictive Internet Gaming Usage among Korean Adolescents before and after the Outbreak of the COVID-19 Pandemic: A Comparison of the Latent ...
←
→
Page content transcription
If your browser does not render page correctly, please read the page content below
International Journal of
               Environmental Research
               and Public Health

Article
Addictive Internet Gaming Usage among Korean Adolescents
before and after the Outbreak of the COVID-19 Pandemic: A
Comparison of the Latent Profiles in 2018 and 2020
Dongil Kim               and Junwon Lee *

                                            Department of Education, College of Education, Seoul National University, Seoul 08826, Korea;
                                            dikimedu@snu.ac.kr
                                            * Correspondence: syncmaster7x@snu.ac.kr

                                            Abstract: Since the outbreak of the COVID-19 pandemic, the heightened risk of school closures
                                            and mental disorders has made adolescents particularly vulnerable to developing internet gaming
                                            disorder (IGD). There have been reports of increased time spent playing games on the internet among
                                            adolescents during the pandemic, and the risk of developing IGD may be higher for adolescents
                                            in South Korea as the majority of them play games on the internet. However, to the best of our
                                            knowledge, no studies have examined the impact of the pandemic on adolescents’ internet gaming
                                            behavior in South Korea. This study aimed to explore the different profiles of addictive internet
                                            gaming behavior among adolescents before and after the outbreak of the COVID-19 pandemic and
                                            examine how the pandemic influenced addictive internet gaming usage and time spent playing

                                     games on the internet. Nationally representative survey data from the Ministry of Gender Equality
                                            and Family with 3040 and 2906 responses from 2018 and 2020, respectively, were analyzed. Using
Citation: Kim, D.; Lee, J. Addictive
Internet Gaming Usage among
                                            seven factors of a maladaptive gaming usage scale (tolerance, withdrawal, excessive usage, control
Korean Adolescents before and after         impairment, compulsive usage, neglecting daily activity, and gaming despite negative consequence),
the Outbreak of the COVID-19                a four-profile model was selected in both 2018 and 2020 for latent profile analysis: ‘casual’ gamer,
Pandemic: A Comparison of the               ‘moderate’ gamer, ‘potential-risk’ gamer and ‘addictive’ gamer. The results from the two-way
Latent Profiles in 2018 and 2020. Int. J.   ANCOVA showed significant interaction between the cohorts (2018 cohort vs. 2020 cohort) and the
Environ. Res. Public Health 2021, 18,       four profiles on addictive internet gaming usage (F = 119.747, p < 0.001, η2 = 0.05), including time
7275. https://doi.org/10.3390/              spent playing internet games on a PC (F = 22.893, p < 0.001, η2 = 0.013), and time spent playing
ijerph18147275                              games on a mobile phone (F = 3.245, p < 0.05, η2 = 0.02). The results indicated that the increase of
                                            addictive internet gaming usage and gameplay time differed by profile. The results imply that the
Academic Editor: Gergely Fehér
                                            increase in gameplay time was higher for profiles with higher scores in addictive internet gaming
                                            usage for internet games played on a PC while the relationship was not obvious for games played on
Received: 3 May 2021
Accepted: 4 July 2021
                                            a mobile phone. Despite the statistical significance, there was only 1.2% to 4.9% of mean difference
Published: 7 July 2021                      in addictive internet gaming usage between the 2018 and 2020 cohorts, which implies little clinical
                                            significance. While adolescents of the four profiles showed no significant signs of increased addictive
Publisher’s Note: MDPI stays neutral        internet gaming usage, the addictive gamer profile demonstrated a significant increase in game time
with regard to jurisdictional claims in     after COVID-19.
published maps and institutional affil-
iations.                                    Keywords: internet gaming disorder; adolescents; COVID-19; gameplay time; Korea

Copyright: © 2021 by the authors.           1. Introduction
Licensee MDPI, Basel, Switzerland.               Since the outbreak of the COVID-19 pandemic in January 2020, our daily lives have
This article is an open access article      been disrupted due to social distancing and quarantine, along with the fear of infection
distributed under the terms and             and stress, resulting in an increased prevalence of psychological disorders, such as depres-
conditions of the Creative Commons          sion, anxiety, suicidal behavior, and heightened stress [1–4]. Additionally, a recent study
Attribution (CC BY) license (https://       conducted in China reported anxiety, depression, and stress to be the three most prevalent
creativecommons.org/licenses/by/            psychological symptoms of adolescents during the COVID-19 school closure in China [5],
4.0/).

Int. J. Environ. Res. Public Health 2021, 18, 7275. https://doi.org/10.3390/ijerph18147275                       https://www.mdpi.com/journal/ijerph
Int. J. Environ. Res. Public Health 2021, 18, 7275                                                                             2 of 17

                                        and another study reported that one-third of the children in Italy, Spain, and Portugal
                                        experienced anxiety during the COVID-19 quarantine [6].
                                              Along with the increased risk of having psychological symptoms of depression, anxi-
                                        ety, and stress due to the impact of the pandemic, scholars have warned about the increased
                                        risk of developing a behavioral addiction, such as internet gaming disorder (IGD), which is
                                        known to be more prevalent in males [7–11], in particular among adolescents [12,13]. The
                                        Diagnostic and Statistical Manual of Mental Disorders 5 (DSM-5) outlines the following
                                        symptoms as criteria for IGD: preoccupation, withdrawal, tolerance, failure to reduce or
                                        stop gaming, neglecting other activities, continuing gaming despite problems, deception,
                                        gaming to escape, and relationship risk due to excessive gaming [14]. To be diagnosed
                                        with IGD, a person should exhibit at least five of the symptoms for at least twelve months.
                                        Similarly, gaming disorder (GD), as classified by the 11th edition of the International
                                        Classification of Disease (ICD-11), comprises the following three symptoms: impaired
                                        control, increased priority given to gaming, and continued gaming despite negative conse-
                                        quences [15]; these symptoms focus on impairment of function while excluding biological
                                        aspects of addiction such as tolerance and withdrawal [16]. According to the ICD-11, a
                                        person should exhibit the aforementioned three symptoms for at least twelve months to be
                                        diagnosed with GD.
                                              The relationship between psychological problems and IGD is reported globally [7,9],
                                        implying a heightened risk of adolescents developing IGD during the COVID-19 pandemic.
                                        One study conducted in Iran suggested that IGD significantly affected depression and anxi-
                                        ety among adolescents during the COVID-19 pandemic [17], and a recent study conducted
                                        in China reported an increased prevalence of IGD among adolescents after the outbreak
                                        of the COVID-19 pandemic [18]. In Italy, anxiety was found to be a predictor for online
                                        videogame and addiction [19], and a study from Japan indicated an increased prevalence
                                        of IGD, especially in the younger population [20]. In addition, one study from Hong Kong
                                        indicated that female children and adolescents felt more loneliness during the pandemic,
                                        while showing a significant relationship between loneliness and gaming addiction [21].
                                              While internet gaming can be used as a means to relieve stressful situations during the
                                        COVID-19 [22] pandemic, most adolescents enjoy gaming in a healthy manner, resulting
                                        in positive outcomes such as a sense of achievement, friendship, and community [23–26].
                                        During the COVID-19 pandemic, online gaming was found to relieve emotional distress
                                        due to social isolation [27], provide social support [28], and reduce loneliness [29]. How-
                                        ever, the negative impacts of IGD are clear and should not be overlooked [30]. IGD can
                                        result in insomnia [17] and impairment in interpersonal relationships, education, and occu-
                                        pation [22]. Due to school closures, limited extracurricular activity, and social distancing
                                        during the COVID-19 pandemic, adolescents were forced to spend more time at home; this
                                        has since led to increased time spent partaking in internet gaming [31,32]. The environment
                                        of the pandemic induced an increase in internet usage, which may increase the risk of
                                        developing addictive behaviors in adolescents that persist throughout their lifespan [33].
                                        One study from China reported that problematic gaming was a significant mediator of a
                                        relationship between psychological distress and time spent on internet related activities
                                        during the COVID-19 pandemic [34]. According to the interaction of the person-affect-
                                        cognition-execution (I-PACE) model [35], addiction develops from the interaction of the
                                        context (isolation and stress due to the pandemic), personal reaction (playing games on the
                                        internet to reduce stress and feel relieved), and consequences (neural changes, habituation,
                                        and compulsion) of repeated behaviors [35]. During the COVID-19 pandemic, playing
                                        games on the internet in moderation was viewed as a coping mechanism to reduce stress.
                                        However, there was a possibility of excessively playing games on the internet as isola-
                                        tion and social distancing severely limit available activities to reduce stress; this in turn
                                        accelerates the development of addictive behavior into a ‘later stage’ of addiction [35]. A
                                        longitudinal study on IGD in China used the I-PACE model to examine the relationship
                                        between emotional intelligence and depressive symptoms, coping flexibility, and IGD [36].
Int. J. Environ. Res. Public Health 2021, 18, 7275                                                                             3 of 17

                                              The impact of the pandemic on IGD may be greater for adolescents in South Korea
                                        due to a very high proportion of gamers—as high as 91.5%—among the adolescent pop-
                                        ulation [37]. The results of the nationally representative survey conducted by the Korea
                                        Creative Agency (2020) indicated that more than half of the adolescents confirmed that the
                                        time spent playing games on the internet increased during the COVID-19 pandemic [37].
                                              Although the time spent on internet gaming increased during the pandemic among
                                        South Korean adolescents, it is not certain whether IGD symptoms also increased compared
                                        with periods before the pandemic. Excessive internet usage has been known as an indicator
                                        of behavioral addiction since the conceptualization of internet addiction [38]. The deficient
                                        self-regulation perspective argues that excessive internet usage is a result of addictive
                                        internet usage [39]. Similarly, the I-PACE model explains that repeated gratification (such
                                        as relieving stress) of internet gaming behavior can change coping styles and reward
                                        expectancy; this may lead to an increased urge to play games on the internet when stressed
                                        and a weakened inhibitory response, which in turn, may increase the frequency of playing
                                        games and gameplay time [35]. Several studies suggest a strong relationship between time
                                        spent playing games on the internet and IGD [40–42]. However, some studies suggest
                                        a weak or no relationship, whereby the negative consequences of intensive gaming are
                                        not equal to those of pathological gaming [43–46]. One example of a highly involved, but
                                        not pathological, gamer is a professional gamer. An MRI study of the brain indicates that
                                        professional gamers have different volumes of gray matter compared to people with an
                                        online game addiction [47].
                                              Moreover, the increasing trend in play time may influence adolescents differently. In a
                                        recent study, the IGD group exhibited higher gameplay time than the non-IGD group [42].
                                        In a global study on the development of the IGD scale, five latent groups emerged with
                                        symptoms based on IGD in the DSM-5 [48]. Another IGD scale development study con-
                                        ducted in the Netherlands reported three latent groups based on the nine criteria of the
                                        DSM-5 [8]. In accordance with the I-PACE model, gameplay time in adolescents with more
                                        severe IGD symptoms might have increased further during the COVID-19 pandemic than
                                        in other healthier or non-severe groups of adolescents [35]. Therefore, the impact of the
                                        COVID-19 pandemic on adolescents’ addictive internet gaming behavior requires further
                                        investigation.
                                              The aim of this study was to answer the following five research questions. First, do
                                        unique latent profiles of addictive internet gaming exist among South Korean adolescents;
                                        second, if unique latent profiles exist, do their memberships differ by gender; third, do
                                        total addictive internet game usage scores differ by profile membership and year; fourth,
                                        does internet gameplay time on a PC differ by profile membership and year; fifth, does
                                        gameplay time on mobile phones differ by profile membership and year.

                                        2. Materials and Methods
                                        2.1. Materials
                                             The datasets analyzed in this study were obtained as secondary data from a nationally
                                        representative survey from the Ministry of Gender Equality and Family of South Korea,
                                        conducted biennially. The survey was approved by the Ministry of Gender Equality
                                        and Family and was conducted by the National Youth Policy Institute, a government-
                                        funded research institute. Data were collected using survey questionnaires distributed and
                                        collected by trained individuals from a registered research company from November to
                                        December in 2018 and 2020, approximately one year before and one year after the outbreak
                                        of the COVID-19 pandemic. Elementary students from grades four to six and middle school
                                        students from all seven provinces of South Korea were recruited for the survey. In total,
                                        3317 and 3149 responses were collected in 2018 and 2020, respectively. After excluding
                                        survey responses with missing data using listwise deletion, 3040 responses from 2018, and
                                        2906 responses from 2020 were analyzed [49,50]. In 2018, 48.3% of the respondents were
                                        female and 51.8% were elementary students with a mean age of 13.46 years (SD = 1.71); in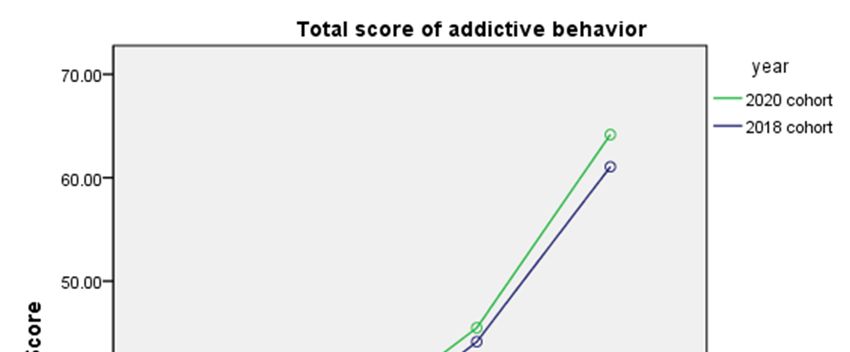
Int. J. Environ. Res. Public Health 2021, 18, 7275                                                                                 4 of 17

                                        2020, 48.5% of the respondents were female and 47.1% were elementary students with a
                                        mean age of 13.62 years (SD = 1.71).

                                        2.2. Measures
                                        2.2.1. Addictive Internet Gaming Usage
                                             Addictive internet gaming usage was measured using the maladaptive game use scale
                                        (MGUS) [51]. The scale measures addictive gaming usage over the past year using a four-
                                        point Likert scale ranging from 1 (strongly disagree) to 4 (strongly agree). During the survey
                                        in 2018 and 2020, participants were instructed to answer the questionnaire specifically about
                                        internet gaming. The scale measures seven factors: tolerance (requiring longer playing time
                                        to feel the same amount of satisfaction), withdrawal (reducing online gameplaying time
                                        induces anxiety), excessive usage (playing online games longer than planned most of the
                                        time), control impairment (attempts to reduce online gaming ends up failing), compulsive
                                        usage (playing online games every day), neglecting daily activity (academic performance
                                        decreasing significantly) and gaming despite negative consequences (continue playing
                                        online games despite a conflict with parents), all of which include most of the criteria of
                                        IGD in DSM-V and all three criteria of GD in ICD-11. A score of nine or above in three or
                                        more factors indicated game addiction. Each factor was measured using three questions
                                        with a total of twenty-one questions. The total possible score ranged from twenty-one
                                        to eighty-four and the score of each factor ranged from three to twelve. The reported
                                        reliability of this scale was 0.92 [51]. In this study, the reliability was 0.95 for 2018 and 0.94
                                        for 2020.

                                        2.2.2. Time Spent Playing Internet Games on a PC and Mobile Phones
                                              The average gameplay time was measured as the average time spent playing internet
                                        games on a PC and games on a mobile phone during weekdays. The amount of play time
                                        was measured with two single open-ended questions: “On average, how much time do you
                                        spend playing Internet games on your PC on a weekday?” and “On average, how much
                                        time do you spend playing internet games on your mobile on a weekday?” Empty space
                                        was provided to record gameplay time in hours and minutes, which was then converted
                                        into total minutes. Since differences in characteristics have been reported between internet
                                        games played on a PC and games played on a mobile phone, play times of the two were
                                        evaluated separately. While internet games played on a PC, such as World of Warcraft,
                                        require a gamer to invest a large amount of time and concentration [25], games played on a
                                        mobile phone usually do not require prolonged involvement. Further, differences were
                                        identified between internet gaming using PCs and smartphones in a previous study in
                                        South Korea [52].

                                        2.3. Data Analysis
                                             Latent profile analysis (LPA) was used to estimate latent profiles of addictive internet
                                        gaming behavior of adolescents using seven factors of the MGUS in the 2018 and 2020
                                        cohorts. To examine the effect of gender as a predictor of profile membership, a multinomial
                                        analysis was performed using the R3step procedure [53]. To compare the differences in
                                        time spent on gaming and addictive behaviors among profiles from the 2018 and 2020
                                        cohorts, a two-way analysis of covariance (ANCOVA) was used after controlling for school
                                        level and gender. The post hoc test of the main effect was performed using the Bonferroni
                                        correction. LPA was performed using Mplus 8.2 software and ANCOVA was performed
                                        using SPSS 21.0 software.

                                        3. Results
                                        3.1. Correlation Analysis between MGUS Factors and Total Gaming Time
                                             To explore the relationship among the seven MGUS factors and total gaming time in
                                        both 2018 and 2020, correlation analysis was conducted. The result indicted that all seven
                                        factors and total gaming time had significant positive correlation (p < 0.01). The correlation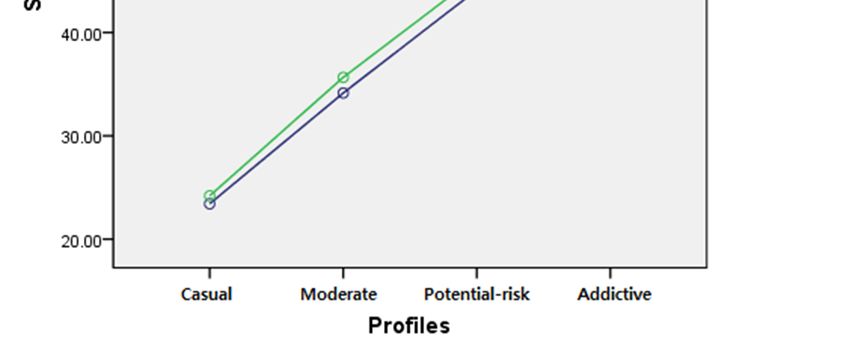
Int. J. Environ. Res. Public Health 2021, 18, 7275                                                                                                        5 of 17

                                          between total gaming time and the seven factors ranged from 0.225 to 0.358. The correlation
                                          between the seven factors ranged from 0.493 to 0.721. The results are presented in Table 1.

                                   Table 1. Correlation between seven MGUS factors and total gaming time.

                                                                      Excessive            Control         Compulsive         Neglecting       Negative
                            Tolerance 1         Withdrawal 2           Usage 3           Impairment 4        Usage 5          Activity 6     Consequence 7
          1                       1
          2                   0.721 ***                  1
          3                   0.665 ***              0.584 ***              1
          4                   0.622 ***              0.612 ***          0.718 ***                1
          5                   0.675 ***              0.667 ***          0.619 ***            0.641 ***             1
          6                   0.617 ***              0.651 ***          0.493 ***            0.551 ***         0.613 ***           1
          7                   0.669 ***              0.669 ***          0.642 ***            0.649 ***         0.667 ***       0.688 ***            1
  Total gaming time           0.271 ***              0.225 ***          0.266 ***            0.244 ***         0.358 ***       0.266 ***        0.278 ***
                                                                            *** p < 0.001.

                                          3.2. Latent Profile Analysis
                                                To determine the optimal number of latent profiles, Akaike’s information criterion
                                          (AIC), Bayesian information criterion (BIC), sample size adjusted BIC (SABIC), entropy,
                                          Lo-Mendell-Rubin adjusted likelihood ratio test (MLR-LRT), bootstrap likelihood ratio
                                          test (BLRT), parsimony, and interpretability were considered. From previous studies, the
                                          number of profiles expected ranged from three to five [8,48]. AIC, BIC, and SABIC provided
                                          relative fit indexes and a smaller value indicated a better fit of the model [54]. Entropy
                                          examined classification accuracy with values ranging from zero to one, with higher scores
                                          representing higher accuracy [55]. The likelihood ratio test compared models by assessing
                                          whether increasing a class by one significantly improved the fit of the models [55]. Six
                                          profiles were estimated for the 2018 and 2020 cohorts. The fit indexes and results of the
                                          likelihood ratio test are presented in Table 2.

                                          Table 2. Fit indexes for the 2018 and 2020 cohorts.

                                                                                                                                  LMR-LRT,         BLRT,
                                             Profile #            AIC                 BIC            SABIC          Entropy
                                                                                                                                   p-Value        p-Value
                                                                                               Year 2018 Cohort
                                                 2               73076.62           73209.05        73139.14          0.949            0              0
                                                 3               69917.63           70098.22        70002.90          0.952          0.001            0
                                                 4               68186.72           68415.46        68294.72          0.920          0.009            0
                                                 5               67540.25           67817.15        67670.99          0.922          0.352            0
                                                 6               66912.49           67237.85        67066.27          0.924          0.555            0
                                                                                               Year 2020 Cohort
                                                 2               72466.88           72598.31        72528.41          0.928            0              0
                                                 3               69894.28           70073.52        69978.20          0.935          0.008            0
                                                 4               68663.18           68890.21        68769.47          0.893          0.052            0
                                                 5               68128.04           68402.87        68256.71          0.894          0.599            0
                                                 6               67476.44           67799.06        67627.48          0.901          0.003            0
                                          Notes: AIC: Akaike information criterion; BIC: Bayesian information criterion; SABIC sample size adjusted BIC;
                                          LMR-LRT: Lo-Mendell-Rubin adjusted likelihood ratio test; BLRT: bootstrap likelihood ratio test.

                                               Considering the statistical criteria, models with four and five profiles emerged as
                                          models with the optimal number of profiles. AIC, BIC, and SABIC improved as the
                                          number of profiles increased and the BLRT also indicated that as the number of profiles
                                          increased the statistical fit improved significantly. For the LMR-LRT results, the model fit
                                          improved significantly until the four-profile model of the 2018 cohort and nearly significant
                                          improvement was observed in the four-profile model of the 2020 cohort. All models showed
                                          an entropy higher than 0.8, indicating adequate classification accuracy. In the five-profile
                                          model, one of the classes from the four-profile model diverged into two different classes
                                          which caused a challenging interpretation. Taking interpretability and parsimony into
                                          account, a four-profile model was selected over a five-profile model. Compared to the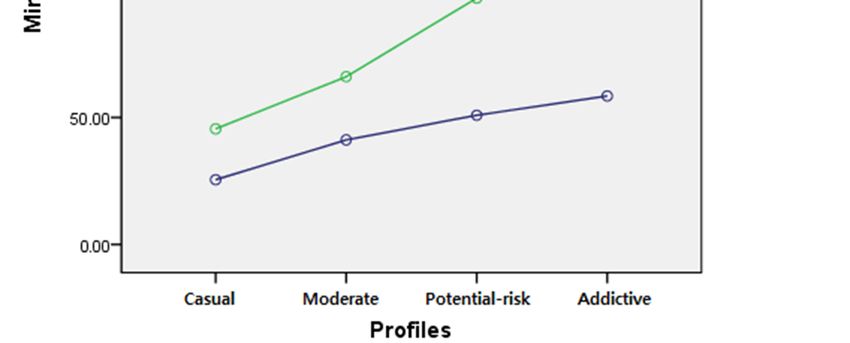
Int. J. Environ. Res. Public Health 2021, 18, 7275 6 of 17
three-profile model, the four-profile model showed better fit in all three fit indexes, and the
LMR-LRT and BLRT also favored the four-profile model. In addition, the membership of
the three-profile model was 63.8%, 31.2%, and 5% in the 2018 cohort and 58.8%, 35.6% and
5.6% in the 2020 cohort, while class two in the three-profile model was divided into class
two and three in the four-profile model, providing more information. The interpretability
of the six-profile models in the 2018 and 2020 cohorts were low due to the complexity.
Thus, considering the model fit, interpretability, and parsimony, the four-profile model was
selected as the optimal model for both the 2018 and 2020 cohorts.
In the 2018 cohort, Profile 1 included 53.7%, Profile 2 included 20.8%, Profile 3 included
21.9%, and Profile 4 included 3.5% of the sample. In the 2020 cohort, Profile 1 included
Int. J. Environ. Res. Public Health 2021, 18, x FOR PEER REVIEW
50%, Profile 2 included 21.5%, Profile 3 included 26.2%, and Profile 4 included 2.3% of the
sample. The distribution of addictive internet gaming behavior of each profile in the 2018
and 2020 cohorts were highly similar; thus, the same profile names were used. Profile 1
Table 3. Addictive
exhibited internet
almost gaming usage
no addictive and standard
behaviors errorfactors
in all seven of eachand
profile
the of the internet
total 2018 andgameplay
2020 cohorts.
time was significantly lower than the average play time of each ‘Potential-Risk’
year’s cohort; thus, this
profile was named the ‘casual’‘Causal’ Gamer
gamer profile.‘Moderate’
Profile 2 wasGamer
named the ‘potential-risk’ ‘Addictive’ G
gamer
Gamer
profile as addictive behaviors were mildly present with scores clustered around six, and the
Year 2018 Cohort
total internet gameplay time was similar to the average playing time of each year’s cohort.
Tolerance 3.38 (0.02)
Profile 3 was named the ‘moderate’ gamer profile 4.87 (0.07)
with overall low 6.34 (0.08)
scores for all seven9.17 (0.32
Withdrawal
factors, and the total internet 3.16 (0.01) time was
gameplay 4.12 (0.07)lower than 5.89
slightly (0.08) play time8.42 (0.30
the average
Excessive
of each year’s cohort. Profile 4 was named the ‘addictive’ gamer profile (0.10)
usage 3.61 (0.03) 6.38 (0.08) 7.17 with five to four9.52 (0.29
Controlfactors
impairment
with scores over nine, which is classified as addiction according to the MGUS. This9.12 (0.34
3.34 (0.02) 5.43 (0.08) 6.54 (0.10)
Compulsive
profileusage 3.44 (0.03)
met the diagnosis criteria of IGD and ICD. 4.93In(0.06) 6.48internet
addition, the total (0.08) gameplay9.20 (0.22
Neglecting daily
time activity
of the ‘addictive’ gamer 3.54 (0.01)was significantly
profile 3.70 (0.04)
higher than the5.32 (0.04)play time of7.14 (0.33
average
Gaming despite each year’s cohort.
negative conse-
The characteristics and 3.33 (0.02)
proportion 4.65 of
of profiles (0.05) 6.42 are
the present study (0.08)
similar to the8.67 (0.25
quence
results
Total of previous studies23.43(0.09)
conducted in the Netherlands
34.15(0.14) and other44.14(0.14)
countries [8,48]. In a61.06(0.34
Dutch study [6], three profiles were chosen, andCohort
Year 2020 the normal gamer profile was similar to the
‘casual’ and ‘moderate’ gamer profiles, the risky gamer profile was similar to the ‘potential-
Tolerance 3.47 (0.03) 5.06 (0.09) 6.44 (0.11) 9.19 (0.46
risk’ gamer profile, and the disordered profile was similar to the ‘addictive’ gamer profile.
Withdrawal 3.21 (0.02) 4.25 (0.11) 6.10 (0.12) 8.81 (0.38
In the study conducted by Pontes et al. [48], other profiles were similar to those in this
Excessive usage 3.86 (0.06) 6.63 (0.09) 7.40 (0.11) 9.73 (0.48
study, while the ‘potential-risk’ profile was divided into the low-risk, high-engagement
Controlgamerimpairment 3.43 (0.04)
and at-risk, high-engagement gamer profiles. 5.77 (0.11) 6.92 (0.13) 9.57 (0.34
CompulsiveAlthough
usage names were3.59 (0.04)
given to distinguish 5.20 (0.10)
the four 6.64 (0.11)
emergent profiles from each other,9.44 (0.35
Neglecting naming does not convey meaning other than indicating differences between addictive7.98 (0.52
daily activity 3.19 (0.02) 3.73 (0.12) 5.26 (0.05)
Gaming despite negative
internet game conse-
usage and internet gameplay time. The addictive internet gaming usage
3.43 (0.03) 5.00 (0.12) 6.64 (0.11) 9.46 (0.32
quence
scores of profiles and standard errors are presented in Table 3 and illustrated in Figures 1
and
Total2. 24.19(0.09) 35.66(0.13) 45.48(0.14) 64.17(0.42
Figure 1. Profiles of addictive internet gaming usage of the 2018 cohort.
Figure 1. Profiles of addictive internet gaming usage of the 2018 cohort.Gaming despite negative conse-
3.33 (0.02) 4.65 (0.05) 6.42 (0.08) 8.67 (0.25
quence
Total 23.43(0.09) 34.15(0.14) 44.14(0.14) 61.06(0.34
Year 2020 Cohort
Tolerance
Int. J. Environ. Res. Public Health 2021, 18, 7275 3.47 (0.03) 5.06 (0.09) 6.44 (0.11) 7 of 179.19 (0.46
Withdrawal 3.21 (0.02) 4.25 (0.11) 6.10 (0.12) 8.81 (0.38
Excessive usage 3.86 (0.06) 6.63 (0.09) 7.40 (0.11) 9.73 (0.48
Control impairment 3.43 (0.04) 5.77 (0.11) 6.92 (0.13) 9.57 (0.34
Table 3. Addictive internet gaming usage and standard error of each profile of the 2018 and 2020 cohorts.
Compulsive usage 3.59 (0.04) 5.20 (0.10) 6.64 (0.11) 9.44 (0.35
Neglecting daily activity 3.19 (0.02) 3.73 ‘Potential-Risk’
(0.12) 5.26 (0.05) 7.98 (0.52
‘Causal’ Gamer ‘Moderate’ Gamer ‘Addictive’ Gamer
Gaming despite negative conse- Gamer
3.43 (0.03) 5.00 (0.12) 6.64 (0.11) 9.46 (0.32
quence Year 2018 Cohort
Tolerance Total 3.38 (0.02) 24.19(0.09)
4.87 (0.07) 35.66(0.13)
6.34 (0.08) 45.48(0.14)
9.17 (0.32) 64.17(0.42
Withdrawal 3.16 (0.01) 4.12 (0.07) 5.89 (0.08) 8.42 (0.30)
Excessive usage 3.61 (0.03) 6.38 (0.08) 7.17 (0.10) 9.52 (0.29)
Control impairment 3.34 (0.02) 5.43 (0.08) 6.54 (0.10) 9.12 (0.34)
Compulsive usage 3.44 (0.03) 4.93 (0.06) 6.48 (0.08) 9.20 (0.22)
Neglecting daily activity 3.54 (0.01) 3.70 (0.04) 5.32 (0.04) 7.14 (0.33)
Gaming despite negative consequence 3.33 (0.02) 4.65 (0.05) 6.42 (0.08) 8.67 (0.25)
Total 23.43(0.09) 34.15(0.14) 44.14(0.14) 61.06(0.34)
Year 2020 Cohort
Tolerance 3.47 (0.03) 5.06 (0.09) 6.44 (0.11) 9.19 (0.46)
Withdrawal 3.21 (0.02) 4.25 (0.11) 6.10 (0.12) 8.81 (0.38)
Excessive usage 3.86 (0.06) 6.63 (0.09) 7.40 (0.11) 9.73 (0.48)
Control impairment 3.43 (0.04) 5.77 (0.11) 6.92 (0.13) 9.57 (0.34)
Compulsive usage 3.59 (0.04) 5.20 (0.10) 6.64 (0.11) 9.44 (0.35)
Neglecting daily activity 3.19 (0.02) 3.73 (0.12) 5.26 (0.05) 7.98 (0.52)
Gaming despite negative consequence 3.43 (0.03) 5.00 (0.12) 6.64 (0.11) 9.46 (0.32)
Total 24.19(0.09) 35.66(0.13) 45.48(0.14) 64.17(0.42)
Figure 1. Profiles of addictive internet gaming usage of the 2018 cohort.
Figure 2. Profiles of addictive internet gaming usage of the 2020 cohort.
3.3. Gender as a Predictor of Profile Membership
The association between gender and profile membership of the 2018 and 2020 cohorts
was examined using a multinomial analysis. The results of the 2018 cohort showed that
male respondents were more likely to be classified as ‘moderate’ gamers (OR = 2.00, p =
0.000), ‘potential-risk’ gamers (OR = 3.19, p = 0.000), or ‘addictive’ gamers (OR = 3.01, p =
0.015). The results of the 2020 cohort also showed that male respondents were more likely
to be classified as ‘moderate’ gamers (OR = 1.74, p = 0.000), ‘potential-risk’ gamers (OR =
2.51, p = 0.000), or ‘addictive’ gamers (OR = 6.19, p = 0.002). Overall, male respondents had
a higher chance of being classified into a profile with a higher addictive internet gaming
usage score, and male respondents of the 2020 cohort were at greater risk of being classified
as ‘addictive’ gamers.
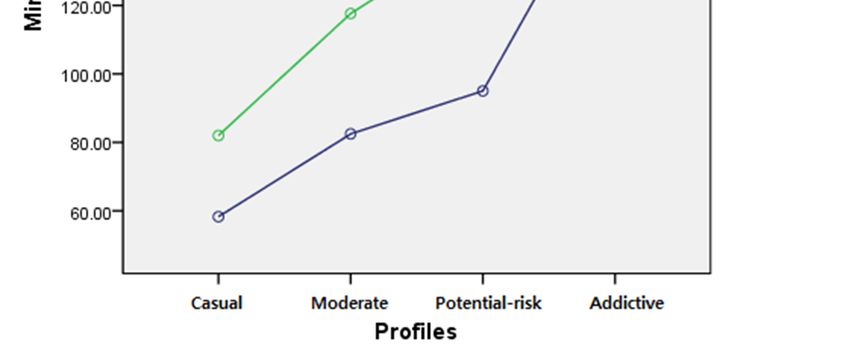
3.4. Addictive Internet Gaming Usage, PC Internet Gaming Time and Mobile Gaming Time
After the optimal number of profiles were selected for the 2018 and 2020 cohorts,
differences in total addictive internet gaming behavior, time spent playing internet games
the on a PC, mobile gaming, and total time spent playing games on the internet, by year and
profile membership were examined. First, differences in total addictive internet gamingInt. J. Environ. Res. Public Health 2021, 18, 7275 8 of 17
behavior by profile membership before and after the COVID-19 pandemic were examined
by a two-way ANCOVA after controlling for gender and school level. The results showed
a significant interaction (F = 9.518, p < 0.001) between year and profile membership and
significant main effect of year (F = 119.747, p < 0.001) and profile membership (F = 15316, p <
0.001). The interaction effect showed that the difference in gameplay time between the 2018
and 2020 cohorts was greater for profiles with higher addictive behavior scores. The main
effect indicated that the total scores in 2020 were significantly greater than the total scores
in 2018. To examine the differences among the four profiles, a post hoc test was performed.
Results indicated significant differences among the profiles, with the ‘addictive’ gamer
spending the highest time playing internet games, followed by ‘potential-risk’ gamer,
‘moderate’ gamer and ‘casual’ gamer (p < 0.05). Results from the post hoc test implied that
the total score of addictive internet game usage significantly differs among the profiles.
However, the mean difference of profiles between the 2018 and 2020 cohorts ranged from
0.76 to 3.11, which is the same as the 0.04 to 0.15 score difference on a four-point Likert
scale. The results are presented in Table 4. The mean and standard error of internet gaming
time by year and profiles are presented in Table 5 and the interaction effect is presented in
Figure 3.
Table 4. Two-way ANCOVA: total score of addictive internet gaming usage by year and profile
membership.
SS df MS F η2
Membership 552434.107 3 184144.702 15316.560 *** 0.886
year 1439.667 1 1439.667 119.747 *** 0.020
Membership × year 330.300 3 110.100 9.158 *** 0.005
*** p < 0.001.
Table 5. Mean and standard error of total score of addictive internet gaming usage by profile membership and year.
Int. J. Environ. Res. Public Health 2021, 18, x FOR PEER REVIEW 9 of 17
‘Casual’ ‘Moderate’ ‘Potential-Risk’ ‘Addictive’ Mean
2018 cohort 23.43(0.09) 34.15(0.14) 44.14(0.14) 61.06(0.34) 40.69(0.10)
2020 cohort 24.19(0.09) 35.66(0.13) 45.48(0.14) 64.17(0.42) 42.78(0.12)
Mean difference 0.76
Mean difference 1.51 0.76 1.34
1.51 1.34 3.11 3.11 2.09
2.09
Figure3.
Figure Interactionof
3.Interaction ofprofile
profilemembership
membership and
and year
year on
ontotal
totalscore
score of
ofaddictive
addictive internet
internet game
game usage.
usage.
The difference in the time spent playing internet games on a PC by profile member-
ship before and after the COVID-19 pandemic was examined by two-way ANCOVA after
controlling for gender and school level. The results showed a significant interaction (F =
22.893, p < 0.001) between year and profile membership and a significant main effect ofInt. J. Environ. Res. Public Health 2021, 18, 7275 9 of 17
The difference in the time spent playing internet games on a PC by profile membership
before and after the COVID-19 pandemic was examined by two-way ANCOVA after
controlling for gender and school level. The results showed a significant interaction (F =
22.893, p < 0.001) between year and profile membership and a significant main effect of
year (F = 198.21, p < 0.001) on the profile membership (F = 99.484, p < 0.001). The interaction
effect showed that the difference in gameplay time between the 2018 and 2020 cohorts
was greater for profiles with higher addictive internet game usage scores. To examine
the differences among the four profiles, a post hoc test was performed; results indicated
significant differences among profiles with the ‘addictive’ gamers who spent most time
playing games, followed by the ‘potential-risk’ gamers, ‘moderate’ gamers, and ‘casual’
gamers (p < 0.05). The result of the post hoc test implies that those belonging to profiles
with a higher addictive internet gaming usage spend more time playing internet games on
a PC, regardless of the year. The results are presented in Table 6. The mean and standard
error of the internet gaming time by year and profiles are presented in Table 7 and the
interaction effect is presented in Figure 4.
Table 6. Two-way ANCOVA: time spent playing internet games on a PC by year and profile
membership.
SS df MS F η2
Int. J. Environ. Res. Public Health 2021, 18, x FOR PEER REVIEW 10 of 17
Membership 1769595.249 3 589865.083 99.484 *** 0.053
year 1175243.349 1 1175243.349 198.210 *** 0.036
Membership × year 407217.691 3 135739.230 22.893 *** 0.013
*** pInt. J. Environ. Res. Public Health 2021, 18, 7275 10 of 17
gender and school level. The results showed a significant interaction between year and
profile membership (F = 3.245, p < 0.05) and a significant main effect of year (F = 34.527, p <
0.001) on profile membership (F = 79.557, p < 0.001). The interaction effect demonstrated
that the difference of gameplay time between the 2018 and 2020 cohorts was greater for
profiles with higher addictive internet game usage, except for ‘addictive’ gamers. To
examine the differences among the four profiles, a post-hoc test was performed. Results
indicated significant differences among the profiles, with ‘addictive’ gamers spending the
most time playing games, followed by the ‘potential-risk’ gamers, ‘moderate’ gamers and
‘casual’ gamers (p < 0.05). The post hoc test results implied that the individuals profiled
with higher addictive internet gaming usage spent more time on mobile gaming, regardless
of the year. The results are presented in Table 8. The mean and standard error of the
internet gaming time by year and profiles are presented in Table 9 and the interaction effect
is presented in Figure 5.
Table 8. Two-way ANCOVA: time spent playing internet games on a PC by year and profile membership.
SS df MS F η2
Membership 3140362.077 3 1046787.359 79.557 *** 0.041
Int. J. Environ. Res. Public Health 2021, 18, x FOR PEER REVIEW 11 of 17
year 454302.916 1 454302.916 34.527 *** 0.006
Membership × year 128106.403 3 42702.134 3.245 * 0.002
*** p < 0.001, * p < 0.05.
Table 9. Mean and standard error of time spent on a PC internet gaming by membership and year.
Table 9. Mean and standard error of time spent on a PC internet gaming by membership and year.
‘Potential-
‘Casual’
‘Casual’
‘Moderate’
‘Moderate’
‘Potential-Risk’
‘Addictive’ Mean
Risk’‘Addictive’ Mean
2018 cohort 58.272018 cohort 82.4858.27 82.48
95.03 95.03 163.50 163.50 99.82
99.82
2020 cohort 81.992020 cohort 117.6281.99 142.28
117.62 142.28 181.43 181.43 130.83
130.83
Mean difference 23.72 35.14 47.25 17.93 31.01
Mean difference 23.72 35.14 47.25 17.93 31.01
Figure
Figure5.5.Interaction
Interactionofofprofile
profilemembership
membershipand
andyear
yearon
onmobile
mobilegaming
gamingtime.
time.
Thedifference
The differenceinintotal
totaltime
timespent
spenton
oninternet
internetgaming
gamingby byprofile
profile membership
membershipbefore
before
and after the COVID-19 pandemic was examined by two-way ANCOVA
and after the COVID-19 pandemic was examined by two-way ANCOVA after controlling after controlling
forgender
for genderand andschool
schoollevel.
level.The
Theresults
resultsshowed
showeda asignificant
significant interaction
interaction (F(F pInt. J. Environ. Res. Public Health 2021, 18, 7275 11 of 17
effect showed that the difference in gameplay time between the 2018 and 2020 cohorts was
greater for profiles with higher addictive internet game usage. To examine the difference
among the four profiles, a post hoc test was performed. Results indicated significant
differences among the profiles, with ‘addictive’ gamers spending the most time playing
games, followed by ‘potential-risk’ gamers, ‘moderate’ gamers and ‘casual’ gamers (p <
0.05). The post hoc test results imply that individuals belonging to profiles with a higher
addictive internet gaming usage spent more time on internet gaming, regardless of the
year. The results are presented in Table 10. The mean and standard error of time spent on
internet gaming by year and profiles are presented in Table 11, and the interaction effect is
presented in Figure 6.
Table 10. Two-way ANCOVA: total time spent on the internet gaming by year and profile membership.
SS df MS F η2
Membership
Int. J. Environ. Res. Public Health 2021, 18, x FOR PEER REVIEW 9445189.083 3 3148396.361 166.812 *** 0.079
12 of 17
year 3261123.442 1 3261123.442 172.785 *** 0.029
Membership × year 831571.427 3 277190.476 44.059 *** 0.008
*** p < 0.001.
Table 11. Mean and standard error of total time spent on internet gaming by membership and year.
Table 11. Mean and standard error of total time spent on internet gaming by membership and year.
‘Potential-
‘Casual’ ‘Moderate’ ‘Addictive’ Mean
‘Casual’ ‘Moderate’ ‘Potential-Risk’ Risk’
‘Addictive’ Mean
2018 cohort
2018 cohort
78.67(3.42)
78.67(3.42)
116.52(5.39)
116.52(5.39)
136.55(5.53)
136.55(5.53) 204.94(13.39) 134.17(3.96)
204.94(13.39)
134.17(3.96)
2020 cohort 2020 cohort 174.34(5.03)
118.83(3.68) 118.83(3.68) 174.34(5.03)
228.30(5.63) 228.30(5.63) 340.96(17.18) 215.61(4.78)
340.96(17.18) 215.61(4.78)
Mean difference Mean difference 57.8240.16
40.16 57.82
91.75 91.75 136.02 136.02 81.44
81.44
Figure
Figure6.
6.Interaction
Interactionof
ofprofile
profilemembership
membership and
and year
year on
on total
total time
time spent
spent on
on gaming.
gaming.
4. Discussion
4. Discussion
There is
There is increased
increased concern
concernabout
aboutdeveloping behavioral
developing addictions
behavioral duedue
addictions to the
to impacts
the im-
of the COVID-19 pandemic, and adolescents may be more vulnerable to IGD [12,15].
pacts of the COVID-19 pandemic, and adolescents may be more vulnerable to IGD [12,15]. This
is especially true for adolescents in South Korea, which has one of the highest internet
This is especially true for adolescents in South Korea, which has one of the highest internet
access rates and smartphone penetration rates across the world [39]. However, despite the
access rates and smartphone penetration rates across the world [39]. However, despite the
impact of the pandemic on the playing of internet games and studies exploring internet
impact of the pandemic on the playing of internet games and studies exploring internet
game addiction [17,18,56], to the best of our knowledge, no study has been conducted
game addiction [17,18,56], to the best of our knowledge, no study has been conducted on
on this topic in South Korea. Thus, the aim of this study was to estimate the profile of
this topic in South Korea. Thus, the aim of this study was to estimate the profile of addic-
tive internet gaming usage among South Korean adolescents in the 2018 and 2020 cohorts
and explore how the severity of usage and gameplay time differed before and after the
COVID-19 pandemic.
The results of LPA produced four profiles: ‘casual’ gamer, ‘moderate’ gamer, ‘poten-Int. J. Environ. Res. Public Health 2021, 18, 7275 12 of 17
addictive internet gaming usage among South Korean adolescents in the 2018 and 2020
cohorts and explore how the severity of usage and gameplay time differed before and after
the COVID-19 pandemic.
The results of LPA produced four profiles: ‘casual’ gamer, ‘moderate’ gamer, ‘potential-
risk’ gamer, and ‘addictive’ gamer. The proportion of profiles indicates that more than 76%
of the adolescents are playing internet games in a safe manner and approximately 21%
show more involved gameplay, while only 3.5% of the 2018 cohort and 2.3% of the 2020
cohort exhibited a possible risk of IGD.
Despite the small proportion of the ‘addictive’ gamer profile, it can be highly prob-
lematic. As presented in Figures 4 and 6, gameplay time increased significantly after the
COVID-19 pandemic with an overall increase of 136.02 min, increasing the average play
time approximately 6 h per day on weekdays. Since March 2020, schools were closed,
and online teaching has been implemented since. All adolescents had to use a PC to
take online classes and this might have increased the opportunity for adolescents to play
internet games instead of focusing on classwork. As Triberti et al. [45] suggests, morning
time, which is typically reserved for school for adolescents, may become gameplay time
for highly addicted gamers. It may also explain the high increase of gameplay time in
high-addiction profiles as they cannot resist the urge to play games during online school-
ing, while most nonaddictive adolescents will perform regular activities such as online
schooling [45].
Moreover, the ‘addictive’ gamer profile showed the longest play time on both a PC
(173 min) and mobile phones (183 min). Gamers with consistently high gaming time using
both a PC and smartphone are reported to exhibit a higher prevalence of IGD in South
Korea [52]. Also, they may be at a greater risk of developing depression, an anxiety disorder,
or a substance disorder [55], which was reported to be more prevalent during the COVID-
19 pandemic [1,18]. Applying the I-PACE model [35], the ‘addictive’ gamer profile may be
in a ‘later stage’ of behavior addiction with the presence of strong addiction symptoms of
habituation and extremely long gameplay time under stress-inducing environments during
the COVID-19 pandemic, which may possibly require clinical intervention. Moreover,
if gaming behavior becomes habitual, it may be more difficult for adolescents with the
‘addictive’ gamer profile to adapt to the environment when the pandemic is over. However,
it will be crucial for policy makers, especially in education, to place emphasis on the
approximately 97% of the nonaddictive adolescent gamers. As the results of the present
study suggest, most adolescents play games on the internet regardless of gender, and the
proportion of adolescent internet gamers is increasing rapidly. This implies that educational
measures rather than preventative measures for adolescent gamers will be more beneficial.
However, a study about teachers’ perception and acceptance of students’ gaming activities
indicated that about 61.6 % of teachers had negative perceptions regarding gameplay [57].
This implies that educational measures regarding game usage need to be implemented for
both students and teachers in South Korea.
The proportion of the IGD group in this study is similar to the global prevalence of
1.96% [8] and relatively smaller than the prevalence reported in a German study (5.6%) [58],
but much lower than the 17% [42] IGD prevalence reported in China. The proportion of the
IGD risk group was similar to that of other studies using the LPA score of IGD measuring
scales. The proportion of the IGD group in one global study, with participants from 57
countries, was 5.3% and a study conducted in the Netherlands demonstrated a prevalence
rate of 4.9% [8,48]. Despite high internet accessibility, high smartphone penetration rates,
and raised concerns of IGD [30] in South Korea, the proportion of the IGD risk group
in this study was close to the global prevalence [10] and lower than that of China. The
gender difference in prevalence of IGD was similar to that of previous studies [9,10], which
found male adolescents to be more likely to belong to a profile with higher addictive
behavior. However, caution should be exercised when comparing the proportion of this
study directly to other studies due to a large variability among studies [9,10].Int. J. Environ. Res. Public Health 2021, 18, 7275 13 of 17
Comparing the proportion of the profiles from the 2018 and 2020 cohorts, the portion
of the ‘casual’ gamer is lower in the 2020 cohort by 3%, while the proportion of the
‘moderate’ gamer is greater in the 2020 cohort by 0.7% and the ‘potential-risk’ gamer is
greater in the 2020 cohort by 4.3%. The proportion of the ‘addictive’ gamer is smaller in
the 2020 cohort by 1.2%. These differences may indicate that the proportion of groups
with a higher risk of IGD decreased, while the proportion of other profiles increased in the
2020 cohort. However, these differences in proportions are not obtained from statistical
inference. Additionally, the present study compared the two different cohorts from two
different time periods but did not compare the same individuals. Thus, such a relatively
small difference in proportions might not have been caused by the impact of the COVID-19
pandemic and should be interpreted with caution.
The total score of addictive internet gaming usage between the 2018 and 2020 cohorts
showed a statistically significant difference, but the mean difference among the profiles
were 0.76 in ‘casual’, 1.51 in ‘moderate’, 1.34 in ‘potential-risk’, and 3.11 in ‘addictive’
profiles. On a four-point Likert scale, such differences indicate differences of 0.04, 0.07,
0.06 and 0.15 points, respectively. The results indicate that the majority of adolescents,
except for the ‘addictive’ gamers, did not exhibit significant aggravation of addictive
internet gaming usage during the COVID-19 pandemic. Approximately 2.3% of those
fitting into the ‘addictive’ gamer profile may need immediate intervention of mental
health professionals, but access to therapy or counseling services has been limited due to
governmental regulations such as quarantine and social distancing [59,60]. Although there
are governmental counseling services in which counselors visit adolescent clients [61], there
are still insufficient counselors available, and most importantly, the danger of COVID-19
infection still exists. In such cases, telephone or online counseling can be used and parents
of adolescents can utilize behavior intervention by following recommendations in lifestyle
and internet usage [22]. For parents, monitoring strategies may be effective in preventing
IGD during COVID-19 [62].
PC internet game time and mobile phone game time showed different trends in the
2018 and 2020 cohorts. The differences showed an increasing trend in accordance with the
order of severity of each profile’s addictive behavior in time spent on a PC internet game.
Mobile phone game time was different between the 2018 and 2020 cohorts and the degree
of change differed according to the profiles. Gameplay time on mobile phones was higher
in the 2020 cohort compared with the 2018 cohort in all profiles; the differences were higher
in the order of ’potential-risk’, ‘moderate’, and ‘casual’ profiles, and the lowest difference
was found in the ‘addictive’ profile. Although the cause of such a trend difference is not
explored in this study, one possible explanation is that games played on a PC versus mobile
phones may fulfill different demands [52].
The increasing trend of gameplay time on mobile phones is evident, and the reason
for the increased play time may be partly due to the impact of the COVID-19 pandemic.
The mobile gaming industry has been growing drastically since its introduction with
smartphones and earned a total revenue of $86.3 billion in 2020 [63]. As the gaming
industry continues to prosper during the COVID-19 pandemic, it can be expected that,
unlike internet gaming on a PC, the mobile phone gaming industry will continue to grow,
attracting more adolescent players. Because of the easy accessibility of mobile phone
games, play time may not decrease after the pandemic is over. Despite its popularity,
mobile phone gaming has not received much attention in research compared with other
forms of gaming, such as PC and game consoles in South Korea [64–67]. Considering it
is a rapidly growing industry with a high ratio of mobile phone gamers among Korean
adolescents, more extensive research is needed.
Although the results of the present study indicate that profiles with higher addictive
internet gaming usage exhibit longer gameplay time, caution should be exercised when
interpreting higher gameplay time as problematic. There are cases where high involvement
in gaming is not the same as problematic gaming [43–46,66]. Further, the IGD scale devel-
opment study revealed that two distinct profiles—one with low risk and high engagementInt. J. Environ. Res. Public Health 2021, 18, 7275 14 of 17
and one with high risk and high engagement—exist among adolescent gamers [48]. Most
significantly, playing games online should not be stigmatized as gaming is not pathologic
and it does have positive effects [23–26]. In addition, games can be utilized in educational
purposes such as a ‘serious game’ [68].
Finally, there are limitations of the present study. First, a longitudinal comparison
was not possible as the cohorts of 2018 and 2020 were different. As a direct comparison
was not possible, the results should be interpreted as the difference between two different
cohorts during two different time periods. Thus, the results comparing the 2018 and 2020
cohorts of the present study should not be interpreted as an increase or decrease, but
should be interpreted as the difference between two different time points. If the survey
was conducted longitudinally, a more meaningful conclusion might have been drawn.
Second, the scale used in this study was not a scale that explicitly measures IGD symptoms
but measures GD symptoms in general, which influences and limits the interpretation of
the present study. Third, this study did not include internet gaming through consoles.
However, considering the gaming population in South Korea, console games might not
have had significant influence on adolescent gamers in South Korea. According to a report
by the Korea Creative Content Agency in 2020, 10.4% of adolescents, which is the lowest
ratio compared to other age groups, except those in their 50s or older, confirmed that they
play console games [37]. The proportion may be smaller in the case of playing internet
games using a console, which is rare in South Korea.
Author Contributions: Conceptualization, methodology, D.K. and J.L.; software, J.L.; validation, D.K.
and J.L.; formal analysis, D.K. and J.L.; writing—original draft preparation, D.K. and J.L.; writing—
review and editing, D.K. and J.L.; visualization, J.L.; supervision, D.K.; project administration, D.K.
Both authors have read and agreed to the published version of the manuscript.
Funding: This research received no external funding.
Institutional Review Board Statement: Ethical review and approval were waived for this study, as
this national survey was approved and conducted by the National Youth Policy Institute of South
Korea.
Informed Consent Statement: Not applicable.
Data Availability Statement: Not applicable.
Acknowledgments: This work was supported by the Ministry of Education of the Republic of Korea
and the National Research Foundation of Korea (NRF-2020S1A3A2A02103411).
Conflicts of Interest: The authors declare no conflict of interest.
References
1. Choi, E.P.H.; Hui, B.P.H.; Wan, E.Y.F. Depression and anxiety in Hong Kong during COVID-19. Int. J. Environ. Res. Public Health
2020, 17, 3740. [CrossRef]
2. Horesh, D.; Brown, A.D. Traumatic stress in the age of COVID-19: A call to close critical gaps and adapt to new realities. Psychol.
Trauma Theory Res. Pract. Policy 2020, 12, 331. [CrossRef] [PubMed]
3. Sher, L. The impact of the COVID-19 pandemic on suicide rates. QJM Int. J. Med. 2020, 113, 707–712. [CrossRef]
4. Tanaka, T.; Okamoto, S. Increase in suicide following an initial decline during the COVID-19 pandemic in Japan. Nat. Hum. Behav.
2021, 5, 229–238. [CrossRef]
5. Tang, S.; Xiang, M.; Cheung, T.; Xiang, Y.-T. Mental health and its correlates among children and adolescents during COVID-19
school closure: The importance of parent-child discussion. J. Affect. Disord. 2021, 279, 353–360. [CrossRef] [PubMed]
6. Francisco, R.; Pedro, M.; Delvecchio, E.; Espada, J.P.; Morales, A.; Mazzeschi, C.; Orgilés, M. Psychological symptoms and
behavioral changes in children and adolescents during the early phase of COVID-19 quarantine in three European countries.
Front. Psychiatry 2020, 11, 1329. [CrossRef]
7. Wartberg, L.; Kriston, L.; Zieglmeier, M.; Lincoln, T.; Kammerl, R. A longitudinal study on psychosocial causes and consequences
of Internet gaming disorder in adolescence. Psychol. Med. 2019, 49, 287–294. [CrossRef]
8. Lemmens, J.S.; Valkenburg, P.M.; Gentile, D.A. The Internet gaming disorder scale. Psychol. Assess. 2015, 27, 567. [CrossRef]
9. Mihara, S.; Higuchi, S. Cross-sectional and longitudinal epidemiological studies of Internet gaming disorder: A systematic review
of the literature. Psychiatry Clin. Neurosci. 2017, 71, 425–444. [CrossRef] [PubMed]Int. J. Environ. Res. Public Health 2021, 18, 7275 15 of 17
10. Stevens, M.W.; Dorstyn, D.; Delfabbro, P.H.; King, D.L. Global prevalence of gaming disorder: A systematic review and
meta-analysis. Aust. N. Zeal. J. Psychiatry 2021, 55, 553–568. [CrossRef]
11. Yu, Y.; Mo, P.K.; Zhang, J.; Li, J.; Lau, J.T. Why is Internet gaming disorder more prevalent among Chinese male than female
adolescents? The role of cognitive mediators. Addict. Behav. 2021, 112, 106637. [CrossRef] [PubMed]
12. King, D.L.; Delfabbro, P.H.; Billieux, J.; Potenza, M.N. Problematic online gaming and the COVID-19 pandemic. J. Behav. Addict.
2020, 9, 184–186. [CrossRef]
13. Kar, S.K.; Arafat, S.Y.; Sharma, P.; Dixit, A.; Marthoenis, M.; Kabir, R. COVID-19 pandemic and addiction: Current problems and
future concerns. Asian J. Psychiatry 2020, 51, 102064. [CrossRef] [PubMed]
14. WHO. International Classification of Diseases for Mortality and Morbidity Statistics (11th Revision); WHO: Geneva, Switzerland, 2018.
15. Petry, N.M.; Rehbein, F.; Ko, C.-H.; O’Brien, C.P. Internet gaming disorder in the DSM-5. Curr. Psychiatry Rep. 2015, 17, 1–9.
[CrossRef]
16. Jo, Y.S.; Bhang, S.Y.; Choi, J.S.; Lee, H.K.; Lee, S.Y.; Kweon, Y.-S. Clinical characteristics of diagnosis for internet gaming disorder:
Comparison of DSM-5 IGD and ICD-11 GD diagnosis. J. Clin. Med. 2019, 8, 945. [CrossRef]
17. Fazeli, S.; Zeidi, I.M.; Lin, C.-Y.; Namdar, P.; Griffiths, M.D.; Ahorsu, D.K.; Pakpour, A.H. Depression, anxiety, and stress mediate
the associations between internet gaming disorder, insomnia, and quality of life during the COVID-19 outbreak. Addict. Behav.
Rep. 2020, 12, 100307. [CrossRef] [PubMed]
18. Teng, Z.; Pontes, H.M.; Nie, Q.; Griffiths, M.D.; Guo, C. Depression and anxiety symptoms associated with internet gaming
disorder before and during the COVID-19 pandemic: A longitudinal study. J. Behav. Addict. 2021, 10, 169–180. [CrossRef]
19. De Pasquale, C.; Chiappedi, M.; Sciacca, F.; Martinelli, V.; Hichy, Z. Online videogames use and anxiety in children during the
COVID-19 pandemic. Children 2021, 8, 205. [CrossRef]
20. Oka, T.; Hamamura, T.; Miyake, Y.; Kobayashi, N.; Honjo, M.; Kawato, M.; Kubo, T.; Chiba, T. Prevalence and risk factors of
internet gaming disorder and problematic internet use before and during the COVID-19 pandemic: A large online survey of
Japanese adults. MedRxiv 2021. [CrossRef]
21. Zhu, S.; Zhuang, Y.; Lee, P.; Li, J.; Wong, P.W.-C. Leisure and problem gaming behaviour among children and adolescents during
school closures caused by COVID-19 in Hong Kong: A school-based quantitative survey. JMIR Serious Games 2021, 9, e26808.
[CrossRef]
22. Király, O.; Potenza, M.N.; Stein, D.J.; King, D.L.; Hodgins, D.C.; Saunders, J.B.; Griffiths, M.D.; Gjoneska, B.; Billieux, J.; Brand, M.
Preventing problematic internet use during the COVID-19 pandemic: Consensus guidance. Compr. Psychiatry 2020, 100, 152180.
[CrossRef] [PubMed]
23. Sublette, V.A.; Mullan, B. Consequences of play: A systematic review of the effects of online gaming. Int. J. Ment. Health Addict.
2012, 10, 3–23. [CrossRef]
24. Granic, I.; Lobel, A.; Engels, R. The Benefits of Playing Video Games. Am. Psychol. Assoc. 2013, 69, 66–78. [CrossRef] [PubMed]
25. Billieux, J.; Flayelle, M.; Rumpf, H.-J.; Stein, D.J. High involvement versus pathological involvement in video games: A crucial
distinction for ensuring the validity and utility of gaming disorder. Curr. Addict. Rep. 2019, 6, 323–330. [CrossRef]
26. Carras, M.C.; Van Rooij, A.J.; Van de Mheen, D.; Musci, R.; Xue, Q.-L.; Mendelson, T. Video gaming in a hyperconnected world: A
cross-sectional study of heavy gaming, problematic gaming symptoms, and online socializing in adolescents. Comput. Hum.
Behav. 2017, 68, 472–479. [CrossRef]
27. Giardina, A.; Di Blasi, M.; Schimmenti, A.; King, D.L.; Starcevic, V.; Billieux, J. Online Gaming and Prolonged Self-Isolation:
Evidence from Italian Gamers during the COVID-19 Outbreak. Clin. Neuropsychiatry 2021, 18, 65–74.
28. Prochnow, T.; Hartnell, L.; Patterson, M.S. Depressive symptoms, developing friendships, and social support through online
gaming: A mixed-method analysis of online gaming network communication. Ment. Health Soc. Incl. 2021. [CrossRef]
29. Zhu, L. The psychology behind video games during COVID-19 pandemic: A case study of Animal Crossing: New Horizons.
Hum. Behav. Emerg. Technol. 2021, 3, 157–159. [CrossRef]
30. Lee, S.-Y.; Choo, H.; Lee, H.K. Balancing between prejudice and fact for Gaming Disorder: Does the existence of alcohol use
disorder stigmatize healthy drinkers or impede scientific research? Commentary on “Scholars’ open debate paper on the World
Health Organization ICD-11 Gaming Disorder proposal”. J. Behav. Addict. 2017, 6, 302–305.
31. The Impact of Lockdown on Mobile Gamers Behaviors. Available online: https://medium.com/googleplaydev/the-impact-of-
lockdown-on-mobile-gamers-behaviors-dffb05f07c4e (accessed on 12 February 2021).
32. eSports and Gaming Industry Thriving as Video Games Provide Escape from Reality during Coronavirus Pandemic. Available
online: https://www.wfaa.com/article/sports/esports-gaming-industry-thriving-as-video-games-provide-escape-from-reality-
during-coronavirus-pandemic/287-5953d982-d240-4e2b-a2ba-94dd60a8a383 (accessed on 12 February 2021).
33. Richard, J.; Temcheff, C.E.; Derevensky, J.L. Gaming Disorder Across the Lifespan: A Scoping Review of Longitudinal Studies.
Curr. Addict. Rep. 2020, 7, 561–587. [CrossRef]
34. Chen, C.-Y.; Chen, I.-H.; Pakpour, A.H.; Lin, C.-Y.; Griffiths, M.D. Internet-related behaviors and psychological distress among
schoolchildren during the COVID-19 school hiatus. Cyberpsychol. Behav. Soc. Netw. 2020, 59, 1099–1102.e1.You can also read