Adelaide Student Accommodation Demand and Supply Analysis
←
→
Page content transcription
If your browser does not render page correctly, please read the page content below
Adelaide Student Accommodation
Demand and Supply Analysis
Prepared for: The Government of South Australia - Department for Trade, Tourism and Investment
July 2019
The Government of South Australia - Department for Trade, Tourism and Investment: Adelaide Student Accommodation Demand and Supply Analysis

Table of Contents
Executive Summary ................................................................................................................................................................... 6
     Introduction ........................................................................................................................................................................ 10
     Adelaide Overview.............................................................................................................................................................. 11
     2.1      Overview ...................................................................................................................................................................................... 11
     2.2      Demographics ............................................................................................................................................................................ 12
     2.3      Adelaide Student Demographics Summary ........................................................................................................................ 13
     South Australian Universities Overview .......................................................................................................................... 15
     3.1      The University of Adelaide ....................................................................................................................................................... 15
     3.2      Flinders University ..................................................................................................................................................................... 18
     3.3      University of South Australia ................................................................................................................................................... 22
     3.4      Torrens University Australia Adelaide Campus................................................................................................................ 28
     3.5      Full-time Student Enrolment Trends 2007 2017.............................................................................................................. 28
     3.6      Beyond Universities - Other Student Markets Accessing PBSA ....................................................................................... 30
     3.7      International Students by Source Market ............................................................................................................................ 33
     Supply Considerations Inner Adelaide ......................................................................................................................... 35
     4.1      Types of Accommodation Where do students live? ....................................................................................................... 35
     4.2      Existing Student Accommodation compared with Higher Education Enrolments .................................................... 37
     4.3      Pricing ........................................................................................................................................................................................... 38
     Supply Considerations Bedford Park ........................................................................................................................... 41
     5.1      Existing Student Accommodation ......................................................................................................................................... 41
     5.2      Pricing ........................................................................................................................................................................................... 41
     Supply Considerations Mawson Lakes ......................................................................................................................... 42
     6.1      Existing Student Accommodation ......................................................................................................................................... 42
     6.2      Pricing ........................................................................................................................................................................................... 43
     Rental Market Overview ..................................................................................................................................................... 44
     7.1      Adelaide CBD and North Adelaide ......................................................................................................................................... 44
     7.2      Bedford Park and Surrounding Suburbs Rental Market ................................................................................................... 46
     7.3      Mawson Lakes and Surrounding Suburbs Rental Market................................................................................................. 49
     Location of Higher Education Students .......................................................................................................................... 52
     Occupancy Rates in PBSA ................................................................................................................................................. 53
     Development Pipeline ....................................................................................................................................................... 55
     Major Private Operators of PBSA ...................................................................................................................................... 56
     11.1 Owner Operator Model ............................................................................................................................................................. 56

                                                                                                                                                                                                         Page 1
The Government of South Australia - Department for Trade, Tourism and Investment: Adelaide Student Accommodation Demand and Supply Analysis

    11.2 Third Party Operator Model ..................................................................................................................................................... 56
    University Benchmark Profiles ......................................................................................................................................... 58
    12.1 Existing Supply of Accommodation ...................................................................................................................................... 58
    PBSA Demand ..................................................................................................................................................................... 59
    13.1 Demand Forecasts ..................................................................................................................................................................... 59
    13.2 Inner Adelaide Forecasts .......................................................................................................................................................... 60
    13.3 Bedford Park (Flinders University) Forecasts ...................................................................................................................... 63
    13.4 Mawson Lakes Forecasts.......................................................................................................................................................... 66
    13.5 Summary of Demand Forecasting ......................................................................................................................................... 69
    Key Constraints for the Development of Additional PBSA in Adelaide ....................................................................... 73
    14.1 Supply / Demand Balance ....................................................................................................................................................... 73
    14.2 Physical constraints .................................................................................................................................................................. 73
    14.3 Feasibility ..................................................................................................................................................................................... 73
    Legislation and Accreditation Overview ......................................................................................................................... 75
    15.1 Rate rebates ................................................................................................................................................................................ 75
    15.2 Student Accommodation Accreditation .............................................................................................................................. 76

                                                                                                                                                                                                   Page 2
The Government of South Australia - Department for Trade, Tourism and Investment: Adelaide Student Accommodation Demand and Supply Analysis

List of Tables
Table 1: Selected Characteristics of Residents, City of Adelaide LGA and Greater Adelaide, 2016........................................... 12
Table 2: Selected Medians, City of Adelaide LGA and Greater Adelaide, 2016 .............................................................................. 13
Table 3: Summary of International Student Enrolments in SA, 2012-2019* .................................................................................. 13
Table 4: Full Time, On-site Student Enrolments in SA, 2017 ............................................................................................................. 14
Table 5: The University of Adelaide, Number of Student Enrolments, 2017 .................................................................................. 16
Table 6: The University of Adelaide, 2018 Enrolments by Campus .................................................................................................. 17
Table 7: Flinders University, Number of Student Enrolments, 2017 ................................................................................................ 18
Table 8: Flinders University, 2018 Enrolments by Campus ................................................................................................................ 21
Table 9: University of South Australia, Number of Student Enrolments, 2017 .............................................................................. 22
Table 10: University of South Australia, 2018 Enrolments by Campus............................................................................................ 26
Table 11: International Students Enrolments in the VET and ELICOS Sectors in South Australia, 2009-2019* ..................... 31
Table 12: International Higher Education Enrolments in SA by Source Market, 2018 ................................................................. 33
Table 13: International Student Enrolments in SA by Source Market and Sector, 2018 ............................................................. 34
Table 14: Inner Adelaide Supply Analysis, 2019 .................................................................................................................................... 37
Table 15: Summary of Pricing for Residential Colleges in North Adelaide, 2019 .......................................................................... 38
Table 16: PBSA Pricing in Inner Adelaide, 2019 .................................................................................................................................... 38
Table 17: Bedford Park Supply Analysis ................................................................................................................................................. 41
Table 18: PBSA Rents at Flinders University Bedford Park Campus, 2019 ..................................................................................... 41
Table 19: UniSA Mawson Lakes Campus Supply Analysis .................................................................................................................. 42
Table 20: Summary of existing PBSA Rents in proximity to UniSA Mawson Lakes, 2019 ............................................................ 43
Table 21: Adelaide CBD and North Adelaide Market Attributes, 2016 ............................................................................................. 44
Table 22: Adelaide CBD and North Adelaide Rental Analysis, March 2019 ..................................................................................... 45
Table 23: Bedford Park and Environs Market Attributes, 2016 .......................................................................................................... 47
Table 24: Bedford Park Rental Analysis .................................................................................................................................................. 48
Table 25: Mawson Lakes Market Attributes, 2016 Census .................................................................................................................. 50
Table 26: Mawson Lakes Rental Analysis, March 2019 ........................................................................................................................ 51
Table 27: Major Owners and Operators of PBSA in Australia, 2019 .................................................................................................. 57
Table 28: Summary of SA Universities Existing Student Accommodation Analysis, 2019 .......................................................... 58
Table 29: Summary of Comparable Universities Existing Student Accommodation Analysis, 2019 ........................................ 58
Table 30: Demand Analysis (Scenario 1) Inner Adelaide Student Accommodation Demand ................................................ 61
Table 31: Demand Analysis (Scenario 2) Inner Adelaide Student Accommodation Demand ................................................ 62
Table 32: Demand Analysis (Scenario 1) Flinders University Student Accommodation Demand ......................................... 64
Table 33: Demand Analysis (Scenario 2) Flinders University Student Accommodation Demand ......................................... 65
Table 34: Demand Analysis (Scenario 1) University of SA Mawson Lakes Student Accommodation Demand .................. 67
Table 35: Demand Analysis (Scenario 2) University of SA Mawson Lakes Student Accommodation Demand .................. 68

                                                                                                                                                                                   Page 3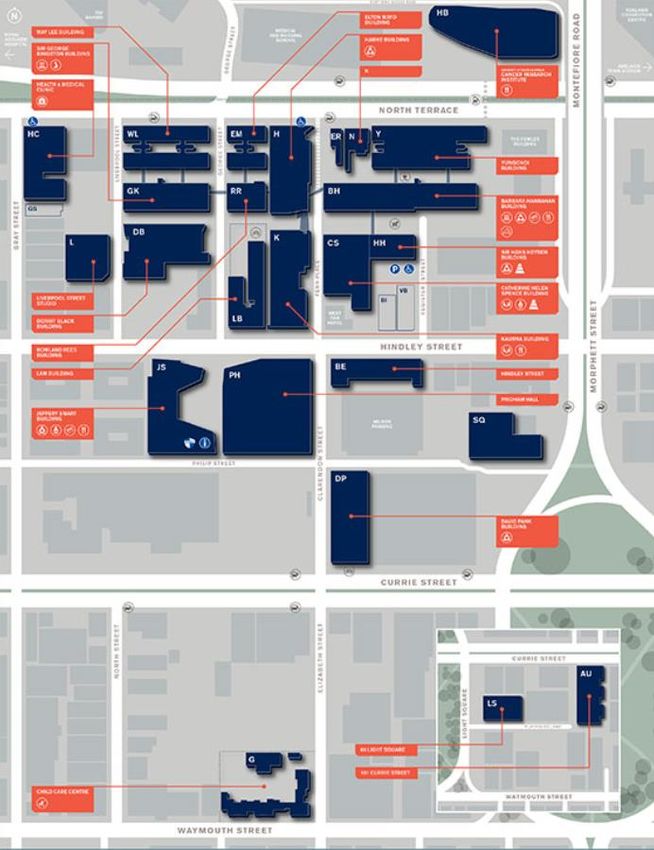
The Government of South Australia - Department for Trade, Tourism and Investment: Adelaide Student Accommodation Demand and Supply Analysis
Table 36: Summary PBSA Forecasts, 2020, 2025, 2030 ....................................................................................................................... 69
List of Figures
Figure 1: Location Map ............................................................................................................................................................................... 11
Figure 2: The University of Adelaide North Terrace Campus Map .................................................................................................... 17
Figure 3: Flinders University Bedford Park Campus Map North and South Ridge Precincts .................................................. 20
Figure 4: Flinders University Bedford Park Campus Map Flinders Living & Sturt Precincts..................................................... 20
Figure 5: Tonsley Site Map ......................................................................................................................................................................... 21
Figure 6: University of South Australia City East Campus Map.......................................................................................................... 24
Figure 7: University of South Australia City West Campus Map ........................................................................................................ 25
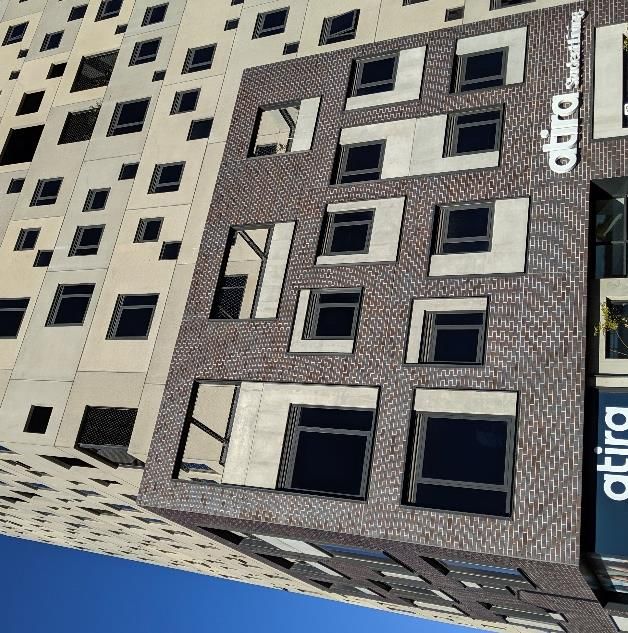
Figure 8: University of South Australia Mawson Lakes Campus Map .............................................................................................. 27
Figure 9: Full-time On-site Enrolments at The University of Adelaide, 2007-2017........................................................................ 28
Figure 10: Full-time On-site Enrolments at Flinders University, 2007-2017.................................................................................... 29
Figure 11: Full-time On-site Enrolments at University of South Australia, 2007-2017 ................................................................. 29
Figure 12: Location Map, Adelaide ........................................................................................................................................................... 44
Figure 13: Location Map, Bedford Park .................................................................................................................................................. 46
Figure 14: Location Map, Mawson Lakes ................................................................................................................................................ 49
Figure 15: Residents attending Universities by SA2 Geography, 2016 ............................................................................................. 52
Figure 16: Inner Adelaide PBSA Supply and Demand Summary, Scenario 1 ................................................................................. 70
Figure 17: Inner Adelaide PBSA Supply and Demand Summary, Scenario 2 ................................................................................. 70
Figure 18: Bedford Park / Tonsley PBSA Supply and Demand Summary, Scenario 1 ................................................................. 71
Figure 19: Bedford Park / Tonsley PBSA Supply and Demand Summary, Scenario 2 ................................................................. 71
Figure 20: Mawson Lakes PBSA Supply and Demand Summary, Scenario 1 ................................................................................ 72
Figure 21: Mawson Lakes PBSA Supply and Demand Summary, Scenario 2 ................................................................................ 72
Page 4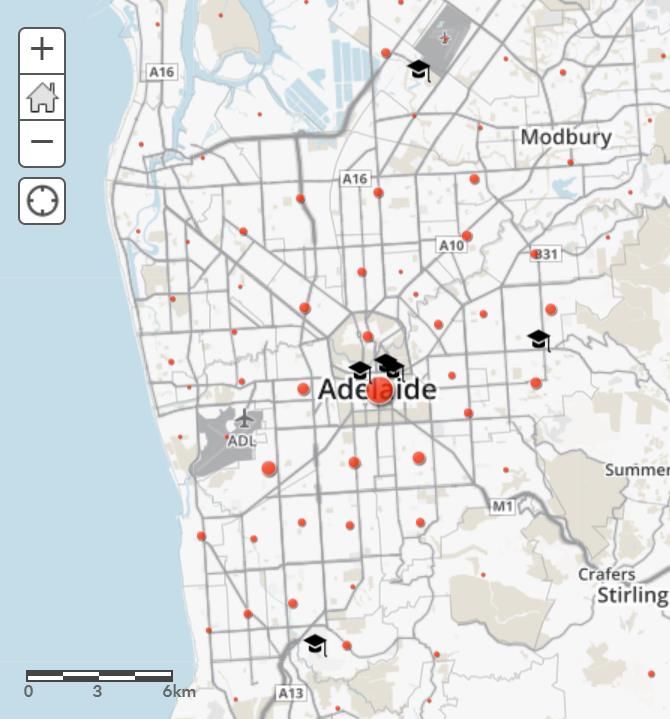
The Government of South Australia - Department for Trade, Tourism and Investment: Adelaide Student Accommodation Demand and Supply Analysis

Disclaimer
The material contained in this report is confidential and was provided by JLL to the party to whom it is addressed strictly for the specific purpose to
which it refers and no responsibility is accepted to any third party.

Neither JLL nor any of its associates have any other interests (whether pecuniary or not and whether direct or indirect) or any association or
relationships with any of its associates that might reasonably be expected to be or have been capable of influencing JLL in providing this report.
Neither the whole of the report nor any part or reference thereto may be published in any document, statement or circular or in any communication

Whilst the material contained in the report has been prepared in good faith and with due care by JLL, no representations or warranties are made
(express or implied) as to the accuracy of the whole or any part of the report.
JLL, its officers, employees, subcontractors and agents shall not be liable (except to the extent that liability under statute or by operation of law
cannot be excluded) for any loss, liability, damages or expense suffered by any party resulting from their use of this report.
If a projection has been made in respect of future demand, business trends, property prices, rentals and projected take up rates, such a projection is
an estimate only and represents only one possible result therefore should at best be regarded as an indicative assessment of possibilities rather than
absolute certainties. The process of making forward projections of such key elements involves assumptions about a considerable number of variables
that are acutely sensitive to changing conditions and variations, and any one of which may significantly affect the resulting projections. This must be
kept in mind whenever such projections are considered.
JLL is not operating under an Australian Financial Services Licence. The financial analysis and conclusions contained within this report do not purport
to represent a valuation in the conventional sense. It is an exercise involving only relatively few variables, such as zoning information and a general
knowledge of background market conditions; whereas, a valuation involves a detailed investigation of the property including, where appropriate, the
nature of the locality, surrounding properties, full inspection, site peculiarities, the nature, quality and condition of improvements, comparable sales,
market trends, yields, competition, design and layout and so on. The market value could be greatly affected by such factors, and by encumbrances,
restrictions, or other impediments on Title, which have not been considered in this report. Accordingly, the financial analysis contained herein is
indicative only and not authoritative. It is merely a precursor to a formal valuation and should not be taken as a substitute for it.

Report Author
David Snoswell
Senior Director
Alternative Investments
JLL
david.snoswell@ap.jll.com
+61 414 919 476

                                                                                                                                                    Page 5
The Government of South Australia - Department for Trade, Tourism and Investment: Adelaide Student Accommodation Demand and Supply Analysis

Executive Summary
International education is a key economic growth sector for South Australia. I
second largest general export following wine, contributing $1.8 billion in economic activity and supporting 12,500 jobs in
2018.
South Australia attracts students from over 130 markets and has experienced an average growth rate of 6% in student
enrolments over the past five years. The South Australian Government aims to increase international student enrolments
from 38,000 in 2018 to 71,000 in 2030 through a LIVE, LEARN and STAY approach.
Increased international student enrolments will place increased demand for quality and affordability student
accommodation in close proximity to the major higher education institutions, particularly those institutions attracting
high numbers of international student enrolments.
International students play an important role in the         economy, driving demand for a range of services, stimulating
activity and contributing to the vibrancy and diversity of the city. This is particularly so in the Adelaide CBD, where many
international                                         international student community also provides valuable education
and trade links with worldwide destinations.
The focus of this report is the Greater Adelaide area, and the three major education precincts in Adelaide (Adelaide CBD,
Bedford Park and Mawson Lakes). The main campuses of the University of Adelaide and University of South Australia
(UniSA) are located in Adelaide CBD, Flinders University is in Bedford Park, and UniSA has a campus at Mawson Lakes
with a large international student base.
In terms of demand for student accommodation, full-                                                 niversities are the key
drivers of demand, accounting for the majority of full-time enrolments. In 2017, there were 59,506 full-time enrolments in
SA, including 15,360 international students.

 2017 Full-time Enrolments                        Domestic       International             Total
 The University of Adelaide                           14,690               6,666          21,356
 University of South Australia                        16,150               4,705          20,855
 Flinders University                                  13,111               3,678          16,789
 Torrens University Australia                             195                 311           506
 Total, Full-time Enrolments                          44,146              15,360          59,506
Source: Department of Education & Training (uCube)
Note: Multi-modal students have been included as on-site enrolments. External (on-line) enrolments and part-time enrolments excluded

Continued growth in International Students
The number of international student enrolments in SA has continued to climb since 2012, reaching 37,965 enrolments in
2018. This is across five major sectors; Higher Education, Vocational Education and Training (VET), English Language
Intensive Courses for Overseas Students                                -
Preliminary enrolment data for April 2019 points to continued strong growth, particularly in the higher education and VET
sectors. Enrolment data for higher education for the year to April 2019 is 12.1% above April 2018 while enrolments for the
year to April 2019 in VET courses is 26.3% higher than April 2018.
 Sector                            2012        2013         2014         2015         2016           2017       2018      2019 (as at April)
 Higher Education                15,192      14,733       15,449       16,314       17,519         18,806     20,686                 19,218
 VET                              5,769       5,372        4,943        4,781        5,291          6,040      6,675                  5,529
 Schools                          1,794       1,832        1,817        2,124        2,452          2,676      2,875                  2,328
 ELICOS                           3,798       4,413        5,755        5,960        5,639          5,150      4,746                  2,505
 Non-award                        1,565       1,981        2,703        2,826        3,142          2,999      2,983                  1,971
 Grand Total                     28,118      28,331       30,667       32,005       34,043         35,671     37,965                31,551
Source: Department of Education & Training, International Enrolments released June 2019

                                                                                                                                         Page 6
The Government of South Australia - Department for Trade, Tourism and Investment: Adelaide Student Accommodation Demand and Supply Analysis

Each of the main universities as well as Torrens University Australia (TUA) has reported strong growth in international
enrolments together with applications for 2019.
Who accesses Purpose Built Student Accommodation (PBSA)?
The main student groups accessing PBSA are international students enrolled at the local universities followed by
Australian university students from regional SA and interstate, who do not have family living in Adelaide.
However, students enrolled across the other education sectors are showing increased interest in PBSA, including:
     •    VET students
     •    ELICOS students
     •    International school students / Under-18s
Furthermore, students enrolled at suburban university campuses may choose PBSA in the CBD for its lifestyle, public
transport and access to employment. Some PBSA operators in the Adelaide CBD have indicated that these markets
account for over 20% of the student base, with marketing of their product broadening to include a wider cross-section of
the student market.
Furthermore, Chinese students are highly represented in modern PBSA. They represent the largest source group but
account for an even higher market share of international students in PBSA.
Similarly, students from more affluent Asian markets are more likely to access PBSA than students from less affluent
markets. The security offered by PBSA is an important factor, particularly for their parents.
Operators also report that students from Europe, North America and South America make up a low proportion of the
student population in PBSA.
Supply and Development Pipeline
The Table below summarises PBSA at each of the three main student markets in Adelaide.
As at Semester 1 2019, there were 4,590 beds across Inner Adelaide. This included nearly 897 beds at the five residential
colleges in North Adelaide and 3,693 beds in PBSA, primarily located in the Adelaide CBD. An additional 802 beds opened
in Semester 2 2019, including UniLodge Gray Street.
Three large projects with approval are expected to open between 2020 and 2022:
     •    Wee Hur Waymouth Street (787 beds). Located at 124 Waymouth Street, the site has been cleared in mid-2019.
                                                                                  Adelaide CBD;
     •    GSA North Terrace (687 beds). Located at 266-269 North Terrace. Construction has commenced. GSA is a new
          market entrant to Adelaide;
     •    UniLodge Twin Street (510 beds). To be developed by The Hines Group. Located behind Ibis Adelaide.
By 2022, there is expected to be 7,376 student accommodation beds across Inner Adelaide.
Significantly, between 2018 and 2022, the number of new student accommodation beds in Inner Adelaide will have grown
by more than 4,200, providing a significant boost to the inner city population and businesses. The development value
alone of the eight new projects to be completed between 2018 and 2022 in the Adelaide CBD is $525 million.
By comparison, Mawson Lakes and Bedford Park have limited student accommodation. Additional PBSA to serve Flinders
University is proposed at Tonsley and in Flinders Village Bedford Park, although timing of this accommodation has yet to
be announced.
                                                                     Existing Supply,          New Supply,           Pipeline,
                                   Main Universities                                                                                 Total, 2022
                                                                         Sem-1 2019             Sem-2 2019            2020-22
 Inner Adelaide                    Adelaide; UniSA                                 4,590                  802            1,984                7,376
 Mawson Lakes                      UniSA Mawson Lakes                                300                      -                -               300
 Bedford Park / Tonsley            Flinders University                               529                      -                -               529
 Total                                                                             5,419                  802            1,984                8,205
Source: JLL

                                                                                                                                         Page 7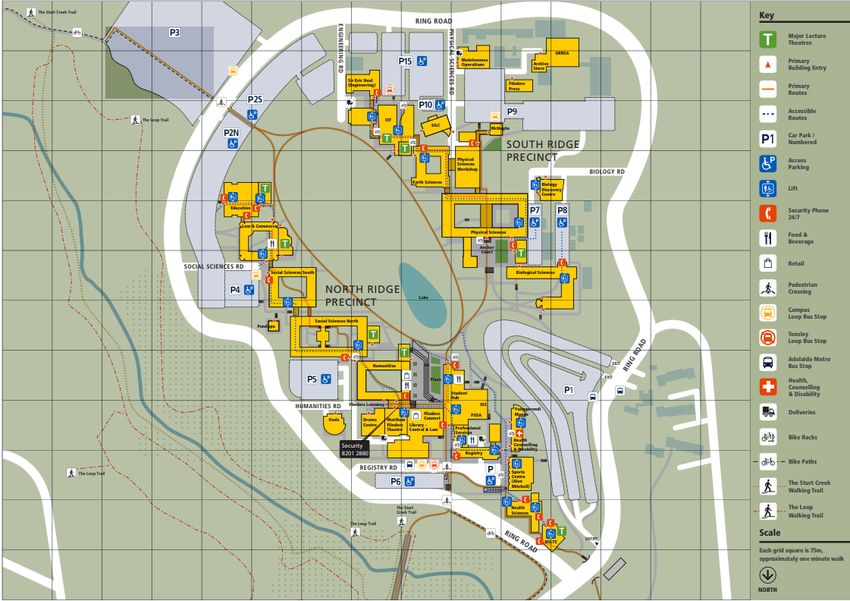
The Government of South Australia - Department for Trade, Tourism and Investment: Adelaide Student Accommodation Demand and Supply Analysis
Pricing
Pricing for catered student accommodation in a private single room averages approximately $500 per week based on a
40-week university year.
Pricing for self-catered accommodation varies significantly based on the quality of accommodation and format. Modern
PBSA in the Adelaide CBD ranges from less than $300 per week for twin share accommodation to around $450 per week
for a large studio with ensuite. Starting prices are approximately $200 per week. Pricing includes utilities and Internet.
The private rental market provides an alternative to PBSA. With market penetration rates in PBSA of around 20% for
international university students (and lower in suburban locations), the majority of international students are accessing
private rental accommodation.
Median rents for apartments in Adelaide are competitive compared with PBSA pricing, particularly when students share
a two or three bedroom apartment. However, most PBSA provides a range of inclusions that are not typically provided in
the private rental market. These include:
• Fully furnished rooms / apartments
• Utilities and Internet
• Common areas available for the use of students, featuring recreation facilities, kitchens, study rooms etc.
• On-site staff / security
Occupancy Rates
Discussions with market operators suggest that the Adelaide PBSA market is operating at 85%-95% occupancy, which
suggests a reasonably balanced market with current supply meeting demand. Some new PBSA is yet to reach a stabilised
level of occupancy with improved occupancy levels expected over the next 12 months.
Operators of PBSA
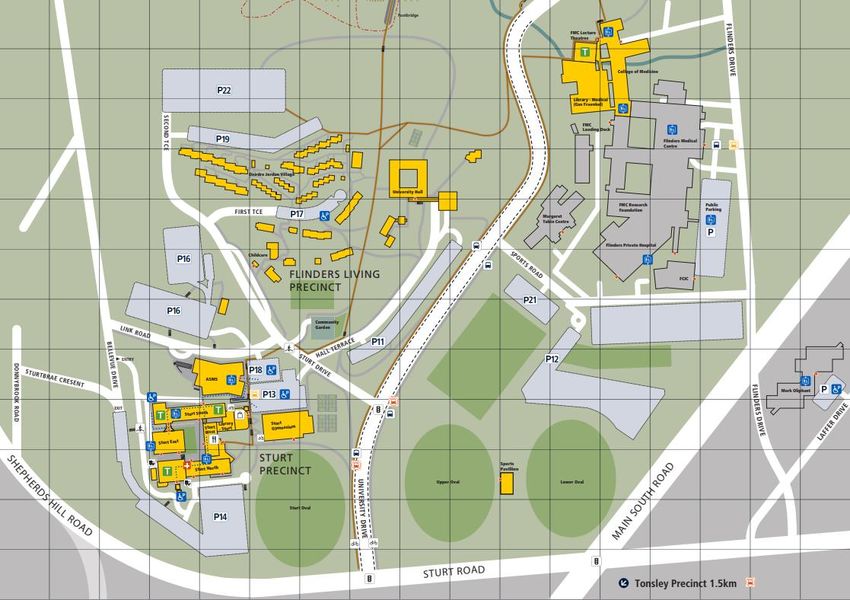
Adelaide has attracted many of the large private owners and operators of PBSA including Urbanest, Atira, GSA and Wee
Hur.
The two main operating models for PBSA in Australia are the Owner-Operator Model and the Third Party Operator Model:
• Owner Operator Model: The recent wav
-one-
• Third Party Operator Model: For developers and investors who do not have an affiliated operational arm, a
third party operator is appointed. UniLodge is the largest established operator and offers an end-to-end model
for investors (from purchase to selling) with a dedicated property management model.
Supply - Demand Balance
The balance between supply of student accommodation and demand in 2019 is summarised below. The number of full-
time students per bed in the Adelaide CBD is lower than both Mawson Lakes and Bedford Park.
Full-time Student
Adelaide CBD Uni SA Mawson Lakes Flinders University
Enrolments, 2019
Student Profile
Domestic Students 24,963 1,794 12,713
International Students 12,311 1,556 4,492
Total Students 37,274 3,350 17,204
Accommodation Supply
Total Rooms 5,402 300 529
FT Students Per Bed 6.9 11.2 32.5
Source: Department of Education and Training, JLL
Page 8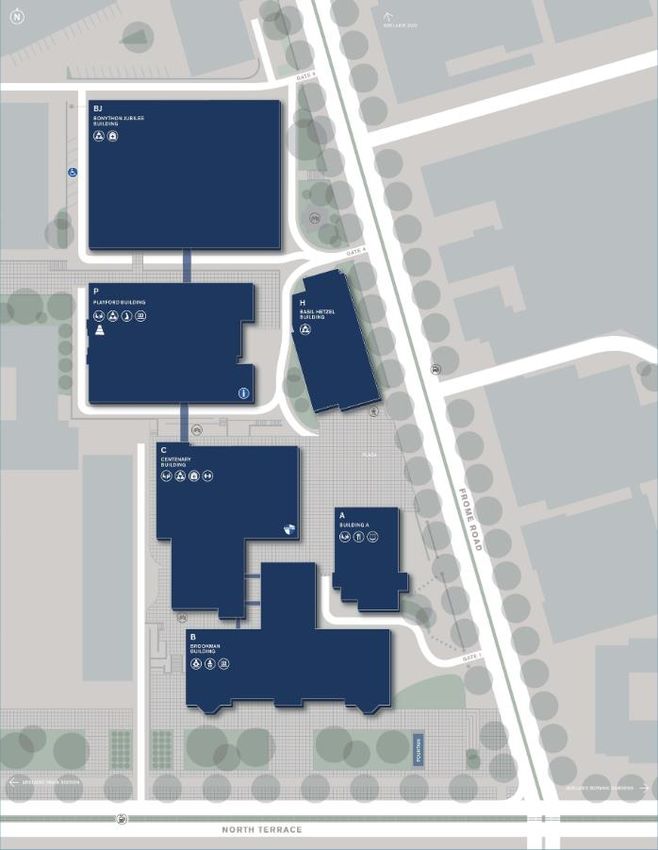
The Government of South Australia - Department for Trade, Tourism and Investment: Adelaide Student Accommodation Demand and Supply Analysis

Forecasts
Forecasts have been undertaken under two scenarios for each of the following locations:
     •    Inner Adelaide
     •    Mawson Lakes
     •    Bedford Park / Tonsley
Scenario 1 provides a base case, based largely on the existing proportion of full-time university students who are choosing
PBSA in inner Adelaide and suburban markets. Scenario 2 allows for realistic growth in market share over time.
The forecasts assume the international student market reaches 71,000 enrolments by 2030.
                                                                                                                          Beds Needed
 Market                           Scenario       Assumptions                                                    2020         2025             2030
                                                 International Student Market Share: 20%
                                                 Domestic Market Share: 4.5%
 Inner Adelaide                   Scenario 1                                                                     -633          -1,633         -584
                                                 Vacancy rate:7.5%
                                                 Students from beyond local universities: 15%
                                                 International Student Market Share: 20% rising to 30%
                                                 Domestic Market Share: 4.5% rising to 5.0%
                                  Scenario 2                                                                     -278            77           2,548
                                                 Vacancy rate:7.5%
                                                 Students from beyond local universities: 15% rising to 20%
                                                 International Student Market Share: 10%
                                                 Domestic Market Share: 2.5%
 Bedford Park / Tonsley           Scenario 1                                                                      317           452           621
                                                 Vacancy rate:7.5%
                                                 Students from beyond local universities: 2%
                                                 International Student Market Share: 10% rising to 20%
                                                 Domestic Market Share: 2.5%
                                  Scenario 2                                                                      365           816           1,389
                                                 Vacancy rate:7.5%
                                                 Students from beyond local universities: 2%
                                                 International Student Market Share: 15%
                                                 Domestic Market Share: 2%
 Mawson Lakes                     Scenario 1                                                                       1             68           153
                                                 Vacancy rate:7.5%
                                                 Students from beyond local universities: 2%
                                                 International Student Market Share: 15% rising to 20%
                                                 Domestic Market Share: 2%
                                  Scenario 2                                                                      18            173           286
                                                 Vacancy rate:7.5%
                                                 Students from beyond local universities: 2%

Source: JLL

Inner Adelaide Forecasts
     •    Under Scenario 1, the strong pipeline through to 2022 will provide sufficient capacity to accommodate strong
          growth in international student enrolments, at least through to 2025.
     •    Under Scenario 2, 2,548 beds may be required by 2030. This is in addition to major approved projects that are
          expected to be completed by 2022. This assumes 30% of full-time international students choose PBSA and
          20% of the student base comes from outside the local universities.
Bedford Park / Tonsley
     •    Under Scenario 1, an additional 621 beds of PBSA will be required by 2030 based on growth in the student
          population at Flinders University;
     •    Under Scenario 2, an additional 1,389 beds will be required by 2030. This assumes 20% of local full-time
          international students choose PBSA at Flinders University.
Mawson Lakes Forecasts
     •    Under Scenario 1, an additional 153 beds of PBSA will be required by 2030 based on growth in the student
          population at the Mawson Lakes campus of UniSA;
     •    Under Scenario 2, an additional 286 beds will be required by 2030. This assumes 20% of local full-time
          international students choose PBSA at the Mawson Lakes campus of UniSA.

                                                                                                                                         Page 9
The Government of South Australia - Department for Trade, Tourism and Investment: Adelaide Student Accommodation Demand and Supply Analysis
Introduction
The Department for Trade, Tourism and Investment (DTTI) has engaged JLL to undertake a detailed demand and supply
The SA Government has set an ambitious economic growth target of 3% growth in Gross State Product annually. It has
identified five key areas of focus to facilitate this growth including an improved business climate, government, overseas
engagement, investment and infrastructure.
International education is a major contributor to the s
largest general export worth $1.807 billion in 2018, supporting over 12,500 full-time equivalent (FTE) jobs.1 International
performance as an export, a mechanism for population
growth, a supplier of skills for growth industries and as a source of investment attraction.
SA Government has worked closely with the international education sector both directly and through the Ministerial
Advisory Committee for International Education, to set a new industry led target for growth. By 2030, international
education is targeted to grow to 71,000 international student enrolments, contributing $3.0 billion per year
economy, and supporting around 21,000 FTE jobs.
To achieve these targets, new investment will be required in student accommodation.
This report provides analysis of the student
universities and attracts the vast majority of s international student community. The future demand for student
accommodation in Adelaide is based on the state government growth targets together with recent trends in international
student growth.
JLL previously undertook a study on behalf of the Department of State Development in 2016. This report updates the
findings of the previous study.
The focus of this study is purpose-built student accommodation (PBSA) that is generally occupied by international
students in the Adelaide CBD and inner suburban region,
university campuses, being Mawson Lakes (UniSA Mawson Lakes campus) and Bedford Park / Clovelly Park (Flinders
University).
It should be noted that domestic students also create demand for student accommodation, particularly students from
country regions of SA or interstate, who cannot live at home and attend university in Adelaide. Demand from this sector
of the student market is also taken into account when determining the overall demand for new PBSA to support the future
student population.
1
ABS (Cat 5368.0.55.004); www.internationaleducation.gov.au
Page 10The Government of South Australia - Department for Trade, Tourism and Investment: Adelaide Student Accommodation Demand and Supply Analysis
Adelaide Overview
2.1 Overview
Greater Adelaide is the capital city of SA and is the fifth largest city in Australia, with a population of circa 1.355 million as
at June 2019 (77.5% of SA The Adelaide Central Business District (CBD) is the heart of SA
commercial sectors bounded by North, East, South and West Terrace.
The main education precinct is located within the Adelaide CBD and fronting North Terrace. Within this precinct are the
University of Adelaide, the City West and City East campuses of the University of South Australia (UniSA), TAFE SA, a
number of colleges and other educational providers.
Existing student accommodation serving CBD-based education providers is located within the Adelaide CBD and North
Adelaide. However, not all of the existing accommodation is purpose built and varies significantly in quality of
accommodation and services. Accommodation in North Adelaide is primarily residential colleges, affiliated with religious
organisations, and provides catered accommodation targeting the domestic market. Accommodation in the Adelaide
CBD is typically self-catered accommodation and has been developed more recently by private PBSA operators. This
accommodation primarily targets the international student market.
Outside the CBD, UniSA has a campus in the Mawson Lakes area 15 kilometres north of the CBD and a small campus at
Magill, approximately 7km east of the CBD. Flinders University s located at Bedford Park, 12 kilometres
south of the CBD with a smaller campus at the adjoining Tonsley Innovation District.
The following map identifies the agreed study areas for this report within Adelaide.
Figure 1: Location Map
Source: Google Maps
Page 11The Government of South Australia - Department for Trade, Tourism and Investment: Adelaide Student Accommodation Demand and Supply Analysis
2.2 Demographics
Table 1 and 2 provides a comparison of the City of Adelaide (including North Adelaide and the Adelaide CBD) to the
Greater Adelaide Metropolitan Region. This is as at the 2016 Census.
The data highlights the following:
• The high proportion of young adults in Adelaide (C), highlighting the very large student population
• High proportion of Asian born residents, predominantly international students from markets such as China,
India and Nepal studying in Adelaide
• 27% of residents in Adelaide (C) attend university or other tertiary institutions. A further 11.6% of residents were
undertaking some form of education (but institution not stated), suggesting an even higher proportion of
residents in Adelaide (C) would be attending university
• Dominance of the rental market in Adelaide (C), with many renters anecdotally being students
Table 1: Selected Characteristics of Residents, City of Adelaide LGA and Greater Adelaide, 2016
Selected Characteristic Adelaide (C) LGA Greater Adelaide
Estimated Resident Population, 2016 23,400 1,326,400
Age Distribution
0-4 years 2.3% 5.9%
5-14 years 3.2% 11.6%
15-19 years 7.2% 6.1%
20-24 years 21.3% 6.9%
25-34 years 23.6% 13.8%
35-44 years 10.8% 12.9%
45-54 years 9.7% 13.4%
55-64 years 9.0% 12.2%
65 years & over 13.0% 17.2%
Birthplace
Australia 45.5% 68.2%
UK & Ireland 5.0% 7.5%
Europe 2.6% 4.0%
Asia 28.7% 9.8%
New Zealand 1.0% 0.8%
Other 7.1% 4.2%
Not stated 10.2% 5.4%
Education Attending
Pre school 0.5% 1.2%
Primary 2.3% 8.5%
Secondary 1.9% 5.6%
TAFE 2.3% 2.0%
University / Other tertiary 27.0% 5.7%
Other 1.1% 0.8%
Not stated 11.6% 5.7%
Total - Attending Education 46.6% 29.5%
Housing Status
Owner 21.1% 31.4%
Purchaser 17.7% 37.4%
Renter 60.2% 29.6%
Other 1.0% 1.6%
Source: JLL, Australian Bureau of Statistics 2016 Census
Page 12The Government of South Australia - Department for Trade, Tourism and Investment: Adelaide Student Accommodation Demand and Supply Analysis
Table 2: Selected Medians, City of Adelaide LGA and Greater Adelaide, 2016
Selected Medians Adelaide (C) LGA Greater Adelaide
Median age of persons 30 39
Median mortgage repayment ($/monthly) 1,733 1,517
Median total personal income ($/weekly) 553 617
Median rent ($/weekly) 375 285
Median total family income ($/weekly) 2,026 1,591
Average number of persons per bedroom 0.9 0.8
Median total hhold income ($/weekly) 1,266 1,265
Average household size 1.9 2.5
Source: JLL, Australian Bureau of Statistics 2016 Census
2.3 Adelaide Student Demographics Summary
The number of international student enrolments in SA has continued to climb since 2012, reaching 37,965 enrolments in
2018. This comprised 20,686 higher education students with the balance made up of students enrolled in other education
sectors such as Vocational Education and Training (VET), English Language Intensive Courses for Overseas Students
(ELICOS), schools and non-award courses.
Preliminary enrolment data is available up to April 2019, which highlights that very strong growth has continued into 2019.
Year to April 2019 enrolments, which would account for the vast majority of students enrolled in the first semester of the
academic year, were 12.1% higher than the corresponding period in 2018. Higher education enrolments had already
reached 19,218 by April 2019. Based on growth in enrolments between April 2018 and April 2019, total enrolments for the
2019 calendar year should reach around 42,600 international student enrolments, with 23,500 being higher education
enrolments.
There has also been very strong growth experienced in the VET sector. Enrolments to April 2019 had already reached over
5,500, which is 26.3% higher than the corresponding period in 2018. Should this trend continue, VET enrolments in 2018
will reach over 8,400 for the 2019 calendar year.
The majority of higher education students study at the three main Adelaide-based universities: The University of Adelaide,
Flinders University and UniSA. The rest of the student population study at other private providers of higher education,
including a range of colleges and institutes. While there are small campuses of both the University of Adelaide and UniSA
outside of Adelaide, these do not attract large student numbers, with the vast majority of international students to SA
being Adelaide-based.
Table 3: Summary of International Student Enrolments in SA, 2012-2019*
Sector 2012 2013 2014 2015 2016 2017 2018 2019 (as at April)
Higher Education 15,192 14,733 15,449 16,314 17,519 18,806 20,686 19,218
VET 5,769 5,372 4,943 4,781 5,291 6,040 6,675 5,529
Schools 1,794 1,832 1,817 2,124 2,452 2,676 2,875 2,328
ELICOS 3,798 4,413 5,755 5,960 5,639 5,150 4,746 2,505
Non-award 1,565 1,981 2,703 2,826 3,142 2,999 2,983 1,971
Grand Total 28,118 28,331 30,667 32,005 34,043 35,671 37,965 31,551
Source: Department of Education & Training
* 2019 enrolment data is for year to April-19. April-19 data is 12.1% higher than April-18 data, indicating strong year-on-year growth
The strong growth in Higher Education students is expected to continue, with ambitious plans in place by the key
institutions:
• On-campus international student enrolments at the University of Adelaide is expected to rise from 7,877 in
2018 to over 10,000 in 2019.
• International student enrolments at Flinders University has increased from under 5,000 in 2017 to 5,400 in
2018, and is expected to reach around 6,000 enrolments in 2019.
• UniSA has experienced modest growth in its international student enrolments, growing from 5,400 in 2017 to
5,700 in 2018, with an estimated 6,000 enrolments in 2019.
Page 13The Government of South Australia - Department for Trade, Tourism and Investment: Adelaide Student Accommodation Demand and Supply Analysis
SA provides a range of benefits for international graduates from SA-based institutions, via its skilled visa pathways. This
supports the growth in international students deciding to study in the State. The key benefits of studying in SA include:
• Access to a more extensive occupation list for graduates planning to undertake post-study work;
• A eral Skilled Migration (GSM) points test by
choosing SA;
• An extra year of post-study work in SA for graduates who have maintained residence in SA;
• Flexible state nomination requirements for international graduates of SA, including incentives for long-term
residents of SA such as work experience and English language and financial capacity waivers for eligible
international graduates
• Priority processing of applications with the Department of Home Affairs. Adelaide is by far the largest
Australian city eligible for priority processing arrangements
Similarly, the international VET sector has also shown strong recent growth.
The following table provides the number of full-time, on-site students studying at higher education institutions in SA. We
note that each university has multiple campuses but the vast majority of enrolments are within Greater Adelaide. Higher
education students remain the main market for PBSA. Enrolment data by university is currently available for 2017 from
the Australian Governmen .
Total full-time on-site enrolments in the four main universities in SA was 59,506 in 2017, including 15,360 international
enrolments. The number of full-time international enrolments in SA is estimated to have grown to between 18,500 and
19,000 in 2019.
Table 4: Full Time, On-site Student Enrolments in SA, 2017
2017 Full-time Enrolments Domestic International Total
The University of Adelaide 14,690 6,666 21,356
University of South Australia 16,150 4,705 20,855
Flinders University 13,111 3,678 16,789
Torrens University Australia* 195 311 506
Total, Full-time Enrolments 44,146 15,360 59,506
Source: Department of Education & Training (uCube), Torrens University Australia
Note: Multi-modal students have been included as on-site enrolments. External (on-line) enrolments and part-time enrolments excluded
* Estimated enrolments based at Adelaide campus
Page 14The Government of South Australia - Department for Trade, Tourism and Investment: Adelaide Student Accommodation Demand and Supply Analysis
South Australian Universities Overview
This section provides an overview of the main universities serving SA. Our focus is on the main campuses of each
university in the Greater Adelaide region.
3.1 The University of Adelaide
The University of Adelaide is a highly regarded
tertiary education and research institution, being
ranked 106th in the world in the 2020 QS World
Eight (G8) a coalition of leading universities.
The university was established in 1874 and is the
oldest university in SA.
The University of Adelaide is ranked in the top 1% in
the world in 11 research fields. It has major strengths
in many science subjects including environmental
sciences and social sciences.
The University of Adelaide has its main campus on North Terrace and three other regional campuses. The following
statistics highlight the University of Adelaide student demographics as at 2017.
• International / domestic 28% / 72% • On campus / multi-modal / 95.6% / 2.9% / 1.5%
students off campus students
• Domestic undergraduate / 81% / 19% • Domestic full-time / 77% / 33%
postgraduate students domestic part-time students
• International undergraduate / 51% / 49% • International full-time / 88% / 12%
postgraduate students international part-time
students
The University of Adelaide has the largest percentage of international
also dominated by on-campus students (96% of student enrolments) and full-time students.
Table 5 shows the number of domestic and international students enrolled into the University of Adelaide and split
between mode of attendance (internal, external and multi-modal), type of attendance (full/part-time) and course level
(undergraduate, postgraduate, non-award/enabling courses). There is a relatively even split between postgraduate and
undergraduate international students.
Page 15The Government of South Australia - Department for Trade, Tourism and Investment: Adelaide Student Accommodation Demand and Supply Analysis
Table 5: The University of Adelaide, Number of Student Enrolments, 2017
Internal Multi-modal External Total
Full- Part- Full- Part- Full- Part- Full- Part-
time time time time time time time time Total
Domestic
Postgraduate 1,614 1,468 117 99 57 306 1,788 1,873 3,661
Undergraduate 12,437 2,522 446 17 12,883 2,539 15,422
Non-Award / Enabling 76 100 76 100 176
Total 14,127 4,090 563 116 57 309 14,747 4,515 19,262
International
Postgraduate 3,077 505 51 9 14 30 3,142 544 3,686
Undergraduate 3,451 309 36 3,487 309 3,796
Non-Award / Enabling 49 38 2 51 38 89
Total 6,577 852 89 9 14 30 6,680 891 7,571
Total 20,704 4,942 652 125 71 339 21,427 5,406 26,833
Source: Department of Education and Training (uCube)
The University of Adelaide North Terrace Campus
Location and Facilities
main campus is located on North Terrace, within Adelaide CBD, between Frome Road and
Kintore Avenue. However, with the completion of the AHMS building (see below), its North Terrace presence now extends
further west. North Terrace is home to over 90% of the uni . Areas of focus are the Schools of
Engineering, Computer and Mathematical Sciences, Health Science, Arts, Business and Sciences. The campus also
provides Medical and Dental Schools providing a strong focus on practice-based learning to students.
The University of Adelaide allows students, staff and visitors to easily access the university via public
transport.
The university has a range of facilities such as sporting facilities in the nearby Parklands, a fitness hub, post office, library,
theatres, as well as cafes.
Strategic Plan Future Making
connected to the global world of
ideas, a magnet for talent, research that shapes the future, a 21 century education for a growing community of learners,
st
and the beating heart of Adelaide. The Plan aims to grow and diversify its student cohort, increasing its international
enrolments significantly, attracted to the university by its international reputation and standing. Part of the growth
strategy is through long-term partnerships with international universities, which will see domestic students studying
abroad as well as international students undertaking part of their degree in Australia.
Infrastructure Projects and Masterplan 2016-2035
The University of Adelaide has a strong focus on its Adelaide CBD campus, with this campus accounting for well over 90%
of its on-site enrolments.
Over the last five years, the university has invested over $500 million in major capital works, including the construction of
the University of Adelaide Health and Medical Sciences building (AHMS), its new home of medical education. The building
is situated in the heart of the new Adelaide BioMed City on North Terrace alongside the Royal Adelaide Hospital and South
Australian Health and Medical Research Institute (SAHMRI). The AHMS houses approximately 1,700 students and 600
health researchers over its 14 floors, and includes laboratories, lecture theatres, advanced simulation suites, a dental
hospital, a clinical research facility and social / study spaces.
The Campus Masterplan 2016-2035 provides guidance for the ongoing development of the universi puses
North Terrace, Waite and Roseworthy
creating a campus that is connected to the rest of the Adelaide CBD.
Page 16The Government of South Australia - Department for Trade, Tourism and Investment: Adelaide Student Accommodation Demand and Supply Analysis
Enrolments by Campus
Most University of Adelaide students are enrolled at its North Terrace campus, which includes students at the new
medical precinct. The North Terrace campus accounts for 96% of student enrolments. It is noted that some students
attend more than one campus, which explains that total enrolments are less than the sum of enrolments at each campus.
International enrolments at the North Terrace campus account for 29% of enrolments.
Table 6: The University of Adelaide, 2018 Enrolments by Campus
Total
Campus Domestic International Total Enrolments % Total
North Terrace 18,399 7,611 26,010 25,997 96%
Roseworthy 711 74 785 785 3%
Waite 594 274 868 868 3%
Other 931 219 74 1,150 4%
Total Enrolments n.a. n.a. n.a. 27,062
Source: The University of Adelaide
t have changed
their citizenship status during the year.
Figure 2: The University of Adelaide North Terrace Campus Map
Source: University of Adelaide
Page 17The Government of South Australia - Department for Trade, Tourism and Investment: Adelaide Student Accommodation Demand and Supply Analysis
3.2 Flinders University
Flinders University was established in 1966 and has its main
campus at Bedford Park (which is approximately 12 km from
university has a new campus at nearby
Tonsley, a smaller campus at 182 Victoria Square within
Flinders University has a strong focus on research, and was
the first university in the world to have a bachelor course in
nanotechnology. It was also the first university in Australia to
offer a graduate entry medical course.
The following statistics highlight the Flinders University student demographics as at 2017.
• International / domestic 19% / 81% • On campus / multi-modal / 78% / 9% / 13%
students off campus students
• Domestic undergraduate / 70% / 30% • Domestic full-time / domestic 66% / 34%
postgraduate students part-time students
• International undergraduate 30% / 70% • International full-time / 78% / 22%
/ postgraduate students international part-time
students
Flinders University attracts a relatively high proportion of postgraduate international students compared with both UniSA
and Adelaide.
Table 7 shows the number of domestic and international students enrolled in Flinders University and split between mode
of attendance (internal, external and multi-modal), type of attendance (full/part-time) and course level (undergraduate,
postgraduate, non-award/enabling courses).
Table 7: Flinders University, Number of Student Enrolments, 2017
Internal Multi-modal External Total
Full- Part- Full- Part- Full- Part- Full- Part-
time time time time time time time time Total
Domestic
Postgraduate 1,393 840 412 317 430 2,495 2,235 3,652 5,887
Undergraduate 9,734 2,753 988 218 85 246 10,807 3,217 14,024
Non-Award / Enabling 584 65 584 65 649
Total 11,711 3,658 1,400 535 518 2,746 13,629 6,939 20,568
International
Postgraduate 2,119 835 301 10 9 28 2,429 873 3,302
Undergraduate 1,189 170 57 3 2 1,246 175 1,421
Non-Award / Enabling 12 12 - 12
Total 3,320 1,005 358 13 9 30 3,687 1,048 4,735
Total 15,031 4,663 1,758 548 527 2,776 17,316 7,987 25,303
Source: Department of Education and Training (uCube)
Page 18You can also read