Adult obesity and type 2 diabetes
←
→
Page content transcription
If your browser does not render page correctly, please read the page content below
Adult obesity and type 2 diabetes
Adult obesity and type 2 diabetes

About Public Health England
Public Health England’s mission is to protect and improve the nation’s health and
to address inequalities through working with national and local government, the
NHS, industry and the voluntary and community sector. PHE is an operationally
autonomous executive agency of the Department of Health.

Public Health England
133-155 Waterloo Road
Wellington House
London SE1 8UG
Tel: 020 7654 8000
www.gov.uk/phe
Twitter: @PHE_uk
Facebook: www.facebook.com/PublicHealthEngland

Authors: Gatineau Mary, Hancock Caroline, Holman Naomi, Outhwaite Helen,
Oldridge Lorraine, Christie Anna and Ells Louisa

© Crown copyright 2014
You may re-use this information (excluding logos) free of charge in any format or
medium, under the terms of the Open Government Licence v2.0. To view this
licence, visit OGL or email psi@nationalarchives.gsi.gov.uk. Where we have
identified any third party copyright information you will need to obtain permission
from the copyright holders concerned. Any enquiries regarding this publication
should be sent to mary.gatineau@phe.gov.uk.

Published July 2014
PHE publications gateway number: 2014211

This document is available in other formats on request. Please contact
publications@phe.gov.uk

                                             2
Adult obesity and type 2 diabetes

With thanks to reviewers:

Professor Jonathan Valabhji, National Clinical Director for Obesity and
Diabetes, NHS England

Dr Tahseen Chowdhury, Consultant in Diabetes and Metabolism, Royal
London Hospital

Dr Bob Young, Consultant Diabetologist, NDIS and Salford Royal NHS
Foundation Trust

Simon O'Neill, Director of Health Intelligence and Professional Liaison,
Diabetes UK
Alison Tedstone, Louis Levy, Vicki Pyne, Harry Rutter, PHE

                                             3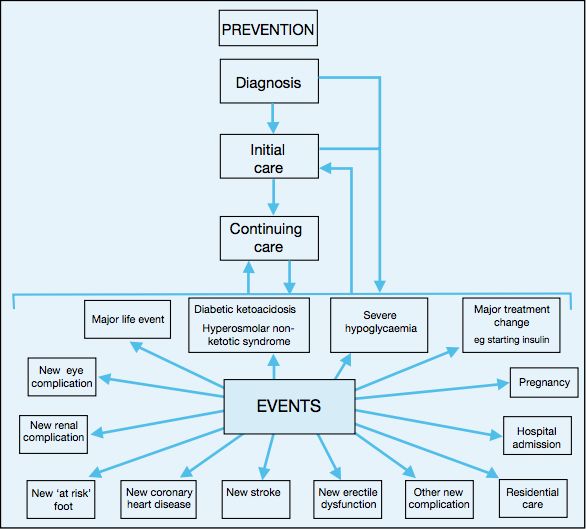
Adult obesity and type 2 diabetes

Contents
About Public Health England                                  2
Contents                                                     4
Summary                                                      5
1. Aim                                                       6
2. Obesity and diabetes                                      6
3. How common are obesity and diabetes?                      7
4. How are obesity and diabetes linked?                      13
5. Risk factors for type 2 diabetes                          15
6. What are the health implications of diabetes?             18
7. What are the cost implications of obesity and diabetes?   22
8. Conclusion                                                26
9. Appendix                                                  26
References                                                   34
Reader information                                           39

                                            4
Adult obesity and type 2 diabetes
Summary
Prevalence
Being overweight or obese is the main modifiable risk factor for type 2 diabetes. In
England, obese adults are five times more likely to be diagnosed with diabetes than
adults of a healthy weight. Currently 90% of adults with type 2 diabetes are
overweight or obese. People with severe obesity are at greater risk of type 2 diabetes
than obese people with a lower BMI.
Inequalities
Deprivation is closely linked to the risk of both obesity and type 2 diabetes.
Prevalence of type 2 diabetes is 40% more common among people in the most
deprived quintile compared with those in the least deprived quintile. People from
black, Asian and other minority ethnic groups are at an equivalent risk of type 2
diabetes at lower BMI levels than white European populations.
Health impact
People with diabetes are at a greater risk of a range of chronic health conditions
including cardiovascular disease, blindness, amputation, kidney disease and
depression than people without diabetes. Diabetes leads to a two-fold excess risk for
cardiovascular disease, and diabetic retinopathy is the leading cause of preventable
sight loss among people of working age in England and Wales. Diabetes is a major
cause of premature mortality with around 23,300 additional deaths in 2010-11 in
England attributed to the disease.
Economic impact
It is estimated that in 2010-11 the cost of direct patient care (such as treatment,
intervention and complications) for those living with type 2 diabetes in the UK was
£8.8 billion and the indirect costs (such productivity loss due to increased death and
illness and the need for informal care) were approximately £13 billion. Prescribing for
diabetes accounted for 9.3% of the total cost of prescribing in England in 2012-13.
Future trends
In England, the rising prevalence of obesity in adults has led, and will continue to
lead, to a rise in the prevalence of type 2 diabetes. This is likely to result in increased
associated health complications and premature mortality, with people from deprived
areas and some minority ethnic groups at particularly high risk. Modelled projections
indicate that NHS and wider costs to society associated with overweight, obesity and
type 2 diabetes will rise dramatically in the next few decades.
5Adult obesity and type 2 diabetes
1. Aim
The aim of this paper is to describe the relationship between obesity and diabetes
to support public health policy makers and practitioners. The paper provides an
overview of obesity and type 2 diabetes among adults, describing the
epidemiology of each disorder, how the two conditions are linked and why they
present a major public health challenge. Latest available data and evidence
illustrate prevalence trends in both obesity and diabetes at a national and local
level as well as the potential implications in terms of health consequences,
inequalities and cost. The paper also signposts latest relevant policy and guidance
documents.
2. Obesity and diabetes
Diabetes is a metabolic condition in which the body does not produce sufficient
insulin to regulate blood glucose levels or where the insulin produced is unable to
work effectively. There are two main types of diabetes:
Type 1 diabetes is an auto-immune condition in which the cells that produce
insulina are destroyed so lifelong treatment with insulin is required to prevent
death. About 10% of people with diagnosed diabetes have type 1 diabetes.
Type 2 diabetes accounts for at least 90% of all cases of diabetes.1,2 It occurs
when the body either stops producing enough insulin for its needs or becomes
resistant to the effect of insulin produced. The condition is progressive requiring
lifestyle management (diet and exercise) at all stages. Over time most people with
type 2 diabetes will require oral drugs and or insulin. Type 2 diabetes may remain
undetected for many years.2
Obesity is only associated with type 2 diabetes and this paper does not cover type
1 diabetes, which has no association with obesity or other lifestyle factors, or other
forms of diabetes such as gestational diabetes or MODY.b Some data and
evidence sources in this paper do not specifically define diabetes type and where
this occurs it is clearly described.
a
Insulin plays a key role in the regulation of carbohydrate, fat, and protein metabolism. Insulin preparations
can be divided into 3 types: those with short duration which have a relatively rapid onset of action; those
with intermediate action and those whose action is slower in onset and lasts for long periods
b
Maturity Onset Diabetes of the Young
6Adult obesity and type 2 diabetes
The relationship between obesity and type 2 diabetes
There is a close association between obesity and type 2 diabetes. The likelihood
and severity of type 2 diabetes are closely linked with body mass index (BMI).
There is a seven times greater risk of diabetes in obese people compared to those
of healthy weight, with a threefold increase in risk for overweight people. 3 Whilst it
is known that body fat distribution is an important determinant of increased risk of
diabetes, the precise mechanism of association remains unclear. It is also
uncertain why not all people who are obese develop type 2 diabetes and why not
all people with type 2 diabetes are obese.4,5
3. How common are obesity and
diabetes?
62% of adults were overweight or obese in England in 2012
6% of people aged 17 years or older had diagnosed diabetes in England in 2013
Prevalence of both obesity and diabetes is rising in England
90% of adults with type 2 diabetes aged 16-54 years are overweight or obese
In England, 12.4% of people aged 18 years and over with obesity have diagnosed
diabetes, five times that of people with a healthy weight
Men with a raised waist circumference are five times more likely to have diagnosed
diabetes than those without a raised waist circumference; women are over three
times more likely
National prevalence estimates
Obesity
In 2012, an estimated 62% of adults (aged 16 years and over) were overweight or
obese in England (BMI ≥25), 24.7% were obese (BMI ≥30) and 2.4% were
severely obese (BMI ≥40).6
The prevalence of obesity among adults increased sharply during the 1990s and
early 2000s. The proportion who were categorised as obese increased from 13%
of men in 1993 to 24% in 2012 and from 16% of women in 1993 to 25% in 2012.
Obesity prevalence remains higher for women, but the gap between men and
7Adult obesity and type 2 diabetes
women appears to have narrowed over time.7 Some forecasts predict that by
2050, obesity will affect 60% of adult men and 50% of adult women.8
Figure 1: Prevalence of obesity among adults Health Survey for England 1993-
2012 (3-year rolling average)
30%
Women
Men
25%
20%
Prevalence of obesity
15%
10%
5%
0%
2
Adult (aged 16+ years) obesity: BMI ≥ 30kg/m
Source: Health Survey for England, 1993-2012.
Joint Health Surveys Unit (Nat Cen Social Research & UCL) 2014. The Health and Social Care Information
Centre: Leeds.
Copyright © 2014, Re-used with the permission of The Health and Social Care Information Centre. All rights
reserved.
Diabetes
Diabetes prevalence in England is rising. In 2013, 2.7 million or 6% of the adult
population had diagnosed diabetes in England, an increase of 137,000 people
since 2012.9 Additionally, approximately a quarter of people with type 2 diabetes
have the condition but are unaware of it,10 as a result diagnosed cases understate
the true prevalence. When these undiagnosed people are taken into account it has
been estimated that the true prevalence in England is around 3.2 million or 7.4%
of the adult population.11
Because of the impact of obesity on type 2 diabetes, the rising prevalence of
obesity has led, and will continue to lead, to a rise in the prevalence of diabetes.
Figure 2 illustrates this and shows that the total number of adults with diabetes is
8Adult obesity and type 2 diabetes
projected to rise to 4.6 million or 9.5% of the adult population by 2030.c
Approximately a third of this increase is attributable to obesity, whilst the rest is
due to aging and the changing ethnic structure of the population.10
Figure 2: Adult diabetes prevalence in England 2012-2030
14%
12%
Prevalence of diabetes
10%
8%
6%
4%
2%
0%
2012 2013 2014 2015 2020 2025 2030
Year
d
Source: Yorkshire and Humber Public Health Observatory (YHPHO) Prevalence Model for local authorities
and clinical commissioning groups published November 2012 by YHPHO. Access the tool.
Note: Includes people age 16 years or older who have all types of diabetes (diagnosed and undiagnosed)
adjusted for age, sex, ethnic group and deprivation.
Obesity prevalence among adults with type 2 diabetes
National Diabetes Audit (NDA) data show that in England, 90% of adults with type
2 diabetes aged 16-54 years were overweight or obese, compared to only 10%
who were a healthy weight or underweight in 2009-10.
c
This is almost all attributable to the rise in type 2 diabetes, not type 1 diabetes which has no association with
obesity.
d
The Diabetes Prevalence Model is based on Health Survey for England (HSE) data and includes large
uncertainty limits because of small numbers. A new diabetes prevalence model is currently being worked on
using National Diabetes Audit (NDA) data to be available late 2014.
9Adult obesity and type 2 diabetes
Figure 3: Weight status among adults with type 2 diabetes, 2009-10
70%
16-54 55 years and over
60% 63.0%
50%
47.6%
40%
30%
36.0%
26.9%
20%
16.3%
10%
10.0%
0%
Healthy or underweight Overweight Obese
Source: National Diabetes Audit 2009-10
Diabetes prevalence among adults who are obese
Analysis of combined Health Survey for England (HSE) data from 2010-12 show
that 12.4% of people aged 18 years and over with obesity have diagnosed
diabetes, five times that of people of a healthy weight. (Table 1)
Table 1: Doctor diagnosed diabetes1 prevalence by weight status and gender for
adults aged 18 years and over 2010-12, England
Obese
Underweight Healthy weight Overweight
(incl severely obese)
Female 1.9% 1.9% 4.3% 10.7%
Male 0.0% 3.3% 6.0% 14.6%
Total 1.3% 2.4% 5.2% 12.4%
Source: Health Survey for England combined data 2010-12. Joint Health Surveys Unit (Nat Cen Social
Research & UCL) 2014. The Health and Social Care Information Centre: Leeds. Copyright © 2014, Re-used
with the permission of The Health and Social Care Information Centre. All rights reserved.
Excludes women who only had diabetes during pregnancy. No distinction is made between type 1 and type 2
diabetes
Men with a raised waist circumference (greater than 102cm) are five times as
likely to have doctor diagnosed diabetes, compared to those without a raised waist
10Adult obesity and type 2 diabetes
circumference, and women with a raised waist circumference (greater than 88cm)
are over three times as likely.e (Figure 4)
Figure 4: Doctor diagnosed diabetes prevalence by waist circumference (greater
than 88cm for women and greater than 102cm for men) and gender for adults
aged 18 years and over, 2009-11, England
16%
14%
12%
Prevalence of diabetes
10%
8%
6%
4%
2%
0%
Non raised waist Raised waist circumference Non raised waist Raised waist circumference
circumference circumference
Men Women
Source: Health Survey for England combined data 2009-11. Joint Health Surveys Unit (Nat Cen Social
Research & UCL) 2014. The Health and Social Care Information Centre: Leeds. Copyright © 2014, Re-used
with the permission of The Health and Social Care Information Centre. All rights reserved.
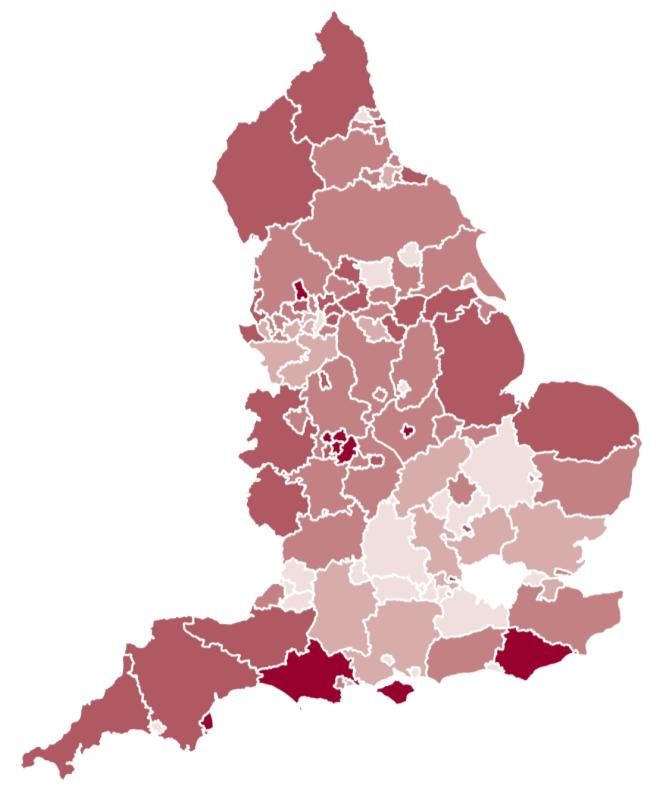
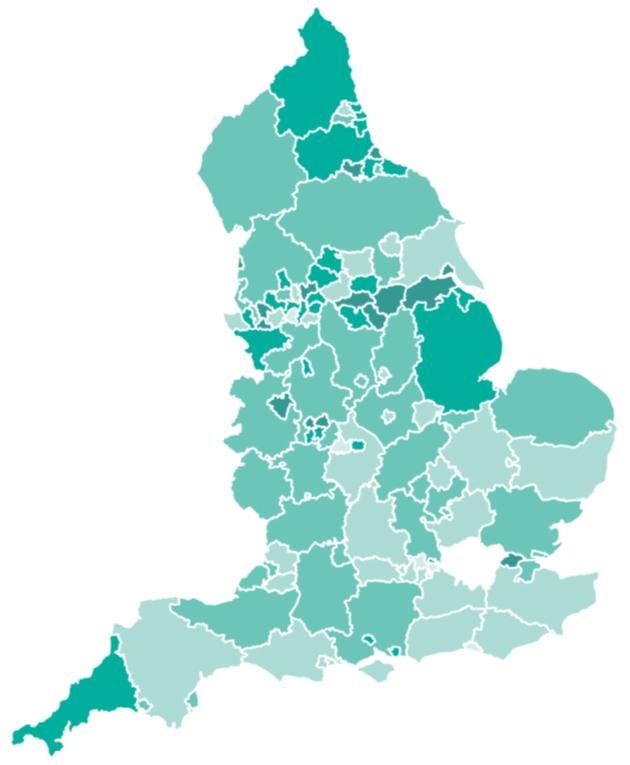
Geographical variation
The following maps provide an overview of obesity and diabetes prevalence
among adults by local authority in England.f Patterns across the country show
some similarities for the two conditions.
e
See page 13 for more information on the link between waist circumference and diabetes.
f
Local Authority level data may mask variation at lower geographical areas.
11Adult obesity and type 2 diabetes
Figure 5: Adult obesity prevalence by upper tier local authority, England, 2012
London
inset
Source: Sport England, Active People Survey http://www.noo.org.uk/visualisation
© Crown copyright and database rights 2014 Ordnance Survey 100016969
Figure 6: Modelled diagnosed and undiagnosed diabetes prevalence
by upper tier local authority, England, 2012
London
inset
Source: YHPHO Diabetes Prevalence Model. Diabetes Prevalence Model for local authorities in England 2012
© Crown copyright and database rights 2014 Ordnance Survey 100016969
12Adult obesity and type 2 diabetes
Public Health England will be publishing a diabetes Longer Lives atlas in summer
2014. It will include indicators on diabetes prevalence and risk factors including
obesity and Index of Multiple Deprivation, as well as variation in care and
outcomes of diabetes by GP practice, Clinical Commissioning Group and local
authority.
4. How are obesity and diabetes linked?
Being overweight or obese is the main modifiable risk factor for type 2 diabetes
As BMI increases, so does the risk of type 2 diabetes
People with severe obesity are particularly at risk of type 2 diabetes
Having a large waist circumference increases the likelihood of developing type 2
diabetes
BMI and waist circumference
Being overweight or obese (a BMI of 25kg/m2 or more) is the main modifiable risk
factor for type 2 diabetes.12 The risk of developing type 2 diabetes is associated
with incremental increases in body weight in early adulthood.13 In addition,
duration of obesity has also been found to increase risk of developing type 2
diabetes, with greater risk among people who have been obese for longer periods
of time.14
A recent study found that severely obese people (BMI ≥40) were at an even greater
risk of type 2 diabetes, when compared to obese people with a lower BMI (BMI 30-
39.9).15 This may have significant implications for health services given the
increasing trend of severe obesity in adults in England as illustrated in Figure 7.
13Adult obesity and type 2 diabetes
Figure 7: Trend in severe obesity among adults. Health Survey for England 1993-
2012 (3-year rolling average)
4.0%
Women
3.5%
Men
3.0%
Prevalence of severe obesity
2.5%
2.0%
1.5%
1.0%
0.5%
0.0%
2
Adult (aged 16+ years) severe obesity: BMI ≥ 40kg/m
Source: Health Survey for England 1993-12. Joint Health Surveys Unit (Nat Cen Social Research & UCL)
2014. The Health and Social Care Information Centre: Leeds. Copyright © 2014, Re-used with the permission
of The Health and Social Care Information Centre. All rights reserved.
A large waist circumference is associated with increased likelihood of developing
type 2 diabetes. Men are at higher risk of type 2 diabetes if they have a waist
circumference of 94-102cm and are at very high risk if it is more than 102cm.
Women are at higher risk if they have a waist circumference of 80-88cm and at
very high risk if it is more than 88cm.12
Linkage mechanisms
Theories of why obesity may lead to type 2 diabetes include:
abdominal obesity may cause fat cells to release pro-inflammatory chemicals.
These chemicals can make the body less sensitive to the insulin it produces by
disrupting the function of insulin responsive cells and their ability to respond to
insulin16,17
obesity may trigger changes to the body's metabolism that cause adipose (fat)
tissue to release increased amounts of fatty acids, glycerol, hormones, pro-
inflammatory cytokines and other factors that are involved in the development
of insulin resistance. When insulin resistance is accompanied by dysfunction of
pancreatic islet beta-cells (the cells that release insulin) it leads to failure to
control blood glucose levels18
14Adult obesity and type 2 diabetes
5. Risk factors for type 2 diabetes
Obesity and overweight are major risk factors for type 2 diabetes
There is a clear association between increasing age and greater diabetes
prevalence
Both obesity and type 2 diabetes are strongly associated with unhealthy diets and
physical inactivity
People from black, Asian and other minority ethnic groups are at an equivalent
risk of type 2 diabetes at lower BMI levels than white European populations
Deprivation is closely linked to the risk of type 2 diabetes
In addition to overweight and obesity, risk factors for developing type 2 diabetes
include increasing age, lifestyle factors such as physical inactivity, unhealthy diet,
a family history of type 2 diabetes and a history of gestational diabetes19 or
polycystic ovarian syndrome.20 People from some black and minority ethnic
groups and those from lower socioeconomic groups are particularly at risk. 12 The
more risk factors present, the greater a person’s chance of developing type 2
diabetes.21
Age
There is a clear association between increasing age and greater diabetes
prevalence. Less than 2% of people aged 16-34 years are estimated to have
diabetes compared to 5.1% of people aged 35-54 years, 14.3% of people aged
55-74 years and 16.5% of those aged over 75 years.22 The National Institute for
Health and Care Excellence (NICE) state that being older than 40 years, or older
than 25 years for some black and minority ethnic groups, is an important risk factor
for developing type 2 diabetes.12
Lifestyle factors
Both obesity and type 2 diabetes are strongly associated with an unhealthy diet
and physical inactivity. Physical and social environments are important influences
on diet and physical activity behavior along with interrelated economic,
psychological and cultural factors.23 Sedentary behavior is also linked to obesity
and a recent British study found that people with type 2 diabetes recorded greater
amounts of sedentary time compared with their non diabetic counterparts.24
A large US study found that adults aged 50-71 years with a low-risk lifestyle
profile, including not smoking, engaging in regular physical activity, a healthy diet,
15Adult obesity and type 2 diabetes
moderate alcohol consumption and having a healthy body weight, had a
dramatically lower risk of diabetes than those who did not have a low-risk profile.25
Results from a further US study of adults aged 65 years and older suggests that,
even later in life, the great majority of cases of diabetes are related to lifestyle
factors. 26 A recent meta-analysis found that the risk of developing type 2 diabetes
is 30-40% higher for regular smokers than for non-smokers and that there is a
positive dose-response relationship between the number of cigarettes smoked and
the risk of developing diabetes.27
Exercise plus dietary changes have been found to be effective in preventing the
onset of type 2 diabetes in high risk individuals (those with impaired glucose
tolerance or those with metabolic syndrome).g,28 The Scientific Advisory
Committee on Nutrition (SACN) published their draft report on Carbohydrates and
Health on 26 June 2014 as part of a 9-week consultation ending on 1 September
2014. The final SACN report will be published in early 2015. SACN reviewed the
evidence on a range of carbohydrates in the diet and their relationship to health,
including the risk of obesity and type 2 diabetes. As part of their draft advice,
SACN recommend that:
the population average intake of free sugarsh should be reduced to around 5%
of dietary energy to reduce risk of weight gain and consequently type 2
diabetes
consumption of sugars sweetened beverages should be minimized; there is
evidence linking sugary drinks to weight gain and increased intake of these
beverages is associated with higher risk of type 2 diabetes
under a broader definition of fibre, intake should increase to 30g per dayi
because there is evidence that greater fibre intake is associated with a reduced
risk of a range of disease outcomes, including type 2 diabetes
Ethnicity
Type 2 diabetes prevalence is strongly associated with ethnicity.29 Analysis of
HSE 2004 data found that all minority ethnic groups (with the exception of Irish)
have a higher risk of doctor-diagnosed diabetes compared to the general
population. Women of Pakistani ethnicity are over five times more likely, and those
g
Metabolic syndrome is a complex condition linked to obesity that is characterized by a cluster of closely
related clinical features, including insulin resistance, dyslipidaemia and hypertension.
h
Free sugars refers to sugars that are added to foods by the manufacturer, cook or consumer, and sugars
naturally present in honey, syrups, fruit juices and fruit concentrates.
i
This recommendation is an increase of about 6g/day compared with the current advice. Currently adults are
advised to consume 18g dietary fibre/day using the long-standing definition of fibre; this is roughly
equivalent to 24g according to the new, broader definition.
16Adult obesity and type 2 diabetes
of Bangladeshi or black Caribbean ethnicity over three times more likely, to be
diagnosed with diabetes compared to women in the general population.
Bangladeshi men are almost four times more likely, and Pakistani and Indian men
almost three times more likely to have doctor-diagnosed diabetes compared to
men in the general population.j
Type 2 diabetes affects people of South Asian, African-Caribbean, Chinese or
black African descent up to a decade or more earlier than white Europeans. 30
Recently a large scale study of Londoners revealed that by age 80 years, 40-50%
of British South Asian, African and African-Caribbean men and women had
developed diabetes, at least twice the proportion of white Europeans of the same
age.31
The difference in prevalence of type 2 diabetes across ethnic groups is due to a
complex and unresolved interplay of genetic susceptibility and environmental
factors.32 Evidence suggests that compared to white European populations,
people from black, Asian and other minority ethnic groups are at higher risk of type
2 diabetes, other health conditions or mortality at equivalent BMI levels. NICE
recommends using lower thresholds as a trigger to intervene to prevent ill health
among these groups (23kg/m2 BMI to indicate increased risk and 27.5kg/m2 BMI to
indicate high risk.) k,33 A recent UK study found that non-white adults aged 40-69
years were two to four times more likely to have diabetes compared to white
adults. Diabetes prevalence in South Asian groups with a BMI of 22kg/m2 was
equivalent to diabetes prevalence in white groups with a BMI of 30kg/m2.34
The higher risk for South Asian people living in England is at least partly due to the
fact that they may accumulate significantly more 'metabolically active' fat l in the
abdomen and around the waist than white European populations. This is also the
case for those with a BMI in the ‘healthy’ range from 18.5-24.9kg/m2.12
Deprivation
In England, type 2 diabetes is 40% more common among people in the most
deprived quintile compared with those in least deprived quintile.m,29 People in
social class V (unskilled manual) are three and a half times more likely to be ill as
a result of diabetic complications than those in social class I (professional)35 and
short term mortality risk from type 2 diabetes is higher among those living in more
deprived areas in England.36
j
If revised thresholds were used, these estimates would be greatly increased.
k
See appendix for further details.
l
'Metabolically active' fat is closely associated with insulin resistance, pre-diabetes and type 2 diabetes.
m
Social deprivation was assigned using Indices of Multiple Deprivation (IMD) 2007.
17Adult obesity and type 2 diabetes
Deprivation is associated with obesity, physical inactivity, unhealthy diet, smoking
and poor blood pressure control.23 All these factors are inextricably linked to the
risk of diabetes or the risk of serious complications for those already diagnosed. 37
6. What are the health implications of
diabetes?
People with diabetes are at risk of a range of health complications including
cardiovascular disease, blindness, amputation, kidney disease and depression
Diabetes leads to a two-fold excess risk for cardiovascular disease
Diabetic retinopathy is the leading cause of preventable sight loss in people of
working age in England and Wales
Up to 100 people a week have a limb amputated in the UK as a result of diabetes
Depression is nearly twice as high among people with type 2 diabetes than in
those without the condition
In England and Wales, diabetes is a major cause of mortality with over 23,300
additional deaths in 2010-11
Ninety percent of people with type 2 diabetes are overweight or obese and people
with diabetes are at risk of a range of health complications. Uncontrolled diabetes
is associated with cardiovascular disease (CVD), blindness, amputation, kidney
disease and depression. It can also result in lower life expectancy. Life-long
diabetes can also have a profound impact on lifestyle, relationships, work, income,
and health and wellbeing.38
Analysis of the National Diabetes Audit (NDA) 2011-12 shows that people with
diabetes in England are significantly more likely to experience myocardial
infarction, angina, heart failure, stroke and to have renal replacement therapy or a
lower limb amputation than the general population. (Table 2)
18Adult obesity and type 2 diabetes
Table 2: Increased risk of diabetic complications in people with diabetes
compared to the general population in England
Additional risk of
Diabetic complication complication among
people with diabetes
Angina + 76%
Myocardial Infarction (heart attack) + 55%
Heart failure + 74%
Stroke + 34%
Renal Replacement Therapy (ESKD) + 164%
Minor Amputation (below the ankle) + 337%
Major Amputation (above the ankle) + 222%
Source: National Diabetes Audit 2011-12. Report 2: Complications and Mortality
Note: The calculations compare the prevalence for people with diabetes with the prevalence in the general
population in the same Clinical Commissioning Group or Local Health Board during the period from 1 April
2010 to 31 March 2012, using the HES and PEDW records. Diabetic ketoacidosis (DKA) and retinopathy
treatments are not included as these only affect people with diabetes.
However, whilst the additional risk of amputation and renal replacement therapy is
higher than that of heart disease, many more people with diabetes have heart
disease. (Table 3)
Table 3: Two year prevalence* of diabetic complications for England and Wales in
2010-12
Number of people with
Complication diabetes
experiencing the complication
Angina 117,278
Myocardial Infarction (heart attack) 28,812
Heart failure 81,452
Stroke 35,120
Renal Replacement Therapy (ESKD) 15,415
Minor Amputation (below the ankle) 5,869
Major Amputation (above the ankle) 3,319
*
Two year prevalence is the number of people with one or more complication event during the two years
following the audit period (from 1 April 2010 to 31 March 2012).
Source: National Diabetes Audit 2011-12. Report 2: Complications and Mortality
Cardiovascular Disease (CVD)
A meta-analysis by the Emerging Risk Factors Collaboration found that diabetes
leads to a two-fold excess risk of CVD, (heart attack, heart failure, angina, stroke)
independent from other risk factors.39 National Diabetes Audit data show that
people from South Asian ethnic groups are at greater risk of CVD compared to
19Adult obesity and type 2 diabetes
those from white ethnic groups and people living in the most deprived quintile are
over 50% more likely to experience cardiovascular complications compared with
those living in the least deprived quintile. People with diabetes with a very high
BMI (35+kg/m2) are over twice as likely as those with a lower BMI to have a
hospital admission with heart failure in England.36
The National Cardiovascular Health Intelligence Network has recently produced a
series of factsheets. These include information on cardiovascular risk factors and
diabetes for commissioners and health and social care professionals.11
Blindness
Diabetic retinopathy is the leading cause of preventable sight loss in the working
age population of England and Wales.40 It occurs as a result of damage to the
small blood vessels in the retina caused by prolonged exposure to high blood
glucose levels. Longer diabetes duration and poorer glycemic and blood pressure
control are strongly associated with diabetic retinopathy.41
Evidence of the association between diabetic retinopathy and obesity is
inconclusive. Some studies suggest that obesity may be an independent risk factor
for diabetic retinopathy and that people with diabetes with higher BMI are more
likely to have diabetic retinopathy and more severe stages of diabetic
retinopathy.42,43 Others have concluded that higher BMI is associated with lower
diabetic retinopathy prevalence.44 This mixed evidence is likely to result from
methodological differences between studies and the fact that the relationship
between the two conditions is complex and associated with multiple risk factors.
Amputation
In England, people with diabetes are twenty times more likely to undergo a lower
extremity amputation compared with people without diabetes.45 Up to 100 people a
week have a limb amputated in the UK as a result of diabetes, and in many cases
this is avoidable.46 Men are over two times more likely to have a diabetes-related
amputation than women and older people are at increased risk (1% increased risk
per additional year of age). People from white ethnic groups are more likely to
have had a major amputation than those from black and south Asian ethnic
groups. Deprivation increases the risk of major amputation, with those living in the
most deprived quintile over 80% more likely to have had an amputation than those
in the least deprived quintile.36
20Adult obesity and type 2 diabetes
Chronic kidney disease
Obesity and type 2 diabetes contribute to the development and progression of
chronic kidney disease (CKDn) and end stage renal disease.47 Type 2 diabetes is
a leading cause of end stage kidney disease; obesity may also increase the risk of
kidney disease independent of type 2 diabetes.48
Depression
Nearly one in five people with diabetes have clinical depression.49 A recent
systematic review found that depression was nearly twice as high in people with
type 2 diabetes compared to those without the condition (19.1% compared to
10.7%), with higher rates among women than men.50 However there is currently
insufficient evidence to suggest a causal relationship between depression and
diabetes.51
Mortality
In England, diabetes is a major cause of mortality with around 23,300 additional
deaths in 2011-12.36 On average at age 50 years, the life expectancy of people
with diabetes is six years less than for people without diabetes.52
Whilst type 2 diabetes is associated with an additional risk of death at all ages and
in both sexes, the relative risk (by comparison to the general population) is
greatest at younger ages and in women. Deprivation also increases the risk of
mortality among people with type 2 diabetes, with those from the most deprived
quintile 35% more likely to die than those in the least deprived quintile.36
Evidence on how overweight and obesity affect mortality in people with diabetes is
unclear. A large-scale longitudinal study of people diagnosed with diabetes found
that BMI was associated with risk of death, with healthy-weight participants at
lowest risk.53 In addition, a pooled analysis of prospective cohort studies revealed
that people aged 35-59 years with severe obesity (BMI of 40-50kg/m2) were 22.5
times more likely to die from diabetes than those with BMI between 22.5-
25kg/m2.54 However National Diabetes Audit data suggest that a BMI of 25kg/m2
and over is associated with lower mortality in people with type 2 diabetes
compared to those of a healthy weight.36
n
CKD is a long-term complication of diabetes. CKD has five stages or levels of damage and reduced kidney
function. CKD5 (Kidney failure or End Stage Renal Failure, ESRF) will cause death without Renal
Replacement Therapy (RRT – dialysis or transplantation).
21Adult obesity and type 2 diabetes
7. What are the cost implications of
obesity and diabetes?
It is estimated that overweight, obesity and related morbidity will cost the NHS £9.7
billion by 2050 with wider costs to society estimated to reach £49.9 billion
Prescribing for diabetes accounted for 9.3% of the total cost of prescribing in
England in 2012-13
It is estimated that in 2010-11 the cost of direct patient care for those living with
type 2 diabetes in the UK was £8.8 billion and the indirect costs were approximately
£13 billion
The number of NHS-commissioned bariatric surgery procedures performed for the
management of obesity is increasing rapidly in England
In the UK, it is estimated that overweight, obesity and related morbidity cost the
NHS £4.2 billion in 2007 and these costs are predicted to reach £9.7 billion by
2050. Wider total costs to society (such as loss of productivity) of overweight and
obesity are estimated to reach £49.9 billion by 2050.8 Recent analysis of the
Million Women Studyo found that among women aged 50-84 years in England,
around one in eight hospital admissions were attributable to overweight or
obesity.55
The National Audit Office (NAO) reported that NHS expenditure on diabetes
services in 2009-10 was at least £3.9 billion.56 A recent economic study estimated
that in 2010-11 the cost of treating type 2 diabetes and its associated
complications in the UK was £8.8 billion and the indirect costs (such as loss of
productivity due to increased death and illness and the need for informal care)
were £13 billion. Modelled projections show that these costs could rise
dramatically in the next few decades.57 It has been estimated that the total cost of
caring for people with diabetes in adult social care settings in England is £830
million per year.58 It is likely that a substantial proportion of these social care costs
are associated with excess weight.
The following section provides information on lifestyle interventions, prescribing
and surgical interventions for type 2 diabetes and obesity and their associated
costs.
o
The Million Women Study is a national study of women’s health, involving more than one million UK women
aged 50 years and over. It is a collaborative project between Cancer Research UK and the National Health
Service, with additional funding from the Medical Research Council and the Health and Safety Exective.
22Adult obesity and type 2 diabetes
Lifestyle interventions
Intensive lifestyle interventions have been found to delay or prevent progression
from impaired glucose tolerance to type 2 diabetes59,60 with evidence of long-term
cost savings in the US.61 In 2012, NICE produced a costing model associated with
offering intensive lifestyle change programmes to people aged 40-74 years who
are at highest risk of developing type 2 diabetes and also risk assessments, blood
testing and interventions to people of South Asian or Chinese descent aged 25-39
years. They estimate that in England, the total cost of intensive lifestyle-change
programmes is £170 million over five years, with savings of £13 million over the
same period. Local costing templates have been produced to enable organisations
to estimate local impact on implementing these interventions. 30
Prescribing for diabetes
Type 2 diabetes can often be managed initially with lifestyle changes and oral
glucose-lowering drugs. Metforminp is the most commonly prescribed antidiabetic
drug in England. NICE recommends starting metformin treatment in a person who
is overweight or obese (tailoring the assessment of body-weight-associated risk
according to ethnic group) and whose blood glucose is inadequately controlled by
lifestyle interventions (nutrition and exercise) alone.62 Metformin accounts for the
greatest number of items prescribed for diabetes in England, with a growth of 97%
between 2005-06 and 2012-13 and an increase in the Net Ingredient Cost (NIC)q
rising from £37.1 million to £70.5 million during this period.63
Over time, many people with type 2 diabetes require insulin therapy to maintain
adequate glucose control. Weight gain is a common adverse effect of insulin
therapy with average increases in body weight between 2kg and 4kg.63 In 2012-13
the NIC of insulin items prescribed in England was £320 million, an increase of
£100 million since 2005-06.63 Between 1991 and 2010 there was a seven-fold
increase in the number of people with type 2 diabetes using insulin in the UK. This
rise is likely to reflect the increasing incidence, longer survival and changes in the
management of type 2 diabetes.64
In 2012-13 total prescribing for all types of diabetes (as defined in British National
Formulary 6.1) accounted for 9.3% of the total cost of prescribing in England.
Between 2005-06 and 2012-13, the total NIC for diabetes prescribing increased by
48.7% (£250.2 million) to £764.1 million, compared with a growth of 6.6% for all
prescribing over the same period.
p
Metformin is a diabetes drug known as a biguanide. It reduces the amount of glucose produced by the liver
and kidneys and makes cells in the body take up glucose more effectively from the blood.
q
The Net Ingredient Cost (NIC) is the basic cost of the drug, not taking into account discounts, dispensing
costs, fees or prescription charges income.
23Adult obesity and type 2 diabetes
Figure 8: Net Ingredient Cost (NIC) for drugs used to treat diabetes (BNF 6.1),*
2005-06 to 2012-13
£800
£700 £760.3 £764.1
£725.1
£600 £649.2
£590.7 £599.3
NIC (millions)
£500 £572.4
£513.9
£400
£300
£200
£100
£0
2005/6 2006/7 2007/8 2008/9 2009/10 2010/11 2011/12 2012/13
Financial year
Source: ePACT, Health and Social Care Information Centre, Prescribing for Diabetes, England 2005-06 to
2012-13
*Includes insulin and drugs to help control blood sugar levels
Bariatric surgeryr
A recent systematic review and meta-analysis found that bariatric surgery leads to
greater weight loss and higher remission rates of type 2 diabetes and greater
reductions in use of antidiabetic, antihypertensive and lipid lowering drugs
compared with non-surgical treatment for obesity. However, results were limited to
two years of follow-up and based on a small number of studies and individuals.65
A further systematic review concluded that bariatric surgical procedures in people
with diabetes and a BMI of 30-35 were associated with greater short-term weight
loss and better intermediate glucose outcomes compared to nonsurgical
treatments, although evidence on long-term outcomes was lacking.66 NICE is
currently consulting on its guideline on the identification, assessment and
management of overweight and obesity. It includes draft recommendations on
bariatric surgery for people with recent onset type 2 diabetes and is due to be
published in November 2014.
The number of NHS-commissioned bariatric surgery procedures performed for the
management of obesity is increasing rapidly in England. Between 2000/01 and
r
Bariatric surgery is a term that describes a group of procedures performed to facilitate weight loss. It
includes gastric banding, gastric bypasses and sleeve gastrectomy. NICE guidance supports the use of
2 2
bariatric surgery as a treatment option for adults with a BMI of 40kg/m or more, or between 35kg/m and
2
40kg/m and other significant disease (such as type 2 diabetes) that could be improved if they lost weight.
The patient must also fulfill a number of additional criteria.
24Adult obesity and type 2 diabetes
2005/06 there was a year on year increase in the number of hospital episodes
involving bariatric surgery, from 261 to 1,038. In 2011-12 this had risen to 8,794
hospital episodes, with women accounting for the majority of these (6,711
compared to 2,081 in men).s,67
Figure 9: Number of hospital episodes for bariatric surgery in England by sex,
2000/01 to 2011/12*
7000
Male Female
6711
6315
6000
5762
5000
Number of episodes
4000
3251
3000
2000
2126
2081
1771
1562
1450
1000
381
378
969
280
241
215
200
808
137
603
598
96
65
46
38
0
OPCS 2000/01 2001/02 2002/03 2003/04 2004/05 2005/06 2006/07 2007/08 2008/09 2009/10 2010/11 2011/12
Procedure 4.2 4.3, 4.4 and 4.5 4.6
codes:
Source: Health and Social Care Information Centre. Statistics on Obesity, Physical Activity and Diet: England,
2013
*Results based on the old OPCS procedure codes coding cannot be compared with results based on the
revised systems
Economic assessment of adult weight managementt interventions
PHE has developed a tool to support public health professionals to understand the
economic case for investing in weight management interventions. The tool is
intended primarily to be used by local commissioners who wish to estimate the
cost effectiveness of existing or planned interventions to inform commissioning
decisions. It assesses potential reductions in healthcare costs as a result of
reduced BMI from interventions, allowing comparison with the costs incurred. The
tool provides results broken down by condition, so it is possible to use it to
determine what savings in terms of diabetes treatment will result from a drop in the
BMI of a given population. In most situations the tool seems to suggest that the
s
This increase is likely to be partly due to changes in surgical practice rather than simply as a result of
increasing obesity.
t
The term weight management is broadly interpreted to include not just traditional weight management
programmes, but also policy actions, environmental change, educational programmes or any other public
health action leading to measured change in weight among a defined population.
25Adult obesity and type 2 diabetes
biggest savings will result from preventing cases of diabetes rather than other
diseases, although the relative proportion of savings by disease does vary
depending on factors such as the age of the population, their starting BMI and how
much weight loss is achieved.
8. Conclusion
Obesity and type 2 diabetes both present significant public health challenges. The
link between the two conditions is important because obesity substantially
increases the risk of type 2 diabetes. Type 2 diabetes is a major cause of
premature mortality and contributes to a range of long-term health conditions
including cardiovascular disease and microvasular complications including eye
disease, foot disease and chronic kidney disease. People living in deprived areas
and some minority ethnic groups are at particularly high risk of developing type 2
diabetes. The prevalence of both obesity and type 2 diabetes continue to rise in
England, along with associated direct patient care costs and wider costs to
society.
The purpose of this paper is to describe the relationship between obesity and type
2 diabetes and not to review treatment options. The latest public health and clinical
guidelines on preventing and treating type 2 diabetes and obesity are included in
the appendix, along with useful resources to help improve local services.
9. Appendix
1. National guidelines
The 2012 NICE public health guidance Preventing type 2 diabetes: risk
identification and interventions for individuals at high risk, recommends that GPs
and other primary healthcare professionals use the diabetes risk score
assessment tool for identifying people at risk of developing type 2 diabetes.
NICE has produced a series of guidance documents related to diabetes prevention
and treatment. In 2011 NICE published a quality standard for the clinical
management of diabetes in adults which requires services to be commissioned
from and coordinated across all relevant agencies encompassing the whole
diabetes care pathway. It supports the Department of Health’s National Service
Framework for Diabetes and promotes an integrated approach to provision of
services and locally agreed pathways of care. NICE have also published guidance
26Adult obesity and type 2 diabetes
on preventing type 2 diabetes in the general population and among high-risk
groups aimed at directors of public health, public health commissioners and all
those working in national and local public health services. The guidance is
underpinned by previous NICE recommendations on supporting behaviour
change, achieving and maintaining a healthy weight, effective weight-loss
programmes, physical activity and cultural appropriateness. Further guidance on
risk identification and interventions for individuals at high risk has also been
produced.
NICE clinical guidance on the prevention, identification, assessment and
management of overweight and obesity in adults and children was published in
2006.
The easiest way to navigate these and other guidance documents is via the two
interactive pathways for obesity and diabetes:
Figure 10: NICE Obesity pathway
National Institute for Health and Care Excellence (2014) NICE Obesity pathway. Manchester: NICE. Available
from http://pathways.nice.org.uk/pathways/obesity Reproduced with permission.
27Adult obesity and type 2 diabetes
Figure 11: Diabetes pathway
National Institute for Health and Care Excellence (2014) NICE Diabetes pathway. Manchester: NICE.
Available from https://pathways.nice.org.uk/pathways/diabetes Reproduced with permission.
Prevention and management of diabetes
The following diagram summarises the National Service Framework (NSF) for
Diabetes pathway for the prevention and management of diabetes. It depicts
prevention through to continuing care, specific events and complications.
Figure 12: Diabetes pathway for the prevention and management of diabetes
Source: National Service Framework for Diabetes, 2001
28Adult obesity and type 2 diabetes
2. Mandatory data collection
Public Health Outcomes Framework (PHOF)
From April 2013, local authorities have been paid a health premium for the
progress they make against indicators set out in the Public Health Outcomes
Framework for England, 2013-2016. Domain 2 (health improvement) includes
indicators on excess weight, diabetes, diet and physical activity among adults.
Quality and Outcomes Framework (QOF)
The Quality and Outcomes Framework (QOF) is a voluntary annual reward and
incentive programme for all GP practices in England. Current QOF prevalence
figures are not age adjusted, are reliant on practice compliance, and do not
capture non registered or non-attending patients.
The QOF 2012-13 clinical register on obesity is based on patients aged 16 years
and over with a BMI greater or equal to 30 recorded in the previous 15 months.
The clinical register on diabetes is based on patients aged 17 years and over with
confirmed diabetes and diabetes type. It includes a range of indicators for the
ongoing management of diabetes and includes the percentage of patients with
diabetes whose notes record BMI in the preceding 15 months.
NICE is currently consulting on a ‘bundled’ QOF indicator on diabetes for 2015-16,
which would see practices being required to complete a series of eight annual
checks (including BMI measurement) before they are awarded points.
3. Useful resources
A number of resources have been produced to help improve local services. For
example, the DH Health Inequalities National Support Team (HINST) developed a
workbook on the Assessment of Services to Reduce Diabetes-related Mortality
which provides advice on achieving best outcomes at population level as well as
changes that could be introduced locally. Implementing local diabetes networks by
NHS Diabetes and Diabetes UK provides advice for diabetes commissioners on
how to create establishing a local diabetes network in their area.
The Royal College of Nursing’s Diabetes resource signposts key sources of
information for diabetes care.
National service frameworks
Department of Health 2003 Diabetes Information Strategy
Royal College of Nursing 2003 An RCN guide to the National Service Framework for
Diabetes
Department of Health 2002 National Service Framework for diabetes: Delivery strategy
Department of Health 2001 National Service Framework for Diabetes
29Adult obesity and type 2 diabetes
National clinical guidelines and standards
NICE 2014 Local government briefing: Body mass index thresholds for intervening to prevent ill health
among black, Asian and other minority ethnic groups
NICE 2013 PH46: BMI and waist circumference – black, Asian and minority ethnic groups
NICE 2013 PH44: Physical activity: brief advice for adults in primary care
NICE 2013 Local government briefing: Preventing obesity and helping people to manage their weight
NICE 2012 PH38: Preventing type 2 diabetes: risk identification and interventions for individuals at
high risk
NICE 2012 PH42: Obesity: working with local communities
NICE 2012 Public health briefings for local government: physical activity and workplace health
behaviour change and walking and cycling
NICE 2012 Walking and cycling: local measures to promote walking and cycling as forms of travel or
recreation
NICE 2011 Diabetes in adults quality standard (QS6)
NICE 2011 PH35: Preventing type 2 diabetes – population and community interventions: guidance
NICE 2009 CG87 Type 2 Diabetes: The management of type 2 diabetes (Partial update of CG66).
NICE 2008 CG66: Type 2 diabetes: The management of type 2 diabetes
NICE 2006 CG43: Obesity: Guidance on the prevention, identification, assessment and management
of overweight and obesity in adults and children
NICE 2004 CG15: Type 1 diabetes: Diagnosis and management of type 1 diabetes in children, young
people and adults
Other resources
SACN 2014 Carbohydrates and Health
NHS England 2014 Action for diabetes
Diabetes UK 2014 State of the nation 2013
National Cardiovascular Intelligence 2014 Strategic clinical network profiles: diabetes
Network (NCVIN)
Academy of Royal Medical Colleges 2013 Measuring up
Diabetes UK 2013 State of the nation
Health and Social Care Information 2013 Prescribing for diabetes in England: 2005-06 to 2012-13
Centre
Royal College of Physicians 2013 Action on obesity: Comprehensive care for all
National Diabetes Information 2013 Comprehensive range of diabetes data, tools and
Service (now part of NCVIN) information via one web portal
Diabetes UK 2012 The NHS Health Check Programme – Let's Get It Right
Diabetes UK 2012 Position statement: Early identification of people with
Type 2 diabetes
Diabetes UK 2012 Position statement: Prevention of Type 2 diabetes:
reducing risk factors
House of Commons Public Accounts 2012 Seventeenth report: Department of Health: The
Committee management of adult diabetes services in the NHS
NHS Diabetes and Diabetes UK 2012 Implementing local diabetes networks
Atlas of Variation in Healthcare for 2012 http://www.rightcare.nhs.uk/index.php/atlas/diabetes/
People with Diabetes
Association of British Clinical 2011 Position statement: physical activity and exercise in
Diabetologists diabetes
Department of Health 2011 Health Inequalities National Support Team. Assessment
of Services to Reduce Diabetes-related Mortality
Diabetes UK 2011 Evidence-based nutrition guidelines for the prevention
and management of diabetes
International Diabetes Federation 2011 Bariatric surgery: an IDF statement for obese Type 2
Taskforce on Epidemiology and diabetes
Prevention of Diabetes
30Adult obesity and type 2 diabetes
NHS Diabetes 2011 Commissioning Diabetes Prevention and Risk
Assessment Services
SACN 2011 SACN Dietary Recommendations for Energy report
NHS Diabetes 2010-11 Diabetes commissioning guides
Scottish Intercollegiate Guidelines 2010 Management of obesity: (SIGN Guideline number 115)
Network
Scottish Intercollegiate Guidelines 2010 Management of diabetes (SIGN Guideline number 116)
Network
NICE 2010 NICE public health guidance: Weight management
before, during and after pregnancy. Dietary
interventions and physical activity interventions for
weight management before, during and after pregnancy
NICE 2008 NICE Physical activity and environment: guide to
resources
NICE 2008 NICE public health guidance: Physical activity and the
environment
Department of Health and Diabetes 2006 Care Planning in Diabetes
UK Care Planning Working Group
NICE 2006 NICE public health guidance: Physical activity: Four
commonly used methods to increase physical activity:
brief interventions in primary care, exercise referral
schemes, pedometers and community-based exercise
programmes for walking and cycling
4. Measures of obesity
Body mass index (BMI)
The most common measure of weight status is BMI, defined as weight in
kilograms divided by the square of height in metres. Conventional adult BMI
classifications relating to excess weight are ‘overweight’ (25.0-29.9kg/m²) and
‘obese’ (30.0kg/m² and above). These thresholds were originally derived primarily
for European populations to correspond to risk thresholds for a wide range of
chronic diseases and mortality. BMI is not a direct measure of body fat mass or
distribution, and BMI measures may be skewed by very high muscle mass.
It is now generally accepted that people from black, Asian and other minority
ethnic groups are at greater risk of type 2 diabetes and other health conditions at
lower BMI levels than white European populations. NICE recommends using lower
thresholds (23kg/m² to indicate increased risk and 27.5kg/m² to indicate high risk)
for BMI to trigger action to prevent type 2 diabetes among Asian (South Asian and
Chinese) and the extending of these thresholds to black African and African-
Caribbean populations.33
Waist circumference (WC)
WC is a measure of the accumulation of body fat around the waist (central or
abdominal adiposity) and may present a greater risk to health than fat deposited in
other parts of the body. High levels of central adiposity in adults is known to be
associated with increased risk of obesity-related conditions including type 2
31Adult obesity and type 2 diabetes
diabetes, hypertension and heart disease. Although measures of central adiposity
are closely correlated with BMI, they have been shown to predict future ill health
independently of BMI.68 Current WC thresholds for increased risk of obesity-
related health problems among white populations are 94cm or more in men, and
80cm or more in women. The equivalent thresholds for greatly increased risk are
102 cm for men and 88cm for women.69
There is evidence that people of South Asian origin have a more centralised
distribution of body fat without necessarily developing generalised obesity and
show raised obesity-related risk at lower waist circumference levels.70,71 The
International Diabetes Federation and South Asian Health Foundation are in
agreement that the healthy WC threshold for men from South Asian and Chinese
ethnic groups should be reduced from 94cm to 90cm, to indicate increased risk.
No change from 80cm has been recommended for women.72
A recent literature review concluded that optimal WC threshold values vary across
different ethnicities and there is no universal optimal value that can be applied
worldwide, although country or region-specific threshold values could be
considered.73 As there are no globally applicable WC thresholds as yet, NICE
does not recommend separate WC thresholds for different ethnic groups in the
UK.74
5. Data sources
Diabetes Prevalence Model for local authorities in England
The Diabetes Prevalence Model for local authorities in England, developed
by YHPHO, provides modelled estimates of diabetes prevalence by local authority.
It updates the Diabetes Prevalence Model (APHO) to reflect the prevalence of
diabetes (diagnosed and undiagnosed) and the distribution of BMI found in the
2010 Health Survey for England. Calculations have been included to show the
potential impact of the increasing prevalence of overweight and obesity on
diabetes prevalence.
National Diabetes Audit (NDA)
The NDA is the largest annual clinical audit in the world, integrating data from both
primary and secondary care sources in England and Wales. The NDA is
commissioned by the Healthcare Quality Improvement Partnership (HQIP) as part
of the National Clinical Audit and Patient Outcomes Programme (NCAPOP), and
delivered by the Health and Social Care Information Centre, working with Diabetes
UK. See http://www.hscic.gov.uk/nda
32You can also read


