Adults: Media use and attitudes report 2019 - Making sense of media Gwneud synnwyr 'r cyfryngau - Ofcom
←
→
Page content transcription
If your browser does not render page correctly, please read the page content below

Adults:
     Media use and attitudes report
                               2019

Making
sense
of media

Gwneud
synnwyr ’r
cyfryngau
                          Published 30 May 2019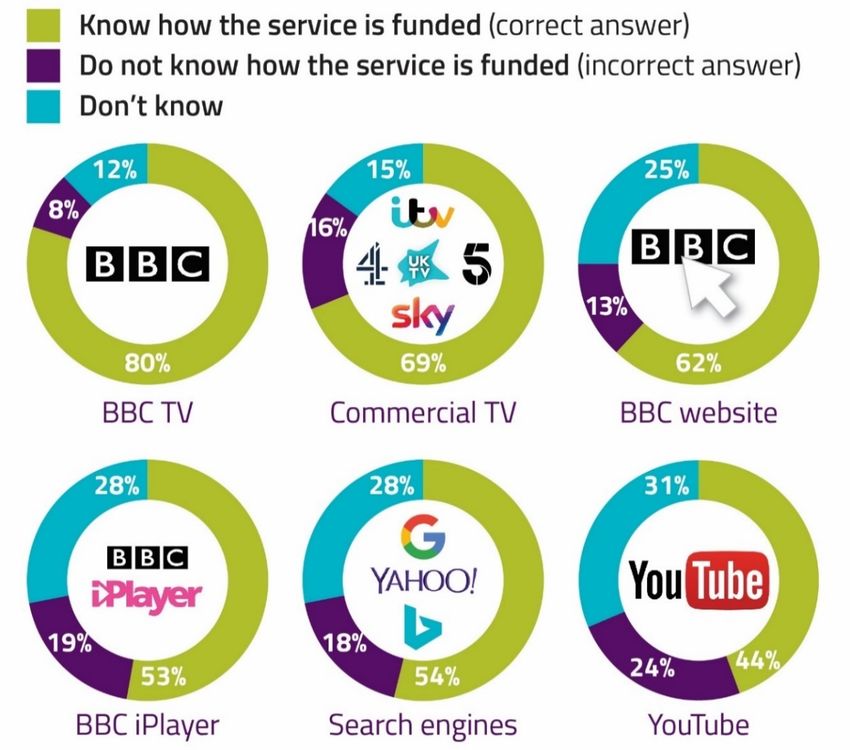
Overview
This report examines adults’ media literacy. Ofcom’s definition of media literacy is ‘the ability to use,
understand and create media and communications in a variety of contexts’. The report is a reference
document for industry, stakeholders and the general public.

The Communications Act 2003 places a responsibility on Ofcom to promote, and to carry out
research in, media literacy. This report supports our work in this area.

Drawing largely on our quantitative Adults’ Media Literacy Tracker, the report provides evidence on
media use, attitudes and understanding, and how these change over time, among UK adults aged 16
and over. The report also includes a particular focus on those groups who tend not to participate
digitally.

This report also draws on our qualitative Adults’ Media Lives research 1 and quantitative Technology
Tracker to provide an over-arching narrative on the key themes of adults’ media experience in 2018.
More detail can be found in the accompanying chart pack and interactive tool.

Key findings:
•   Mobile phones are increasingly integral to everyday life and half of adults now say, of all
    devices, they would miss their mobile phone the most.

•   One in three adults never use a computer to go online and one in ten only use a smartphone,
    an increase since 2017.

•   Video-on-demand and streamed content is becoming a central part of adults’ viewing
    landscape.

•   Social media users are less likely than in 2017 to see views they disagree with on social media.

•   Compared to 2017, internet users are more likely to have encountered hateful content online,
    however most didn’t do anything about it.

•   Although most internet users are aware of at least one of the ways in which their personal
    data might be collected online, less than four in ten are aware of all the ways we asked about.

•   There has been little change in critical awareness in the past few years, with many still lacking
    the critical skills needed to identify when they are being advertised to online.

1
  Our Adults’ Media Lives research is a qualitative, longitudinal ethnographic video-based project which has
been running since 2005. The research has followed the same (as far as possible) 19 participants over time,
interviewing them at home to understand their relationship with digital media.

                                                          1
•   One in ten internet users say they don’t think about the truthfulness of online content,
    although those who do are more likely than in 2017 to make checks to verify the information.

•   Thirteen percent of UK adults do not use the internet, unchanged since 2014; those aged 55
    and over and in the DE socio-economic group remain less likely to be online.

•   One in seven adults of working age in DE households do not go online, and when they do, one
    in five only go online via a smartphone.

Media Lives, by age: a snapshot
16-24s:                                              35-44s:

99% use a mobile phone                               100% use a mobile phone

12% only use a smartphone                            9% only use a smartphone to
to go online                                         go online

79% watch on-demand or streamed content              75% watch on-demand or
                                                     streamed content
93% have a social media profile
                                                     84% have a social media profile
47% correctly identify advertising on Google
(among search engine users)                          45% correctly identify advertising on Google
                                                     (among search engine users)
85% are aware of at least one way companies
can collect personal data online (among              82% are aware of at least one way companies
internet users)                                      can collect personal data online (among
                                                     internet users)
1% do not use the internet
                                                     4% do not use the internet

25-34s:                                              45-54s:
99% use a mobile phone                               98% use a mobile phone
22% only use a smartphone                            11% only use a smartphone to
to go online                                         go online
71% watch on-demand or streamed content              69% watch on-demand or streamed content
91% have a social media profile                      76% have a social media profile
52% correctly identify advertising on Google         46% correctly identify advertising on Google
(among search engine users)                          (among search engine users)
86% are aware of at least one way companies          84% are aware of at least one way companies
can collect personal data online (among              can collect personal data online (among
internet users)                                      internet users)
1% do not use the internet                           7% do not use the internet

                                                    2
55-64s:                                        75+:
96% use a mobile phone                         81% use a mobile phone
9% only use a smartphone                       1% only use a smartphone to
to go online                                   go online
43% watch on-demand or                         22% watch on-demand or
streamed content                               streamed content
58% have a social media profile                20% have a social media profile
48% correctly identify advertising on Google   46% correctly identify advertising on Google
(among search engine users)                    (among search engine users)
81% are aware of at least one way companies    63% are aware of at least one way companies
can collect personal data online (among        can collect personal data online (among
internet users)                                internet users)
19% do not use the internet                    48% do not use the internet

65-74s:
92% use a mobile phone
3% only use a smartphone
to go online
34% watch on-demand or streamed content
34% have a social media profile
52% correctly identify advertising on Google
(among search engine users)
72% are aware of at least one way companies
can collect personal data online (among
internet users)
33% do not use the internet

                                               3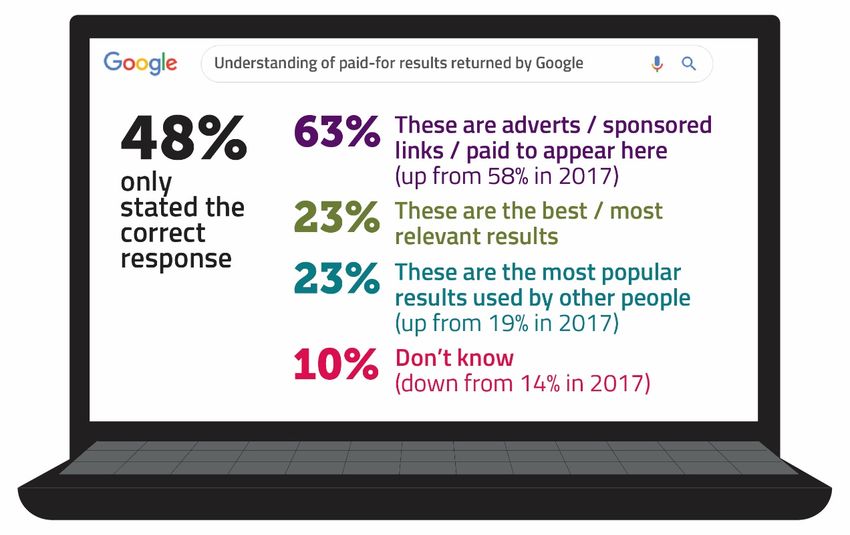
Media Lives, by socio-economic group: a snapshot
AB:                                            C2:
97% use a mobile phone                         95% use a mobile phone
4% only use a smartphone to                    16% only use a smartphone to
go online                                      go online
73% watch on-demand or streamed content        59% watch on-demand or streamed content
74% have a social media profile                69% have a social media profile
57% correctly identify advertising on Google   50% correctly identify advertising on Google
(among search engine users)                    (among search engine users)
87% are aware of at least one way companies    80% are aware of at least one way companies
can collect personal data online (among        can collect personal data online (among
internet users)                                internet users)
6% do not use the internet                     15% do not use the internet

C1:                                            DE:
98% use a mobile phone                         93% use a mobile phone
7% only use a smartphone to                    17% only use a smartphone
go online                                      to go online
61% watch on-demand or streamed content        46% watch on-demand or streamed content
79% have a social media profile                56% have a social media profile
47% correctly identify advertising on Google   37% correctly identify advertising on Google
(among search engine users)                    (among search engine users)
85% are aware of at least one way companies    73% are aware of at least one way companies
can collect personal data online (among        can collect personal data online (among
internet users)                                internet users)
8% do not use the internet                     23% do not use the internet

                                               4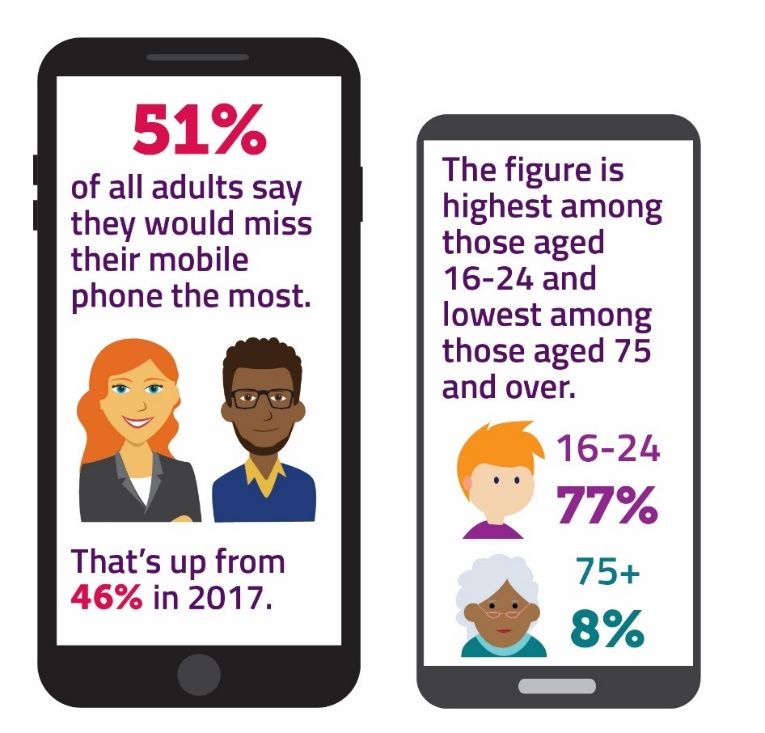
Summary of
                                                       key findings

Changing online habits                            Proportion of adults who say their mobile is
                                                  the device they would miss the most
Mobile phones are increasingly integral
to everyday life and half of adults now
say, of all devices, they would miss their
mobile phone the most
Nearly every adult in the UK uses a mobile
phone (96%). This is the case across all age
groups; mobile phone use ranges from 100%
among 35-44 year-olds to 81% of those aged
75 and over. And our reliance on mobile
phones is growing; half of adults now say their
mobile phone is the device they would miss
the most if it was taken away, an increase
since 2017. This reliance varies considerably
with age and is felt most strongly among 16-
24 year-olds (77%) and least strongly among
75+ (8%). As reliance on mobile phones            Looking at the underlying behaviour driving
decreases with age, reliance on the TV set        this reliance on mobile phones; our
increases; 5% of 16-24’s say they would miss      qualitative Adults Media Lives research found
their TV set the most, rising to two-thirds of    that there are a number of core activities
75+.                                              which almost all the participants in the study
                                                  do regularly, such as accessing social media,
                                                  messaging, shopping, and watching and
                                                  listening to streaming services and YouTube.
                                                  These core activities lend themselves readily
                                                  to apps and mobile devices, and as such more
                                                  of their use is via smartphones. Participants
                                                  also highlighted specific examples of the
                                                  benefits of smartphone apps. For example,
                                                  one participant who is a gymnastics coach was

                                                  5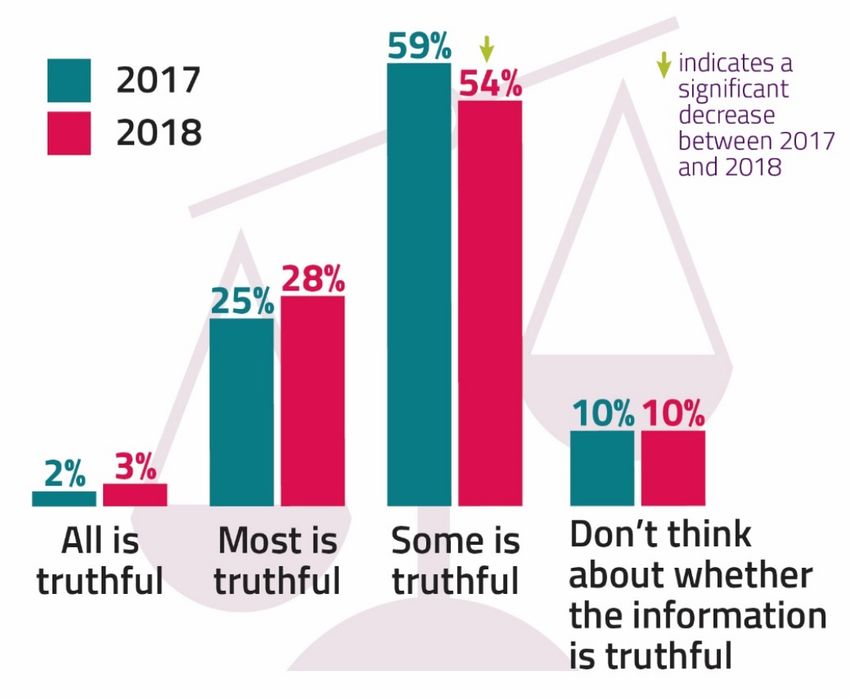
using an app on her iPhone to film and give               One in three adults never use a computer
feedback to the athletes whom she was                     to go online and one in ten only use a
coaching.                                                 smartphone, an increase since 2017
                                                          While the proportion of adults who go online
    “For my job obviously I’m coaching a lot
                                                          (87%) and the total average estimated weekly
    and it’s very technical. When I film one of
                                                          hours spent online (25.3 hours 2) are
    my gymnasts it’s easier if I can see it on a
                                                          unchanged since 2017, the way we are using
    bigger screen so I can correct their
                                                          the internet is changing. Adults now estimate
    mistakes. I’ve got an app called Coach’s Eye
                                                          they spend more time online out and about,
    where I can write on it, tell them what
                                                          compared to 2017 (2.9 vs. 2.5 hours).
    degree to take off from and stuff. So it’s
    easier for me to see them, and for them to            People’s device use is also changing. Adults
    see themselves as well.”                              are less likely than in 2017 to use a computer
    Female, 18, Gymnastics coach, Coventry                to get online 3 (58% vs. 62%), and this has
                                                          decreased by 20pp since 2013 (78%). As such,
                                                          three in ten adults never use a computer to go
                                                          online, with adults in the C2 (38%) and DE
                                                          (35%) socio-economic groups more likely to
                                                          do this, while AB adults are less likely (15%).
                                                          And around one in ten adults say they only
                                                          use a smartphone to go online; an increase of
                                                          three percentage points compared to 2017,
                                                          and again more likely among C2 (16%) and DE
                                                          (17%) adults, and less likely among AB (4%)
                                                          and C1 (7%) adults.

Devices used to go online

2
  Figures reported here are based on respondents’ own estimations of time spent online and therefore there
may be a degree of over and under-reporting. This data is different to the ComScore data reported in Ofcom’s
Online Nation report because comScore data combines panel and census measurement techniques to obtain
digital audience measurement statistics.
3
  A computer is defined as a desktop PC or laptop

                                                         6
But only using a smartphone to go online can                 more likely than average to have undertaken
bring challenges; while two-thirds of                        14 of the 15 types of internet use in the
smartphone users have ever used their phone                  previous week. At the other end of the
to complete a form, or application                           spectrum, internet users aged 65-74 and 75+
(smartphone users aged 16-34 are more likely                 are less likely than average to have
to say they have ever done this), seven in ten               undertaken all 15 types of activity in the
agree that completing forms or working on                    previous week.
documents is easier on a computer.
                                                             As in previous years, there are differences by
Going online when out and about can put a                    socio-economic group in the range of online
drain on your data allowance, however it                     activities undertaken. ABs are more likely than
seems that smartphone users are getting                      internet users overall to have undertaken
better at managing data use. Compared to                     nearly all of the 15 types of activities in the
2017, smartphone users are less likely to say                previous week, with the exception of playing
they have ever used up their data allowance                  games online. In contrast, DEs are less likely
(34% vs. 38%). Those that have ever used up                  than average to have been online in the
their data adopt mitigation strategies if they               previous week for 13 of the 15 types of
                                                             activity; they are as likely as internet users
are at risk of running out; over half restrict
their data use or only go online when they can               overall to have been online for
use wi-fi and just under half just use their                 communications and for gaming.
phone less for going online.                                 We also asked internet users about the
                                                             creative activities they had ever done online;
The range of online activities undertaken
                                                             the three most popular activities were adding
by internet users varies both by age and
by socio-economic group                                      filters to or editing a digital photo (35%),
                                                             following online tutorials (31%) and making a
Another aspect of understanding online use is
                                                             video and sharing it online (29%). 5
to look at the types of activities that people
are undertaking online. As in previous years,                Our Adults’ Media Lives study echoes these
generally, internet users aged under 35 are                  findings; we observed that participants’
more likely than average to have undertaken                  patterns of online behaviour are quite diverse
a wide range of online activities in the                     and there is a clear segmentation between
previous week, while those aged 55+ are less                 those who use the internet for what might be
likely. 4 The widest range of online activities              described as ‘basic’ tasks, and those who use
are undertaken by those aged 25-35, who are                  it for a wider and more diverse range of

4
  Internet users aged 16+ were prompted with 24 different internet activities and are asked to say which of
them, if any, they have gone online to do, and which of these they have done in the previous week. For this
initial analysis, 23 of the 24 activities4 have been grouped into 15 types of use, to enable broader comparison.
The 15 types of activities are: email, communications, banking, transactions, social media, news, accessing
information for work/ school/ college, watch short video clips, listen to radio/ audio services, watch TV
content, access health information, access government services, games, remote activities (e.g. accessing files
through a cloud service of remotely control household appliances), uploading/ adding content.
5
  Internet users aged 16+ were prompted with ten creative activities and were asked whether they had ever
done any of them online. The creative activities asked about are: adding filters to or editing a digital photo,
following online tutorials, making a video and sharing it online, live-streamed videos, created an online photo
book, calendar or personalised birthday card, made a meme or gif, made, built or modified a website or app,
made a blog or vlog, created an online scrapbook of ideas and made own music online or changed/ edited
someone else’s music online.

                                                           7
activities. Participation in a broader range of       “I did my poetry this year… My plan was to
activities (including using the internet for          do 100 poems in eight months. I created my
research, learning and study support, job             own domain and set up a WordPress… I
hunting, banking, fitness tracking, dating,           was posting maybe a poem every couple of
gambling, etc.) are most likely to be                 days onto my WordPress blog. After about
undertaken by younger, more educated and              number 30 I also set up an Instagram
more digital media-aware participants. And            page.”
unlike the core activities, they are also most        Male, 23, tutor, London
often conducted via a web browser on a PC.

                                                  Proportion of adults who watch on-demand
The evolving viewing
                                                  or streamed content
landscape
Video on demand and streamed content
is becoming a central part of adults’
viewing landscape
Adults’ viewing landscape is changing; there
has been an increase in the proportion of
adults who watch on-demand and streamed
content (60%), compared to 2017 (55%).
There are clear age and socio-economic
differences in preference towards this type of
content; 16-24s (79%) and ABs (73%) are
much more likely than average to watch on-
demand and streamed content, while 75+
(22%) and DEs (46%) are much less likely.

                                                  8
With the proliferation of online services                   Exposure to opposing views
offering on-demand or streamed content, it
can be hard to decide what to watch. When
                                                            and unwanted experiences
asked, almost six in ten adults seek familiar               online
content and choose programmes because “it’s
something they watch regularly”. Catching up
                                                            Social media users are less likely than in
                                                            2017 to see views they disagree with on
on programmes is also a popular reason; close
                                                            social media
to half say they choose content because they
missed it when it was originally broadcast.                 The proportion of internet users with a social
Social media seems to be a big influence in                 media account is unchanged since 2017 (80%
content choice among viewers of on-demand                   of internet users have a profile 6), however the
content aged 16-24, who are more likely than                sites they are using is changing. Facebook
average to pick based on social media reviews               remains the most popular social media site,
(25% vs. 14%). Browsing through the service                 however this has decreased since 2017 (88%
to see what’s available is a less popular                   use Facebook, down from 91% in 2017). There
method of discovering content than it was the               has been a corresponding increase in the use
previous year (46% vs. 54% in 2017).                        of WhatsApp (61% in 2018, up from 54% in
                                                            2017) and Instagram (38%, up from 31% in
The popularity of video-on-demand and                       2017). When asked about their main site,
streaming services is clearly illustrated in our            again while Facebook remains the most
Adults’ Media Lives research. Our participants              popular, internet users are now less likely
continue to reference streaming services                    than the previous year to consider this their
extensively in their discussion of their viewing            main site (58% in 2018, down from 70% in
habits, and the majority have access to at                  2017) and more likely to nominate WhatsApp
least one subscription-based streaming                      (23% vs. 16%), Instagram (5% vs. 3%) and
service. We also found this year that YouTube,              YouTube (4% vs. 2%).
which has been a popular viewing platform
for many of our participants for a number of                Social media allows us to connect and share
years, has become more important as some                    information with others, but it appears that
move towards more viewing on mobile                         social media users are increasingly shielding
devices. This year, for the first time, two of              themselves from opinions which differ from
our participants said that YouTube is now                   their own. Compared to 2017, social media
their first port of call for ‘TV viewing’ and a             users are less likely to say they see views they
few of our participants now don’t have a TV                 disagree with; a quarter say they ‘rarely’ see
set at all, or if they do, it is not connected to a         views on social media they disagree with (vs.
traditional terrestrial/ satellite/ cable service.          18% in 2017). As such, more social media
                                                            users say they ‘rarely’ see views they disagree
                                                            with (24%) than say they ‘often’ see views
                                                            they disagree with (17%).

                                                            Looking at the right to anonymity online,
                                                            internet users are divided; with similar
                                                            numbers agreeing as disagreeing that “people

6
 When expressed as a proportion of all adults (as opposed to all internet users) seven in ten (70%) adults aged
16+ have a social media profile.

                                                          9
should have the right to hide their identity Compared to 2017, there has been an
online in order to express their views increase in the proportion of internet users
anonymously” (41% vs. 40%). However, who say they have seen hateful content 9
internet users are less likely to think “it’s online in the past 12 months (53%, up from
important people have the right to say what 47% in 2017). This is driven by an increase in
they want even if it is controversial or hurtful the proportion who say they ‘sometimes’ see
to others” (43% disagree vs. 36% agree). this type of content (39% in 2018, up from
33% in 2017). One in seven say they ‘often’
Internet users are more likely than in see this type of content (the same as in 2017).
2017 to have encountered hateful However, three in five of those who saw
content online, although most didn’t do
hateful content said they ignored it or didn’t
anything about it
do anything about it. Of those who did do
Using the internet can expose people to something about it, the most popular
unwanted experiences and just over half of responses were to report the hateful content
internet users say they have concerns about to the website or app (17%) and to block the
the internet. 7 In order to explore this in more person who made or shared the comments
detail, we show internet users seven types of (12%).
negative online events and ask them which, if
any, they have experienced in the past 12 In our Adults Media Lives study, when asked
months. 8 More than a quarter say they have to explain what they considered to be harmful
experienced any of these events. Just over or hateful content, most participants found it
one in ten say they have experienced a difficult to define this in their own words.
computer virus on any device used to go Most assumed that harmful or hateful content
online, and fewer say they have experienced equated to the more extreme forms of online
each of the other six events. bullying or ‘trolling’. As such, only a few
participants claimed to have had direct
Social media can be a source of upsetting or experience of such content online (although
offensive content; six in ten social media users some claimed to have seen it directed
have seen this type of content in the past 12 towards celebrities). Perhaps unsurprisingly,
months and one in ten say they have ‘often’ these individuals had a more nuanced
seen this type of content.
7
Ofcom has conducted a quantitative online harms research project (fieldwork in Spring 2019). This research,
among adults aged 16+ and children aged 12-15, explores concerns about using the internet, reported
experience of potential harms (including frequency and impact) and sources of potential harms. A higher level
of unprompted concern was found in our 2019 online harms research than in our 2018 media literacy
research. This is probably due to a difference in the question wording (the 2019 survey prompted respondents
to think about apps, social media, online gaming and video clips) and news stories relating to social media sites
before and during the 2019 fieldwork. For more information, see Ofcom’s 2019 Online harms research.
8
The negative events shown to respondents are; a computer virus, email account or social media account
hacked, online contact from someone pretending to be someone else, lost money online or victim of scam,
financial or personal information stolen or used online without the user’s permission or knowledge, online
bullying/ harassment/ trolling and being threatened or stalked online.
9
Internet users were asked whether they had seen anything hateful on the internet that has been directed at
a particular group of people, based on, for instance, their gender, religion, disability, sexuality or gender
identity. They were also provided with the following explanation: Examples of these sorts of things might be
cruel or hateful comments or images that have been posted on social media, comments in response to an
article that you read online, or videos posted on sites like YouTube.
10understanding of what such content is and by platform; nearly half report seeing
were more disturbed by it. inappropriate content on Facebook,
compared to a quarter on Twitter or YouTube.
“It seems quite prevalent on Twitter. So I do
flag up something that I see as abusive, Although awareness of reporting functions is
harmful, racist – I’ve done it quite a lot, high, the proportion who have ever reported
actually – especially over the last couple of content is low. Among those that saw
years. It is also driven by things like Brexit – inappropriate content, six in ten reported it to
that kind of polarisation of our political Facebook, half to Twitter and four in ten to
views… I think I’ve taken a bit of it YouTube.
personally as well, especially as a Welsh
language speaker.” Among those who had seen inappropriate
Male, 39, web officer, Cardiff content but did not report it, three in ten of
those who use Facebook and one in five who
More occasionally, in the study participants use YouTube said it was because they didn’t
cited examples of seeing offensive videos think the platform would do anything about
containing violent content, or were aware of it. 11 A quarter of Facebook and YouTube
hateful content containing racial hatred or users said it was because they couldn’t be
incitement to violence. bothered.
“Well I have had things sent to me that Similarly, in our Adults Media Lives study,
should never have been sent on the internet when asked what they would do if confronted
– mates have looked it up, you see this by inappropriate or upsetting content online,
video and you think ‘Why have you sent me many participants claimed that they would
this?’. You see really violent things and a lot ignore it, rather than report it. For some this
of other things nobody should see.” was because they were not overly concerned
Male, 57, alarm fitter, Lisburn NI about the prospect of seeing such content;
others said they were concerned but had
Despite there being high awareness of limited confidence in the platforms in
reporting functions on Facebook, Twitter question acting on such complaints.
and YouTube, around half of those that
saw inappropriate content did not report “Sometimes I won’t block because I kind of
it want to know if they’re still doing that…
More often than not they will take down an
For the first time in 2018, we asked questions
abusive or harmful tweet, but I’ve also seen
among users of YouTube 10, Facebook and
things that haven’t been taken down even
Twitter to explore awareness of and
though I’ve flagged it up. There’s not much
experience in using reporting functions on
of an argument back from Twitter.”
these sites. Awareness of reporting functions
Male, 39, web officer, Cardiff
is high; four in five are aware of this
functionality on Facebook and three in four on
Twitter and YouTube. The proportion who
have ever seen inappropriate content varies
10
Those who said they ever watched videos on video-sharing sites or apps like YouTube, Vimeo, Snapchat or
Facebook were asked specifically about their awareness and use of reporting functions on YouTube.
11
Base too low (“You see stuff and you think “I don’t want Exploration online and
to see that”. Twitter has no way of
censoring what gets on there. And then
awareness of funding of
people say “Oh my God, why is this on, I’ve traditional media and online
reported this?”. In fact they’ll say stuff like services
‘Let’s all report this’. Thousands of people
will report it, but two days later it will still A third of internet users only use
be there.” websites or apps they’ve used before;
Male, 20, student, Leeds this is more likely among those aged 55
and over or those in the DE socio-
Over half of internet users use strong economic group
passwords on devices used to go online, Understanding the extent to which people are
or anti-virus or anti-spyware packages willing to explore online is important context
Another area we explore in our survey is for many of their attitudes and behaviours.
adults’ use of security measures to protect Overall, confidence as an internet user
themselves and their family when going remains high (87%), unchanged over the past
online. There are two security measures that two years. Despite these high levels of stated
are used at home by a majority of internet confidence, more than a third of internet
users. More than three in five use strong users say they only use websites or apps that
passwords online or on devices used to go they’ve used before. A higher proportion
online, and slightly fewer say they use security (40%) say they use “maybe one or two” sites
software such as anti-virus or anti-spyware or apps that they haven’t used before and a
packages, however this has decreased since lower proportion (22%) say they use lots of
2017 (65%). This might be because new websites or apps that they haven’t used
devices tend to have anti-virus software pre- before.
installed. Just over one in ten use a virtual
The propensity to explore online decreases
private network (VPN) to hide their location
with age; 30% of internet users aged 16-24
online.
say they have used lots of websites or apps
The adoption of security measures varies by they’ve not used before and this drops to 10%
both age and socio-economic group; internet of those aged 55+. Those in DE households
users in AB households are more likely to use are less likely to explore online; half say they
security measures, while those aged 75+ and say they only use websites or apps they’ve
in DE households are less likely. Internet users used before, while those in AB households are
aged 16-24 are more likely to use newer less likely to say this (25%).
security measure such as fingerprint of facial
recognition (37% vs. 27% internet users The majority of people are aware of how
overall), however this is most likely linked to
television programmes are funded, but
they are less aware of how online
device capability.
services and websites are funded
One element of media literacy is
understanding how different media and
online services are funded, so as to better
understand the motivations of the companies
or organisations providing the content on
12such services. Awareness of the funding of services. Just over half of adults are aware of
television programmes remains high; eight in how search engine websites are mainly
ten adults are aware of the licence fee as the funded (i.e. by advertising), and just over four
main source of funding for BBC television in ten adults are aware that the main source
programmes, and seven in ten are aware that of funding for YouTube is advertising.
advertising is the main source of funding for
television programmes on the commercial There are clear differences by socio-economic
group in awareness of the funding of media
stations.
and online services; those in DE households
While awareness of the licence fee as the are less likely than average to be aware of
main source of funding for BBC TV how most media and online services are
programmes is high, fewer adults correctly funded, while those in AB households are
identify the licence fee as the main source of more likely.
funding for the BBC website (62%). Awareness
of how the BBC iPlayer service is mainly However, a large minority of internet users
funded is lower still; about half are aware that don’t seem to mind who funds or owns
websites; four in ten think that so long as the
the licence fee is the main source of funding.
internet provides good websites it doesn’t
Awareness of funding of online services is matter how these are funded, higher than the
lower than for funding of traditional TV 35% who disagree.
Awareness of how media and online services are funded
13While there was good awareness of the use of
Protecting personal data
cookies to collect information about the
Although most internet users are aware websites people visit and the products/
of at least one of the ways in which their services that interest them (at 70%), there
personal data might be collected online, was less awareness of apps on smartphones
less than four in ten are aware of all the that collect data on users’ locations or on
ways we asked about what products or services interest them
Three-quarters of internet users say they are (49%). However, this has increased since
confident in knowing how to manage who has 2017 13 (45%). Overall, eight in ten were aware
access to their personal data online 12. of at least one of the four ways in which
Confidence varies with age and by socio- companies can collect information about what
economic group; it is highest among internet people do online 14, but less than four in ten
users aged 16-24 (83%) and 25-34 (84%) and were aware of all the ways.
lowest among adults aged 55+(60%) and
those in DE households (66%).
Internet users’ awareness of ways in which companies can collect personal information online
12 Users are prompted with the following explanation: “By this I mean knowing how to stop companies from
getting access to information like your personal details (like your address, phone number, date of birth etc.) or
information on things like where you shop or your interests”.
13
In 2017 the option “asking customers to ‘register’ with a website or app and to opt-in/ opt out of receiving
further information from them or their partners” was two distinct response codes. One referred to “receiving
further information from them” and the other “receiving information from their partners or other companies”.
As such, no trend data is available for this particular measure.
14
Internet users were prompted with the following four ways companies can collect information about people
based on what they do online and asked which they were aware of: using ‘cookies’ to collect information
about the websites people visit or what product interest them; collecting information from social media
accounts i.e. about users interests, ‘likes’, location, preferences; asking customers to register with a website
and opt in/out to receiving further information from them of their partners and; using apps on smartphones to
collect data on users’ locations of what products and services interest them.
14Companies use terms and conditions to “The stuff about Cambridge Analytica
explain how they use personal data. However, makes me come to the conclusion that any
seven in ten internet users agree that they organisation which uses the internet… is
usually accept the terms and conditions online going to collect data because they can sell
without reading them, and the same it, and they’re going to analyse it, either for
proportion of social media and messaging site their own use or because they can sell it
users say this about social media sites. on… I was particularly concerned when I
read about the data and information leak
Although a large minority of internet users are from Facebook a few days ago… I assume
not happy for companies to collect and use
that because I don’t use it I’m not one of
their personal information, there are
the vulnerable ones, but who knows?”
increasing levels of acceptance if it benefits Male, 74, retired, Warwick
them. For example, connecting to a free
service like public wi-fi (22% vs. 13% in 2017) “I went to Frankie and Benny’s the other
or if they get a personalised service like a day and you had to put your personal
weather update (15% vs. 8% in 2017) in information in to access the internet. I used
return. However, levels of acceptance are to put my own information in and not think
reducing towards personal information being twice about it, date of birth, everything.
used even if they can choose to opt-out at any Then I started thinking ‘Why do they need
point (30% vs. 35%) and if companies are clear that?’… So I started putting in fake email
about how their information will be used addresses, fake date of birth, fake names.”
(29% vs. 33%). 15 Female, 26, student, Edinburgh
In our Adults Media Lives research we found Three in ten internet users aren’t making
that there was an increased awareness and ‘appropriate’ or media-literate checks
sensitivity about the collection and use of before entering their personal details
personal data. Facebook’s part in the online
Cambridge Analytica data leak (as well as a
It’s almost inevitable that internet users will,
further Facebook data breach which occurred
at some point, need to submit their personal
during the fieldwork period) appear to have
details online; for example, to sign up to a
had a lasting effect on user confidence. As a
service or to buy something. We ask internet
result of such concerns, some participants
users whether they make any checks, or take
described themselves as being more careful
any specific actions before submitting details
about how they now share their data (e.g.
online, to protect their personal data; these
when they sign up to public wi-fi).
are classified as ‘appropriate’ (media-
15
For more information on use of personal data including what information online services collect about users
and how, see User Data section in Ofcom’s Online Nation report.
15literate) 16 or; ‘less appropriate’ checks or not Critical thinking; awareness of
making any checks 17. 18
advertising and evaluating
Overall, two-thirds of internet users make at online content
least one of the ‘appropriate’ checks
(unchanged since 2016); more than three in There has been little change in critical
five say they check to see whether the site awareness in the past few years, with
looks secure before registering their details many still lacking the critical skills
online, while just under half say they check needed to identify when they are being
whether they are familiar with the company advertised to online
or brand. Critical thinking, or awareness, is the skill that
enables people to assess and evaluate their
However, three in ten internet users say they
media environment; an element of critical
make one or more of the ‘less-appropriate’
thinking is the ability to recognise what is a
checks or don’t make any checks at all (higher
commercial and what is an editorial message
for those aged 16-24, 37%). Around one in
online. Our survey shows that more than four
seven would register their details if it was the
in five internet users say they are confident
only way to get the product or service they
that they can identify online advertising, as in
wanted or would rely on checking whether
2017. However, only half of search engine
the site was listed by a search engine. Five per
users correctly identify advertising on Google
cent say they tend to enter their personal
and understand that this is the only reason
details whenever they are required, although
the results are displayed (unchanged since
this is less likely than in 2017 (7%).
2015). 19 Those in DE households are less
likely to only give this correct response (37%),
whereas those in AB households are more
likely (57%).
16
‘Appropriate’ checks include; checking if the site looks secure (padlock symbol or https), if familiar with the
company or brand, if there is another reputable service like PayPal, if there is a guarantee personal details
won’t be shared with anyone else and if the site is recommended by friends and family.
17
‘Less appropriate’ checks include checking if the site is listed by a search engine. Not making any checks
includes; entering personal details if it’s the only way to get a product or service wanted or entering details
whenever required.
18
Four per cent of internet users spontaneously mentioned that they never registered with websites/ entered
their personal details online, so have been excluded from the results shown.
19
Search engine users can select more than one response to this question, 48% is the proportion of those who
give only the correct response and do not select either of the other options.
16Search engine users’ understanding of paid-for results returned by Google searches
Awareness of personalised advertising is about household communication services;
unchanged since 2017 and potential vlogger those in DE households are half as likely to
endorsement since 2016: six in ten internet have done this than those in AB households
users recognise that some people might see (24% vs. 50%).
different adverts to the ones they see, and
three in four users of video-sharing sites are On some price comparison websites, the deals
listed first are paid-for content, or advertising.
aware that the vloggers/ influencers might be
being paid by the company to say favourable A third of adults who go online and have ever
things. used a price comparison website are aware of
this; this means that two-thirds are not aware
Internet users have mixed attitudes towards that the deals listed first might be paid-for
online advertising; more than a third dislike all content. As with use of price comparison
online advertising, a quarter say they don’t websites, there are differences by socio-
mind seeing ‘any’ online ads and close to four economic group in awareness of advertising
in ten don’t mind seeing them as long as they on these websites; users of price comparison
are relevant to them. websites in DE households (25%) are less
likely than average to be aware, and those in
Two-thirds who use price comparison AB households (43%) are more likely.
websites are unaware that the deals
listed first on these sites might be paid- Despite almost all internet users using
for content search engines to look for information
Price comparison websites can be a useful online, only six in ten understand that
tool to help consumers get the best or not all the websites returned will be
cheapest deal to suit their needs. Close to two accurate and unbiased
in five internet users have used a price Search engines are by far the most popular
comparison website to look for information source when looking for information online,
17used by 94% of internet users. Six in ten One in ten internet users don’t think
search engine users think that some of the about the truthfulness of online content,
websites returned will be accurate or although those who do are more likely
unbiased while others will not be (unchanged than in 2017 to make checks to verify the
since 2011); in other words, a response that information
shows a level of critical understanding or Being able to judge the truth and accuracy of
awareness about the provenance of content. different sources of online content is another
However, one in five think that if the results key critical thinking skill. Over half of internet
are listed by the search engine, the websites users say they consider ‘some’ of the factual
will contain accurate and unbiased information they find online to be true,
information, and 17% don’t think about the showing a degree of critical understanding,
accuracy of the information in the websites although this response is lower than in 2017
returned, they just use the sites they like the (59%). Three per cent of internet users
look of. consider that ‘all’ the factual information they
find online is true and, as in 2017, 10% of
As we saw with awareness of funding and
internet users do not consider whether the
online advertising, there are differences by
factual information they find online is truthful
socio-economic group; search engine users in
or not.
DE households (46%) are less likely to
demonstrate a critical understanding of
search engine results, while those in AB
households (65%) are more likely.
Internet users’ belief in the truthfulness of factual information they find online
18However, internet users who do consider the Digital exclusion and
truthfulness of online information are more
likely than in 2017 to check this information demographic differences
(72% vs. 67%). This is attributable to users in
2018 being more likely to check the credibility
Thirteen percent of adults do not use the
internet, unchanged since 2014; those
of the information, for example the author’s
aged 55 and over and in the DE socio-
name, or a link to the original publication
economic group remain less likely to be
(28% vs. 23%). Almost half of those who
online
consider whether the information they find
online is truthful would check different It’s important to note that despite the
websites to see if the same information omnipresent nature of the internet for many
appeared on them all; this was the most UK adults, 13% of adults in the UK do not use
popular check. the internet and this proportion has not
changed in the past four years. Understanding
Although close to one in five social media who these people are and why they are not
users say they would not tend to check the using the internet can highlight whether a
truthfulness of news articles, this is less likely section of UK society is being digitally left
than in 2017 (23%). Seven in ten said they behind, and what are the barriers to take-up.
would make at least one check; the most The proportion of adults who do not use the
popular was to assess whether the source of internet increases with age; until almost half
the article was either a known or a of those aged 75 do not use the internet, and
trustworthy organisation (46%), followed by varies considerably by socio-economic group;
using a ‘peer-based’ judgement, either by about a quarter of those in DE households do
looking at what others had said about the not use the internet.
story, or by assessing whether the person who
shared the story was trustworthy (37%).
Proportion of UK adults who do not use the internet
19In order to understand the barriers to take- Compared to ‘established’ internet users
up, we ask those who do not use the internet (those who first went online at least five years
their reasons for not going online; more than ago), newer users’ self-reported confidence as
half say they do not see the need or “it’s not an internet user is much lower (55% vs. 89%).
for people like me” or they are not interested.
Just over one in five mention a reason for Newer users also use devices differently to
non-use relating to it “being too complicated” established users; they are more than twice as
while 15% mention a cost-related reason. likely to never use a computer to go online
(65% vs. 31%). A quarter of newer users only
Despite the opportunities the internet use a tablet to go online (vs. 3% for
provides – such as connecting with friends established users) and around one in five only
and accessing online services – seven in ten use a smartphone to go online (vs. 11% for
who do not use the internet say that nothing established users).
would encourage them to go online in the
next 12 months. However, almost a quarter Newer users tend to be less likely than
mention something that would encourage established users to possess critical
awareness of media and online services. For
them to do this; the most popular reason is to
buy something online (10%). example, they are less likely to be aware that
the results returned by search engines may
Proxy use of the internet - i.e. people asking contain inaccurate or biased information (38%
someone else to use the internet on their vs. 60% for established users). And in relation
behalf - can be a way for those who do not to verifying factual information online, while
use the internet to access online services more than half of newer internet users say
without needing to go online themselves. they would make at least one check, they are
More than two in five who do not use the less likely than established users to do this
internet have asked someone else to use the (55% vs. 73%).
internet on their behalf in the past year. The
most common reason was to buy something When those aged 55 and over and in the
(28%), followed by 12% saying it was to access DE socio-economic group do go online,
information (other than public service
they are more likely to be narrow
internet users
information).
Understanding who is at risk of being digitally
In addition, the proportion of newer left behind isn’t just about understanding who
internet users has decreased since 2017, is not online; it also relates to breadth of use
therefore the digital divide isn’t reducing of the internet. As such, it’s important to
‘Newer users’ are defined as those who first understand the proportion of narrow internet
went online less than five years ago. Five per users in the UK and who they are. Narrow
cent of all internet users are newer users 20 – users are defined as those ever carrying out
down from 7% in 2017, and there is a higher up to four of the 15 types of online use we ask
incidence among those aged 65-74 (15%) and about. 21
adults in DE households (9%).
20
Base of newer users under 100 (97), so results should be treated as indicative only.
21
Medium users ever carry out between five and nine types, and broad users ever carry out between ten and
15 types. The 15 types of use are: email; transactions e.g. online shopping, trading/ auctions; communicating
20Narrow users account for 28% of all internet Differences in confidence online and critical
users and have the same demographic profile understanding also appear to be driven both
as non-users; they are more likely to be aged by age and socio-economic group; working-
55 and over (34% for 55-64s, 41% for 65-74s age internet users in DE households continue
and 54% for 75+) and in the DE socio- to be less confident users than those in non-
economic group (42%). DE households (84% confident vs. 92%).
Adults of working age in DE households are
One in seven adults of working age in DE less likely than those in non-DE households to
households do not use the internet, and correctly identify the source of funding for
when they do, one in five only go online many media and online services. And working-
via a smartphone
age search engine users in DE households are
Given the high proportion of older people in less likely than those in non-DE households to
the DE socio-economic group, we used our understand that the results returned by
survey data to conduct additional analysis search engines may contain inaccurate or
among working-age adults (16-64 year-olds) unbiased information (46% vs. 63%) and to be
to explore whether the differences in going able to correctly identify advertising on
online, and in levels of critical understanding, Google (37% vs. 51%).
are driven by age, socio-economic group or
both.
Our analysis revealed that working-age adults
in DE households are more than three times
as likely as those in non-DE households to not
use the internet (14% vs. 4%), showing that
differences in non-use of the internet are
driven both by age and by socio-economic
group. When adults of working age in DE
households do go online, more than two in
five never use a computer to do this (vs. 29%
in working-age non-DE households). And
adults of working age in DE households are
twice as likely than those in non-DE
households to only use a smartphone to go
online (21% vs. 10%).
via instant messaging; banking/ paying bills; social media; finding/ downloading information for work/
business/ school/ college/ university/ homework; accessing news; find information on health-related issues;
watch short video clips; using local council/ government sites e.g. to find information, to complete processes
such as tax returns, to contact local MP; listening to radio or streamed audio services; watching TV
programmes or film content online; remote access e.g. accessing files through a cloud service, remotely
control TV services at home using an online device, remotely control or monitor household; uploading or
adding content to the internet e.g. photos, videos, blog posts; and playing games online or interactively.
21You can also read


