Adverse CHILDHOOD EXPERIENCES - IN MINNESOTA.
←
→
Page content transcription
If your browser does not render page correctly, please read the page content below
adverse
CHILDHOOD
EXPERIENCES
IN MINNESOTA.
FINDINGS & RECOMMENDATIONS BASED ON THE
2011 Minnesota Behavioral Risk Factor Surveillance System.
Acknowledgment.
                                  The Minnesota Department of Health (MDH) gratefully acknowledges
                                  the authors of this report including Autumn Baum, Adverse Childhood Experiences Planner
                                  for MDH, and Melanie Peterson-Hickey, Senior Research Scientist for the MDH Center for Health Statistics.
                                  MDH would like to acknowledge Assistant Commissioner Jeanne Ayers and
                                  Scott Smith, MDH Communications Specialist, for their time and support of this report.

                                  The MDH Center for Health Statistics volunteered a great deal of their time, energy,
                                  insight and experience to this project. Their contributions were invaluable in the
                                  production of this report. Special thanks to Kim Edelman, Ann Kinney,
                                  Pete Rode, and David Stroud. Special appreciation to the coordinator
                                  and staff of the Minnesota BRFSS, Nagi Salem and Laurie Goldman.

                                  MDH wishes to acknowledge Marilyn Metzler, Senior Analyst in Health Equity in the Division of
                                  Violence Prevention at the Centers for Disease Control and Prevention and Laura Porter, Co-Founder of ACE
                                  Interface and Director of ACE Partnerships for the Washington State Department of Social and Health Services,
                                  as well as MDH staff—including Assistant Commissioner Ellen Benavides,
                                  Maggie Diebel, Mark Kinde, Janet Olstad, David McCollum, and Patty Wetterling—
                                  staff at the Minnesota Department of Human Services (DHS)—including
                                  Glenace Edwall, Anna Lynn, and Joanne Mooney— and Nancy Riestenberg
                                  at the Minnesota Department of Education (MDE) for reviewing the drafts
                                  and providing comments. Much appreciation to Julia Johnsen, at the Center for
                                  Leadership Education in Maternal and Child Public Health at the University
                                  of Minnesota; Nikki Kovan, Research Assistant, and Jane Kretzmann, Senior Fellow,
                                  at the Center for Early Education and Development at the University
                                  of Minnesota; Amanda Tarullo, Assistant Professor at Boston University;
                                  and Barbara Simpson Epps and Dave Ellis, at Three E Consulting,
Minnesota Department of Health.
          P.O. Box 64975          for their contributions to this report.
    St. Paul, MN 55164-0975
                                  MDH would also like to thank Governor Dayton’s Children’s Cabinet—
      Phone 651-201-5000
                                  MDH Commissioner Ed Ehlinger, DHS Commissioner Lucinda Jesson,
     Toll-free 888-345-0823
                                  and MDE Commissioner Brenda Casselius—for its support of this report
       PREPARED FEBRUARY 2013.    and DHS for its financial support of the final production of this report.
Table of Contents
              EXECUTIVE SUMMARY                                                  5-7

              INTRODUCTION		                                                    8-11
                      The Brain and Child Development                             9
                      How Does Stress Affect the Developing Brain?                9
                      Types of Stress                                            10
                      Why Do Some Children Thrive and Others Fare Less Well?     11

              THE ACE STUDY		                                                  12-13
                      Background—the Adverse Childhood Experiences Study         12
                      What is an ACE?                                            13
                      The 2011 Minnesota ACE Study                               13

              MINNESOTA ACE FINDINGS                                           14-29
                Prevalence of ACE Variables                                       14
                Co-Occurrence of ACEs in Minnesota Adults                         15
                Definitions of ACE Experiences                                    16
                ACE Variables of Minnesota Adults By Gender                       17
                Socio-Demographic Characteristics                              18-24
              		Race/Ethnicity                                                    18
              		Education                                                         20
              		         Marital Status                                           20
              		         Employment Status                                        21
              		         Housing Status                                           21
              		         Financial Stress                                         22
              		         Disability Status                                        24
                The Minnesota Student Survey                                      19
                Health Conditions and ACEs                                     25-26
              		         Health Status                                            25
              		         Mental Health                                            26
              		         Chronic Health Conditions                                26
                Health Risks and ACEs                                             27
                Disparity Ratios                                                  28
                Other State Comparisons                                           29

              NEXT STEPS/FURTHER RESEARCH                                      30-31

              POLICY RECOMMENDATIONS                                           32-34

              CONCLUSION		                                                       35

              APPENDIX			                                                      36-39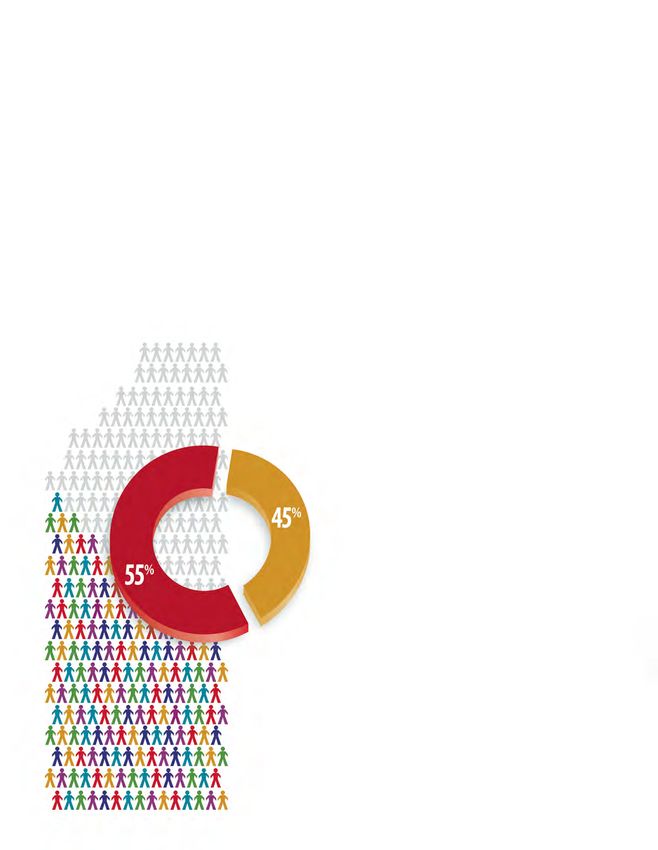
executive SUMMARY
This report marks the first time that the Minnesota Department of Health
has collected data regarding the effects of adverse childhood experiences
(ACEs) on the lifelong health and well-being of adults in Minnesota. For two
decades, research by the Centers for Disease Control and Prevention (CDC)
and other states has demonstrated over and over again the powerful impact
of ACEs on health, behavioral, and social problems. An extensive and growing
body of research documents that adverse childhood experiences (ACEs)—
those causing toxic levels of stress or trauma before age 18—are specifically

I
linked to poor physical and mental health, chronic disease, lower educational
achievement, lower economic success, and impaired social success in adulthood.

          n 2008, the CDC developed a set of ACE questions for states to
          use in the Behavioral Risk Factor Surveillance System (BRFSS),
          a survey used by individual states to determine the status
          of their residents’ health based on behavioral risk factors.
          In 2011, Minnesota became the 18th state to add the ACE
          questions to the BRFSS survey.

          Minnesota’s 2011 BRFSS results are consistent with the
findings from the initial ACE study and other states’ ACE studies.                  ...by reducing ACEs
First, ACEs are common. Over half of Minnesotans have experienced
at least one ACE. In particular, ACEs are more common among
                                                                                  we can reliably expect
Minnesotans who did not graduate from high school, who were                        a reduction in many
unmarried, who rented rather than owned their own home, who
were unemployed, or who worried about paying their mortgage or
                                                                                     ACE-related health
rent or about buying nutritious food. Second, ACEs frequently occur               and social problems.
together. In Minnesota, over half of Minnesotans experiencing ACEs
had more than two ACEs. Third, ACEs have a strong and cumulative
impact on the health and functioning of adults. For example,
Minnesotans with more ACEs were more likely to rate their health as fair
or poor, to have been diagnosed with depression or anxiety, to report
smoking and chronic drinking, to have been diagnosed with asthma,
and to be obese.

           Despite all of this, adversity is not the end of the story.
There is increasing understanding about resilience and what families,
communities, and systems can do to protect children and support
adults with ACEs. Resilience is positive adaptation within the context of
significant adversity. In the face of adversity, neither resilience nor disease
is a certain outcome. The hope of this research is to demonstrate that
by reducing ACEs, we can reliably expect a reduction in many
ACE-related health and social problems. Communities and states
such as Washington have improved health and well-being by rallying
around the concept of resiliency and reducing ACEs.
6
AC E s I N M I N N E SOTA
EXECUTIVE SUMMARY
What
is an ACE? ACEs are common
among Minnesotans
A R
n adverse childhood experience (ace) describes a traumatic experience esults indicate that ACEs are common
in a person’s life occurring before the age of 18 that the person recalls as an adult. among Minnesota adults. Over half
In the Minnesota BRFSS survey, respondents were asked if they had experienced any of the Minnesotans responding to ACE
of the following nine types of ACEs: physical abuse, sexual abuse, emotional abuse, mental module questions reported experiencing
illness of a household member, problematic drinking or alcoholism of a household member, at least one ACE in childhood. The five most
illegal street or prescription drug use by a household member, divorce or separation of a parent, common ACEs reported by Minnesotans in
domestic violence towards a parent, and incarceration of a household member. the survey are emotional abuse (28 percent),
living with a problem drinker (24 percent),
DOMESTIC VIOLENCE
SEXUAL ABUSE
separation or divorce of a parent (21 percent),
DRINKING PROBLEM INCARCERATION
PARENTS SEPARATED
DiVORCE DRuG usE
mental illness in the household (17 percent),
SEXUAL ABUSE M E N TA L I L L N E S S and physical abuse (16 percent).
PHYSICAL ABUSE EMOTIONAL ABUSE DIVORCE
DOMESTIC VIOLENCE
DRINKING PROBLEM PARENTS SEPARATED INCARCERATION
MENTAL ILLNESS DRUG USE
PHYSICAL ABUSE EmOtiOnAl AbusE
PrEvALENcE of INdIvIdUAL AcEs Minnesota 2011
Incarcerated Sexual Drug Use Witnessed Physical Mental Separated Drinking Emotional
ACEs often
Household
Member
Abuse Problem
in household
Domestic
Violence
Abuse Illness
in household
or Divorced
Parent
Problem
in household
Abuse
occur together
M
innesotans reporting one ACE are
more likely to report other ACEs
PERCEnt
in childhood. The chart below
illustrates that for those Minnesotans with at
least one ACE, 60 percent have two or more
ACEs, and 15 percent have five or more ACEs.
dISTrIBUTIoN of AcES Minnesota 2011
aMong those with at least 1 ace number of aces
The ACE score is a measure of cumulative exposure to particular adverse childhood conditions. 1
Exposure to any single ACE condition is counted as one point. If a person experienced none of 15% FIVE 2
the conditions in childhood, the ACE score is zero. Points are then totaled for a final ACE score. 3
It is important to note that the ACE score does not capture the frequency or severity of any
9% FOUR 4
given ACE in a person’s life, focusing instead on the number of ACE conditions experienced. 40%
ONE
5+
In addition, the ACE conditions used in the ACE study reflect only a select list of experiences.
15%
60%
THREE
22% TWO
55% of Minnesotans report experiencing one or more ACE in childhood
7
AC Es IN MINNES OTA
EXECUTIVE SUMMARY
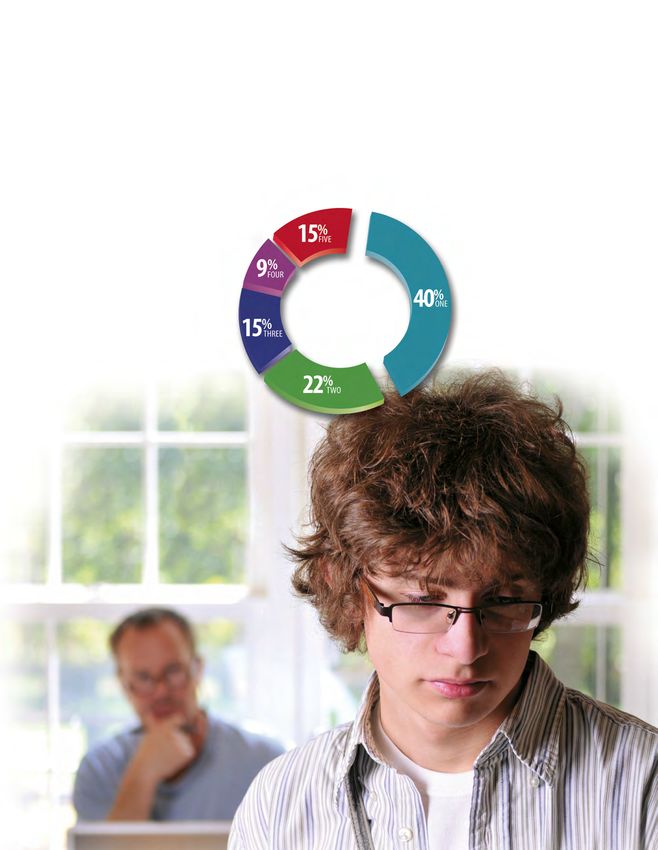
ACEs have a strong
A
s the number of ACEs increases, the risk for health problems increases
in a strong and graded fashion in areas such as alcohol and substance
and cumulative impact abuse, depression, anxiety, and smoking. The chart below shows the
on the health and functioning
association between ACEs of Minnesotans and chronic health conditions later
in life. The risk for anxiety, depression, and smoking increases as the number of
of adults in Minnesota ACEs increase. However, the correlation between ACEs and obesity or diabetes
increased risk of condition/behavior when ace is present Minnesota 2011
number of aces
I N C R E A S E D R I S K C O M PA R E D T O N O A C E s
Chart indicates times more likely. 1 represents equal risk to zero aCes
1
15% FIVE 2
3
9% FOUR 4
40% ONE
5+
15% THREE
22% TWO
Asthma Diabetes Obesity Depression Anxiety Chronic Drinking Current Smoker Health Status
fair or poor
is not as evident among Minnesotans. While ACEs. There is also a clear increase in reported drinking is less clear. Minnesotans with more
there is a definite increased risk of asthma for chronic drinking for Minnesotans with four or ACEs are more likely to rate themselves as
Minnesotans with five or more ACEs, there is more ACEs; however, the association between having fair or poor health as compared to
no clear pattern for those with four or fewer one to three ACEs and reported chronic those with no ACEs.
recommendations B Summary of policy ased on the findings of Minnesota’s ACE Study, we recommend the
following strategies to reduce ACEs and build resiliency in Minnesota
communities.
Increase awareness of ACEs, Enhance the capacity of communities to Continue to collect Minnesota-specific
their impact on health and well-being, prevent and respond to ACEs. data on the relationship among ACEs,
and Minnesotans’ capacity to act. health outcomes, and resilience.
1communication
Develop a 2 Work with the
state’s education,
3developSupport and
resilience
4collaborative
Build 5 Designate
funds to continue
6inventory
Develop a thorough
of existing
strategy that focuses child welfare, mental through investments leadership to the collection, analysis, agency and community
on the social and health, public health, that support community, form a vision and dissemination of efforts to reduce ACEs
economic benefits of health care, substance government, and support change. aCe data from and support resilience.
reducing and preventing abuse, juvenile justice, and philanthropy Minnesota residents.
ACEs in Minnesota. corrections, and public partnerships.
safety systems to
increase awareness
of the impact of ACEs
on the people these
agencies serve.
8
                                                                                              AC E s I N M I N N E SOTA
                                                                                              INTRODUCTION

INTRODUCTION.

                          I
                                n recent decades, the scientific community            Moreover, ACEs represent a preventable
                                has come to understand that childhood                 public health issue—the number and severity
                                experiences significantly shape the developing        of ACEs can be reduced through prevention while
                                brain and impact lifelong health and well-being,      intervention efforts can be used to mediate the long-
                                including educational and economic success.
                                                                                      term impact of ACEs on individuals and communities.
                                These childhood experiences are built into the
                                                                                                 Promoting family and community
                                human body, creating biological “memories” that
                                                                                      well-being and reducing ACEs takes all
                                shape development, for better or for worse. An
                                                                                      Minnesotans working together. Minnesota’s joint
                          extensive and growing body of research documents
                                                                                      efforts will shift resources by reducing the rates and
                          that adverse childhood experiences (ACEs)—
                          those causing toxic levels of stress or trauma—             cost of treating preventable health problems and
                          are linked to poor physical and mental health,              re-purposing and aligning those resources
                          chronic disease, lower educational achievement,             to efforts that support prevention and wellness.
                          lower economic success, and impaired social                 The factors that contribute to ACEs are
ACEs have a strong        success in adulthood.                                       complex and are found at the level of individuals,
and cumulative impact                 This research suggests that when a child is     families, communities, and society at large; thus
                          exposed to severe, frequent, and unrelenting stress         the work to reduce ACEs will be complex as well.
on the health and
                          without the buffering protection of adult support,          Yet, as state and community partners continue
functioning of persons    it can profoundly impact the body’s stress response         to work together to improve health at the individual,
throughout their lives.   systems and may result in the disruption of typical         family, and community-wide level, Minnesotans
                          brain development and chemistry. This type of stress        need to work toward solutions that solve multiple
                          is called toxic stress. Toxic stress can be the result of   problems simultaneously. Promotion of community
                          ACEs—such as child abuse, neglect, and repeated             health will draw together all public and private
                          exposure to household dysfunction—as well as
                                                                                      sectors to focus attention on policies, practice,
                          other traumatic events. ACEs have a strong and
                                                                                      and resource alignment to address behavior
                          cumulative impact on the health and functioning
                                                                                      and environments that create ACEs.
                          of persons throughout their lives.
                                                Understanding how ACEs
                                             impact health throughout the
                                             lifespan can help Minnesotans
                                             design effective policies and
                                             practices across systems resulting
                                             in families and communities
                                             where Minnesotans can grow
                                             and develop into healthy,
                                             contributing members of society.
                                             Reducing the ACE-related disease
                                             burden carried by individuals and
                                             society may likely decrease the
                                             prevalence of Minnesota’s costliest
                                             chronic health problems—
                                             an interest Minnesotans all share.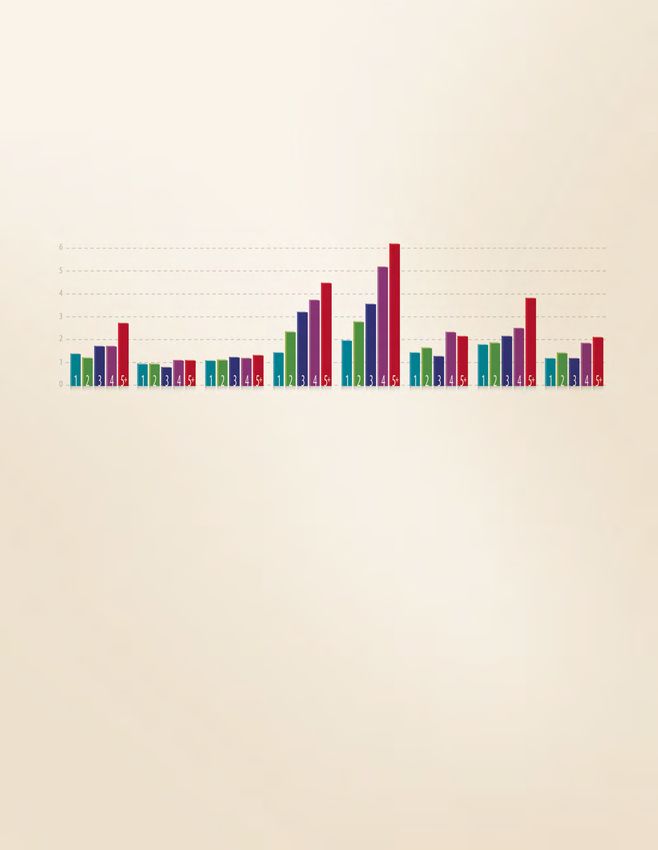
9
                                               AC Es IN MINNES OTA
                                                   INTRODUCTION

The brain and child development.

T
       he science of brain development provides an explanation of the mechanisms through which
       experiences occurring before the age of 18 impact adult health and well-being. Over the
       course of a lifetime, a person’s brain develops as a result of the complex, ongoing interaction
between his or her           genes
                               and the                     environment
                                                              . While some aspects of brain development
are determined by genes, experiences influence the strength of connections between brain regions.
          Newborn babies already have the vast majority of brain cells they will ever need, but the
pathways that allow brain cells to communicate with each other continue to develop throughout childhood.
The quality and type of experiences occurring in the first years of life impact the pathways that are formed
between neurons in the child’s brain. Pathways that are rarely used fade, whereas pathways that are used
more frequently grow stronger. Thus, in a safe, secure, and nurturing environment with a stable and responsive
caregiver who is able to help the child cope with stressors, the child learns that challenges are manageable
and those adaptive pathways in the child’s brain grow stronger. If the environment is not safe, and the
child has limited positive interactions with an adult, the child may develop a more vigilant approach to the
world to avoid known and unknown dangers, and those maladaptive pathways in the brain grow stronger.
                                                                                                                                                                                     Providing the right

stress
          In short, a child’s brain is shaped by the environment in which the child is raised, and
this brain architecture will have an enduring influence on how the child responds to new situations and                                                                              conditions for healthy
experiences. For instance, a child who is removed from a maltreating environment may continue to be                                                                                  brain development in
vigilant and wary even if the new environment is not dangerous. Providing the right conditions for healthy                                                                           childhood is critical
brain development in childhood is critical to avoid treating problems at a later age. And intervening early,
before these maladaptive pathways in the brain grow strong and more difficult to alter, is critical.
                                                                                                                                                                                     to avoid treating
National Scientific Council on the Developing Child (2007). “The science of early childhood development: Closing the gap between what we know and what we do.”
                                                                                                                                                                                     problems at a later age.
http://www.developingchild.net/pubs/persp/pdf/Science_Early_Childhood_Development.pdf

How does stress affect the developing brain?

S
      tress in reasonable doses promotes growth                              reacts by producing excess surges in stress                                  protective characteristics, the intensity and
      and brain development throughout                                       hormones, such as cortisol. In childhood,                                    duration of the ACE, and the strength of the
      childhood. Stress is a normal part of                                  persistent and intense stress stemming                                       person’s childhood bond to a stable, responsive,
daily life and learning how to manage stress                                 from ACEs actually influences how the brain                                  and nurturing caregiver, which is particularly
and regulate stress responses is critical to                                 develops, strengthening connections in the                                   important in the early years from birth
a child’s development. However, acute                                        parts of the brain that are associated with                                  through preschool. Throughout childhood,
or prolonged stress can become toxic                                         fear, arousal, and emotional regulation at the                               but particularly from infancy through
to the developing brain and body. ACEs                                       cost of other parts of the brain associated                                  preschool, children depend on sensitive,
can cause toxic stress. Children’s stress                                    with learning and memory. Continuous                                         responsive caregivers to help maintain the
response systems are immature at birth and                                   activation of the stress response system can                                 normal daily rhythm of the stress hormone,
therefore vulnerable to maltreatment and                                     also produce disruptions of the immune and                                   cortisol, and to protect the developing brain
neglect. If the adults in a child’s life are not                             metabolic systems, resulting in a lifetime of                                from being exposed to too much cortisol.
able to buffer the stress or are themselves                                  greater susceptibility to physical illness as
                                                                                                                                                          Center on the Developing Child at Harvard University (2007).
the source of the stress, the child may begin                                well as mental health problems. A person’s                                   “A Science-Based Framework for Early Childhood Policy: Using Evidence to
to experience the world as dangerous and                                     reaction to ACEs depends on the person’s own                                 Improve Outcomes in Learning, Behavior, and Health for Vulnerable Children.”
uncertain. In the face of danger, the body                                   biological stress reactions, the person’s own                                http://www.developingchild.harvard.edu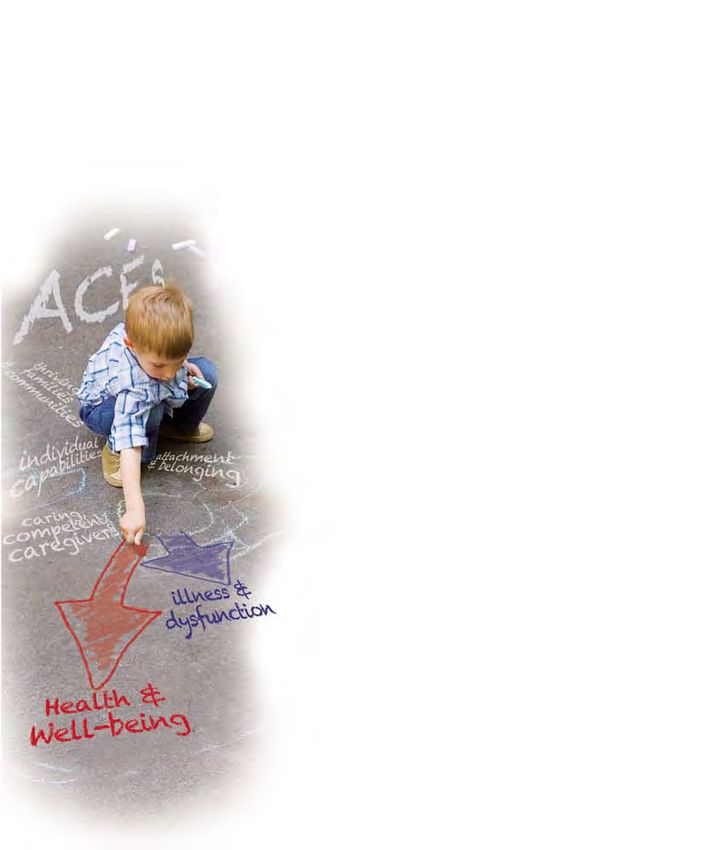
10
                                                                                       AC E s I N M I N N E SOTA
                                                                                       INTRODUCTION

                    Types of Stress.

   ACEs canpositive.                                               Positive Stress               : moderate response
                                                                   associated with brief increases in heart rate and
                                                                                                                                                           50
       cause                                                       blood pressure and mild elevations in cortisol
                                                                   or cytokine levels. Important and necessary

                                                                                                                                                           45
toxic stress.                                                      aspect of healthy development, especially when
                                                                   occurring in the context of stable and supportive
                                                                   relationships, which tend to keep physiological
                                                                   stress responses small and manageable, assisting

                                                                                                                                                           40
                                                                   the child to develop skills in emotional regulation
                                                                   and self-control.
                                                                   E X A M P L E S : Stress in meeting new people
                                                                   or dealing with frustration
                • Meeting

                                                                                                                                                           35
                   new people
                • Frustration
                                                                   Tolerable Stress: associated with

                 tolerable.
                                                                   experiences that could trigger stress responses
                                                                     large enough to disrupt brain development

                                  • Natural Disaster
                                                                       but don’t because they are relieved by
                                                                        supportive relationships that facilitate
                                                                        adaptive coping and thereby restore heart
                                                                                                                                                           30
                                • Death of Loved One                    rate and stress hormone levels to baseline.

                                                                                                                                                           25
                                                                          E X A M P L E S : Death of a loved one
                                                                            or natural disasters

                                                                   Toxic Stress: associated with intense
                                                                   and prolonged activation of the body’s stress
                                                                                                                                                           20
                                           toxic.
                                                                   response system in the absence of the buffering
                                                                   protection of adult support resulting in the
                                                                   disruption of typical brain development

                                                         • Abuse
                                                                   and chemistry.
                                                                   E X A M P L E S : Recurrent child abuse or neglect,
                                                                   severe maternal depression, parental substance
                                                                                                                                                           15
                                                     • Maternal
                                                    Depression     abuse, or family violence
                                             • Substance Abuse
                                               • Family Violence
                                                                   Center on the Developing Child at Harvard University (2007). “A Science-Based
                                                                   Framework for Early Childhood Policy: Using Evidence to Improve Outcomes in Learning,
                                                                   Behavior, and Health for Vulnerable Children.” http://www.developingchild.harvard.edu
                                                                                                                                                           10
                                                                                                                                                            5
11
                        AC Es IN MINNES OTA
                           INTRODUCTION

                                  Why do some children thrive and others fare less well?

                                 A
                                            dversity is only one part of the equation. Children may also have their own characteristics and
                                            experiences that protect them and help them develop resilience despite exposure to ACEs.
        The presence
                                              Resilience    is positive adaptation within the context of significant adversity. In the face of
of protective factors             adversity, neither resilience nor disease is a certain outcome. Resilience is the result of a dynamic set of
 can often mitigate               interactions between a person’s adverse experiences and his or her protective factors. This interaction
   the consequences               is what determines the developmental path towards health and well-being or towards illness
                                  and dysfunction. No child is magically resilient or invulnerable to ACEs, just as no individual child is
             of ACEs.             automatically doomed in the face of ACEs.
                                             These protective factors can include the individual biological and developmental characteristics
                                  of the child himself, as well as the environmental factors of the family, community, and systems that
                                  mitigate the negative impacts of ACEs. Protective factors help explain how some people who have
                                    sustained a great deal of adversity as children have fared relatively well in adulthood. The presence
                                      of protective factors, particularly safe, stable, and nurturing relationships, can often mitigate the
                                       consequences of ACEs. Individuals, families, and communities can all influence the development
                                         of many protective factors throughout a child’s life that can impact his or her development.

                                              How does resilience develop?
                                               There are multiple pathways to resilience. Resilience researchers continue to refine
                                                understanding about the ingredients and processes involved in supporting resilience.
                                                However, there is agreement about a variety of important individual, family, and community
                                                 conditions that support resilience, including the following protective factors:
                                                   • Close relationships with competent caregivers or other caring adults
                                                     • Parent resilience
                                                       • Caregiver knowledge and application of positive parenting skills
                                                         • Identifying and cultivating a sense of purpose (faith, culture, identity)
                                                           • Individual developmental competencies (problem solving skills, self-regulation, agency)
                                                           • Children’s social and emotional health
                                                          • Social connections
                                                         • Socioeconomic advantages and concrete support for parents and families
                                                       • C ommunities and social systems that support health and development, and nurture human capital
                                                           Protective factors help a child feel safe more quickly after experiencing the toxic stress of
                                                    ACEs and help to neutralize the physical changes that naturally occur during and after trauma.
                                                   If the child’s protective networks are in good working order, development is strong even in
                                                  the face of severe adversity; if these major systems are impaired, either before or after the ACE,
                                                 then the risk for developmental problems is much greater, particularly if the environmental
                                                hazards are prolonged. (Masten, A. S. (2001). Ordinary magic: Resilience processes in development. American psychologist, 56(3), 227.)
                                               In summary, even the negative consequences of toxic stress from ACEs can be buffered with the
                                              support of caring adults and appropriate intervention and support.
12
AC E s I N M I N N E SOTA
THE ACE STUDY
THE ACE STUDY.
T
he Adverse Childhood
Experiences Study was
conducted between 1995-
1997 by Drs. Robert Anda and
Vincent Felitti. The study was
based on the compiled data
of over 17,000 adult patients
who were enrolled in the
Kaiser-Permanente insurance program.
Study participants, who were primarily
ACE FACTS. middle-class and well-educated, were mailed
a detailed questionnaire two weeks after going
1995 to1997
Years Study Conducted.
through a health-screening examination.
The survey contained questions about early
childhood experiences, physical and mental
health history, and adult health behaviors.
17,000
These results were then matched with the
clinical record from the recent visit.
While enrollment in the study was closed
Adults Contributed Data.
at the end of 1997, the study participants
continue to be monitored for health
100
Published Studies on ACEs.
outcomes. More than 100 scientific articles
have now been published about the ACE
study or subsequent related studies done
to add understanding and clarity to these
relationships.
In 1984, the Centers for Disease
Control and Prevention developed the
Behavioral Risk Factor Surveillance System
(BRFSS), a survey to be used by individual
states to determine the status of their residents’
health based on behavioral risk factors.
In all BRFSS surveys, there is a set of core
questions that participating states must use
and thirty-four optional modules.
An optional ACE module was added in 2008.
In 2011, Minnesota became the 18th state
to add the ACE module to the BRFSS survey.13
AC Es IN MINNES OTA
THE ACE STUDY
What is an ACE? The 2011 Minnesota ACE Study.
A T
n adverse childhood experience (ACE) describes a he 2011 Minnesota BRFSS data were collected through interviews with
traumatic experience in a person’s life occurring adults reached at randomly selected telephone numbers. Minnesota
before the age of 18 that the person recalls as an adult. results reflect a dual frame sample design that includes both cellular
The ACE score is a measure of cumulative exposure to and landline telephone numbers. Respondents reached by cell phone
particular adverse childhood conditions. Exposure to any comprised 31 percent of the sample and were selected based on their
single ACE condition is counted as one point. Points are then positive response to three questions confirming Minnesota residency, age
totaled for a final ACE score. It is important to note that the (18 years or older), and that the phone was not used for business purposes.
ACE score does not capture the frequency or severity of any For the landline sample, a census of household members by age and gender
given ACE in a person’s life, focusing instead on the number of was enumerated and one adult was selected at random. The Minnesota ACE
12 34 5 6 7 8 9
ACE categories experienced. In addition, the ACE categories sample is comprised of 15,266 respondents of which 13,520 responded to
used in the ACE study reflect only a select list of experiences. the ACE module of questions.1
Physical Sexual Emotional Mental Problem Illegal Divorce Domestic Incarceration
Abuse Abuse Abuse Illness Drinking Drug Separation Violence
Use
ACE Categories used in the Minnesota BRFSS Survey. The Minnesota ACE questions are consistent with those that
1 Physical abuse. have been used in other states over the course of the last several years.
There are 11 questions that yield 9 ACEs in the module that assesses the
2 Sexual abuse.
occurrence of adverse experiences prior to the age of 18. The ACE categories
3 Emotional abuse. include events relating to emotional, physical, and sexual abuse and adverse
4 Mental illness of a household member. household situations including mental illness, incarceration of a household
5 Problematic drinking or alcoholism of member, parent separation or divorce, presence of drug or alcohol abuse, or
a household member. exposure to violence between adults.
6 Illegal street or prescription drug use by
a household member.
7 Divorce or separation of parents. 1
All findings presented in this report are from the 2011 Minnesota BRFSS survey unless otherwise indicated.
Researchers calculated the 95% confidence interval for 0, 1, 2, 3, 4, and 5 or more ACE categories for the total population
8 Domestic violence between adults in the household.
and by gender. These findings coincided with those reported by the combined Five State estimates of confidence interval,
9 Incarceration of a household member. i.e., there is a statistical significance between 0, 1, 2, 3, 4, and 5 or more ACEs. The only exception found was that there
was no difference between the 3 ACE score and the 5-or-more ACE score. This finding was true doing the analysis
by gender as well.
Note: two categories from the original ACE study, physical
and emotional neglect, were not included in the BRFSS survey.
In addition, drug and alcohol use by someone living in the
home were counted as separate ACEs in the Minnesota BRFSS
analysis and not combined into one as in the BRFSS analyses
conducted in other states.14
AC E s I N M I N N E SOTA
MINNESOTA ACE FINDINGS
A
MINNESOTA ACE FINDINGS..
s documented in the initial ACE study and in other states’ ACE
studies, adverse childhood experiences have a lifelong impact
on the physical health, mental health, and social well-being of
Minnesotans. This study confirms that a majority of Minnesotans
are experiencing ACEs in childhood. As in other states, ACEs tend to
occur together. This study also confirms that there is an association
between the number of ACEs and health and social outcomes so
that the more ACEs a person has the greater the effect on physical
and mental health and social well-being. In this section, a summary of ACEs in Minnesota by
select socioeconomic factors is provided. This helps to understand who experiences ACEs
ACEs are common
in Minnesota, the prevalence of ACEs being reported, and the types of ACEs experienced in
among Minnesota childhood. In the following section, the ACE scores and the association of these scores with
adults. selected health conditions and risk behaviors are presented.
Prevalence of ACE Variables.
ACEs are common among Minnesota adults. Over half (55 percent) of the adults
responding to ACE module questions reported experiencing at least one
ACE in childhood.
Table 1 shows the distribution of ACE scores for all Minnesotans and by
gender. Table 1 indicates that 21 percent of Minnesotans reported three
or more ACEs and 8 percent reported five or more ACEs.
ZeRO
aCes
Consistent with other states’ results, women experience even greater
numbers of ACEs. In Minnesota, 57 percent of women and 54 percent
ONe of men reported experiencing one or more ACE in childhood. Almost
OR MORe
aCes a quarter of women (24 percent) reported experiencing three or more
ACEs in childhood compared to 19 percent of men.
Table 1: Prevalence of aces in minnesota MINNESOTA 2011
Number of ACeS (Percent)
0 1 2 3 4 5+
All Minnesotans 45 22 12 8 5 8
Men 46 23 12 7 5 7
Women 43 22 12 9 6 9
Source: Minnesota Department of Health, Center for Health Statistics, BRFSS Due to rounding, the numbers may exceed 100%.15
AC Es IN MINNES OTA
MINNESOTA ACE FINDINGS
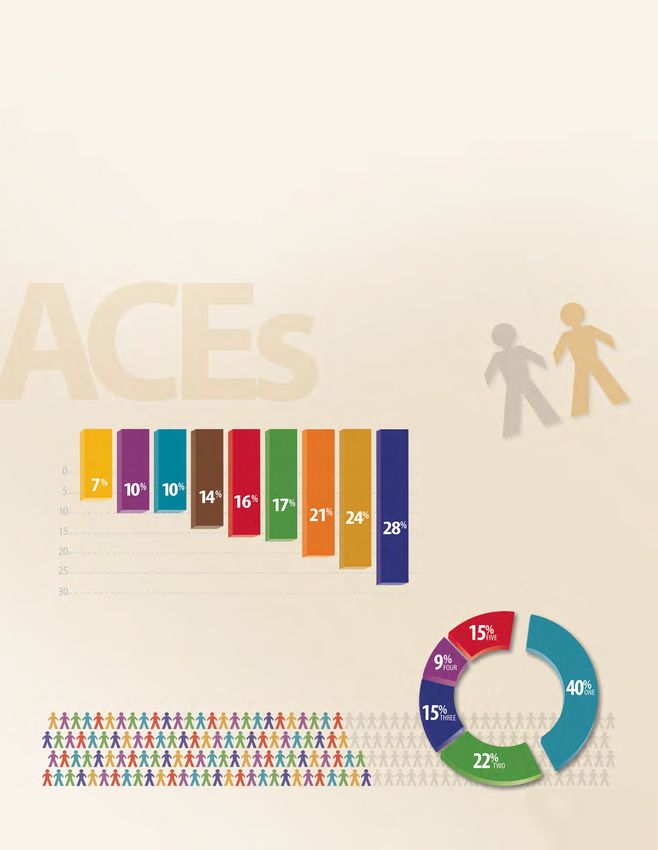
Co-Occurrence of ACEs in Minnesota Adults.
ACEs also tend to occur together, meaning Table 2: Distribution of aces in Minnesota MINNESOTA 2011
that those Minnesotans reporting one ACE Due to rounding, the numbers may exceed 100%.
ACEs often
are more likely to report other ACEs.
This is consistent with the ACE findings occur together.
from other states. Table 2 illustrates that
of the 55 percent of Minnesota adults
with one ACE, 40 percent have one ACE
and 60 percent have two or more ACEs.
This graph also shows that among those
having at least one ACE, 15 percent
have five or more ACEs.16
AC E s I N M I N N E SOTA
MINNESOTA ACE FINDINGS
Definitions of ACE Experiences.
T
he Centers for Disease Control and Prevention (CDC) define adverse child experiences
as experiences that represent health or social problems of national importance
including abuse and household dysfunction. Abuse includes physical, sexual, and
emotional abuse in childhood. Household dysfunction includes growing up with domestic
violence, substance abuse or mental illness in the home, parental divorce or separation,
and incarceration.
abuse.
Physical. Sexual. Emotional.
Parent or adult in home Anyone at least 5 years Parent or adult in home
ever hit, beat, kick, older than you or an adult, ever swear at you,
or physically hurt you in ever touch you sexually, insult you, or put you
any way once or more than try to make you touch down more than once.
once. (Does not include them sexually, or force you
spanking.) to have sex once or more
than once.
household dysfunction.
Mental Illness. Substance Divorce or Domestic Incarceration.
Lived with Abuse. Separation. Violence. Lived with
anyone who Alcohol Parents Parents or anyone who
was depressed, Lived with separated or adults in your served time or
mentally ill, anyone who divorced. home ever was sentenced
or suicidal. was a problem slap, hit, kick, to serve time
drinker or punch or beat in a prison,
alcoholic. each other up jail, or other
once or more correctional
Drugs than once. facility.
Lived with
anyone who
used illegal
street drugs
or abused
prescription
medication.17
AC Es IN MINNES OTA
MINNESOTA ACE FINDINGS
Table 3 shows the prevalence TABLE 3: PREVALENCE OF INDIVIDUAL ACEs MINNESOTA 2011
of each ACE among Minnesota
adults. The three most common Incarcerated Sexual Drug Use Witnessed Physical Mental Separated Drinking Emotional
Household Abuse Problem Domestic Abuse Illness or Divorced Problem Abuse
ACEs reported by Minnesota Member in Household Violence in Household Parent in Household
adults include emotional abuse
with 28 percent of Minnesotans 0
indicating that a parent or adult
5 7 % 10% 10% %
in their home swore, insulted or 14 16% 17%
put them down in their youth; 10
21% 24%
28%
PERCENT
living with a problem drinker
or alcoholic (24 percent); and
15
separation or divorce of 20
a parent (21 percent).
25
30
ACE Variables (type) of MN Adults Vary by Gender
T able 4 also indicates that there are
some differences in the type of ACEs
experienced by gender. While there
are similar rates for men and women for
experiencing sexual abuse, witnessing
domestic violence, mental illness in the
household, and problem drinking in the
household as compared to men.
There are some
differences in the
most ACEs, women more often report type of ACEs
experienced
by gender
TABLE 4: COMPARISON OF ACEs BY GENDER MINNESOTA 2011
28% 29
30 %
25 26%
20 19% 22% 21% 22%
PERCENT
16% 15% 16
%
15 14% 13 % 14%
10 10 10 % %
5
7% 6% 6%
0
INCARCERATION SEXUAL DRUG DOMESTIC PHYSICAL MENTAL SEPARATION DRINKING EMOTIONAL
ABUSE USE VIOLENCE ABUSE ILLNESS OR DIVORCE PROBLEM ABUSE18
AC E s I N M I N N E SOTA
MINNESOTA ACE FINDINGS
education
Socio-Demographic Characteristics
marital status
T
he impact of adverse experiences in childhood has long-
standing and significant results. While ACE studies have
employment
provided documentation on long term physical and mental
health outcomes as well as chronic disease and illness, ACEs also
appear to be a factor in numerous socioeconomic indicators like
education, employment status, marital status, living environments,
housing
and those experiencing financial stress.
This section uses the ACE scoring system to examine the
relationship between ACE scores and a number of demographic and
socioeconomic indicators in the Minnesota BRFSS data. The number
financial stress
of ACEs by six of these indicators (education level, marital status,
employment and housing status, and two measures of financial
stress) is examined.
Race/Ethnicity
There is interest in the results of these experiences ethnic groups, it does not health outcomes or health risk
examining whether some racial/ lead to various health outcomes result in a sample of different behaviors by race/ethnicity from
ethnic groups experience ACEs and health risk behaviors as groups that is large enough to the available data.
at a greater rate, if these groups compared to other groups. conduct a detailed analysis of However, the race/
experience greater rates of In response, while the BRFSS this data by race/ethnicity. More ethnicity data that is provided
multiple ACEs as compared to includes a large sample and specifically, we cannot make a indicate that some racial/
other racial/ethnic groups, or if over-sampling of some racial/ connection between ACEs and ethnic groups are more likely to
experience one or more ACEs and
that a greater percent of some
TABLE 5: ACEs BY RACE/ETHNICITY MINNESOTA 2011
Number of Aces racial/ethnic
0 1 2 3 groups4 5+ experience
100 4%
7%
12 %
19%
23 % 0 0 five
0 1 2 3/4 5+ACEs. From the
or more
13% 12% 1 1 BRFSS data, Table 5 provides the
80 9% 17% 2 2 3
12% 17% percent of racial/ethnic groups
23% 22% 3 3/4
60 22% 10
%
that reported ACEs in childhood.
26% 12
%
4 5+
PERCENT
While the sample size for some
24% 18% 5+
40 groups is small, there are some
52% 15% differences by race/ethnicity that
20 46% 35 %
/4 4
29% can be noted. For example,
22%
African Americans and American
0
Indians had a significantly higher
Asian White Hispanic African American American percent of individuals reporting
Black Indian five or more ACEs as compared
4%
5 or more ACEs
7%
5 or more ACEs
12%
5 or more ACEs
19%
5 or more ACEs
23%
5 or more ACEs
to Whites.
Due to rounding, the numbers may exceed 100%.19
AC Es IN MINNES OTA
MINNESOTA ACE FINDINGS
The Minnesota Student Survey
T
he Minnesota Student Survey provides corresponding data on race/ethnicity and adverse experiences in childhood
from a different perspective—Minnesota youth themselves. Since the 1990s, the Minnesota Student Survey, a census
survey of 6th, 9th and 12th grade students in the state, has included questions covering five categories of adverse
childhood experiences discussed in this report including: physical abuse, sexual abuse, witnessing household violence,
alcohol use by a family member that has repeatedly caused problems, and drug use by a family member that has repeatedly
caused problems. (The four categories not included in the Minnesota Student Survey that are included in the 2011 Minnesota BRFSS
ACE questions are emotional abuse, mental illness of a household member, divorce or separation of a parent, and incarceration
of a household member.) The answers to the Minnesota Student Survey questions can be used to form an ACE-type score
that ranges from zero to five. The student survey provides adequate samples of students from different racial/ethnic groups.
The results from the Minnesota Student Survey show that differences among racial/ethnic groups have
been very consistent over the last 15 years. In every year the survey has been administered since 1995, African American,
American Indian and Hispanic 9th graders have been at least twice as likely as White students to report
three or more kinds of adverse experiences. In every year, Asian students have been slightly more likely
than White students to report three or more adverse experiences.
TABLE 6: PERCENT 9TH GRADE STUDENTS REPORTING 3 OR MORE ACEs
SCALE OF 0 - 5 BY RACIAL/ETHNIC GROUP AND YEAR
MINNESOTA 1995 1998 2001 2004 2007 2010
Black/African American 11.2% 14.5% 12.7% 13.3% 11.1% 11.8%
American Indian 14.8% 18.4% 18.7% 18.9% 16.7% 15.5%
Asian 7.9% 7.2% 6.4% 8.5% 7.1% 6.3%
Hispanic 15.6% 15.9% 14.4% 14.5% 12.5% 11.8%
White 5.8% 6.5% 6.2% 6.7% 6.1% 5.4%
While there is no reason to believe that the distribution of ACE scores would vary
by racial/ethnic group, these data sources imply that some racial/ethnic groups
are actually more likely to experience ACEs in childhood and oftentimes,
multiple ACEs. Although much work still needs to be done to explore other kinds
of adverse experiences for racial/ethnic groups including traumatic events
that might impact particular racial/ethnic
groups (e.g., the effects of historical trauma,
immigration), it appears as if
racial/ethnic differences are
evident within the existing data.20
AC E s I N M I N N E SOTA
MINNESOTA ACE FINDINGS
ACEs are more common Education
TABLE 7: NUMBER OF ACEs BY MINNESOTA 2011
0 1 2
among those with less education. Number of Aces
0 0 0 1 2
100 1 1
Sixty-four (64) percent of 5 %
8 %
18 %
2 2
11% 13 %
adults who did not graduate from 80 12% 12%
3 3/4
4 5+
high school have one or more ACEs 12%
60 23% 10% 5+
compared to 55 percent of high school 22%
PERCENT
graduates and 51 percent of
24% /4 4
college graduates (Table 7). 40
20 49% 45% 36%
0
Due to rounding, the numbers may exceed 100%.
COLLEGE HIGH SCHOOL LESS THAN
GRAD GRAD HIGH SCHOOL
ACEs are more common TABLE 8: NUMBER OF ACEs BY Marital Status
Number of Aces 0 1 2
for adults who never married. 0 0 0 1 2
100 6% 1 1
Sixty-three (63) percent of
13% 2 2
12 %
15% 3 3/4
never married adults reported one 80 11% 4 5+
or more ACEs compared to 51 percent
22% 13% 5+
of never married adults (Table 8). 60
22%
PERCENT
/4 4
Never married adults also tend 40
to have multiple ACEs in childhood.
Twenty-eight (28) percent of never married adults had three or 20 49% 37%
more ACEs compared to 18 percent of married adults.
Adults who have never married are more than twice as likely 0
Due to rounding, the numbers may exceed 100%.
to have experienced five or more ACEs as compared to adults
who are currently married; on the other hand, those who have
CURRENTLY NEVER
MARRIED MARRIED
never married are less likely than those who are currently
married to have experienced no ACEs.21
AC Es IN MINNES OTA
MINNESOTA ACE FINDINGS
TABLE 9: NUMBER OF ACEs BY Employment Status ACEs are more common among
Number of Aces0 1 2 3 4 5
unemployed adults.
+
0 0 0 1 2 3/4 5+
100 100
1 1
2 2
8% 3 20% 8%differences in those reporting
Several 20%
80
3 3/4 13% one or13 %
more ACEs were associated
17% 80
% employment status. 17
4 5+
5+ 12% with reported
12
%
60 22% 12 % 60 22%(72) percent of unemployed
Seventy-two 12%adults
PERCENT
/4 4
reported one or more ACEs compared to 57% percent
40 24% 40 24
of those who reported that they were employed with wages.
20 43% 20 Also, unemployed43
%
28% adults more often reported multiple
28% ACEs.
0 0 Thirty-seven (37) percent of unemployed adults and
Due to rounding, the numbers may exceed 100%. 21 percent of adults employed with wages reported three
or more ACEs. The currently unemployed were over 2.5 times
EMPLOYED FOR WAGES UNEMPLOYED*
as likely to have experienced five or more ACEs as currently
employed adults. (Table 9)
* For this study, current unemployment includes respondents
who were out of work for less than one year and more than one year.
TABLE 10: NUMBER OF ACEs BY Housing Status Renters are more likely to report
100
0 0
0
Number of Aces 1 2 3 4 5+
0 1 %2 3/4 5+ 100 ACEs in childhood.
1 1
6 16% 8% 20%
12 %
13 (68) percent of renters
%
80
2 2
11%
3
80 Sixty-eight
3 3/4 17% reported12one 17%
% or more ACEs as compared
4 5+
60 23% 60 22%who owned their housing.
to 52 percent
5+ 13% 12%Also, renters more often
PERCENT
reported multiple ACEs as compared to those who owned their
40/4 4 22% 40 own homes. Thirty-three (33) percent of24
%
renters and 18 percent
48 % of homeowners reported three or more ACEs. Also, considering
20 20 43% those who currently rent %their home are
housing arrangements,
32% 28
more than two times more likely to have experienced five or
0 0
Due to rounding, the numbers may exceed 100%. more ACEs than adults who currently own their own home.
Also, adults who own their own home are the most likely
OWN RENT
to have experienced no ACEs. (Table 10)22
AC E s I N M I N N E SOTA
MINNESOTA ACE FINDINGS
Adults experiencing financial stress more often TABLE 11: NUMBER OF ACEs BY Financial Stress
experienced ACEs in childhood. Worry About Ability to Pay Mortgage or Rent
Number of Aces
0 1 2
0 0 0 1 2
A high percent (76 percent) of adults who “always” or “usually” 100 5%
worry about their ability to pay mortgage or rent experienced one or 20 % 1 1
9 % 2 2
more ACEs in childhood as compared to those who “never” 80 10 % 3 3/4
(46 percent) worried about this financial stress. Of those that always 22% 24 %
4 5+
5+
or usually worried about paying their mortgage or rent, forty-four 60
PERCENT
(44) percent experienced three or more ACEs as compared to those 12% /4 4
who never worried (14 percent). Adults who “always” or “usually” were 40 21%
worried or stressed in the past 12 months about having enough 54%
money to pay mortgage or rent were four times as likely to have
20 24%
5 or more ACEs than those who “never” worried
0
about this stressor. (Table 11) Due to rounding, the numbers may exceed 100%.
NEVER USUALLY OR ALWAYS
WORRY ABOUT MORTGAGE WORRY ABOUT MORTGAGE
This pattern is also consistent for another financial stress,
worry about ability to buy nutritious meals, where 79 percent of
adults who “always” or “usually” worried about their ability to buy
TABLE 12: NUMBER OF ACEs BY Financial Stress
nutritious meals experienced one or more ACEs in childhood as
Worry About Ability to Buy Nutritious Meals
Number of Aces 0 1 2
compared to 49 percent of those who “never” worried
100 0 0 0 1 2
about this financial stress. 5% 28 % 1 1
10 % 2 2
Fifty (50) percent of those that always or usually worry about their 80 11% 3 3/4
4 5+
ability to buy nutritious meals experienced three or more ACEs 22% 22 %
60 5+
PERCENT
as compared to 15 percent that never worry about their
ability to buy nutritious meals.
40 10% /4 4
Adults who “always” or “usually” were worried or stressed in the past 51% 19%
12 months about having enough money to buy nutritious meals, are 20
nearly five times more likely to have experienced five or more ACEs
21%
than adults who never had these feelings. Those who “never” were 0
Due to rounding, the numbers may exceed 100%.
worried or stressed about these financial issues are nearly 2.5 times
NEVER USUALLY OR ALWAYS
more likely to have experienced no ACEs than those who “always” WORRY ABOUT BUYING MEALS WORRY ABOUT BUYING MEALS
or “usually” felt this way in the past 12 months. (Table 12)23
AC Es IN MINNES OTA
MINNESOTA ACE FINDINGS
TABLE 13: RATIO OF SES Indicators AMONG THOSE WITH 5 OR MORE ACEs MINNESOTA BRFSS 2011
6
5.6
5
I N C R E A S E D R I S K C O M PA R E D T O N O A C E s
Chart indicates times more likely. 1 represents equal risk to zero ACEs
4 4.0
3 2.7
2.3 2.2 2.5
2
1
0
LESS THAN ALWAYS ALWAYS
HIGH SCHOOL
NEVER
MARRIED UNEMPLOYED
RENT $
WORRIED ABOUT WORRIED ABOUT
EDUCATION NOT OWN
MORTGAGE BUYING FOOD
2.3 times 2.2 times 2.5 times 2.7 times 4.0 times 5.6 times
more likely to have more likely to have more likely to have more likely to have more likely to have more likely to have
5+ ACEs 5+ ACEs 5+ ACEs 5+ ACEs 5+ ACEs 5+ ACEs
than those with a than those than those than those who than those who than those who
High School Married Employed Own Their Do Not Worry Do Not Worry
Education Home About a Mortgage About Buying Food
Table 13 shows the For example, the first bar The largest ratios were for Those that “always” or
ratios for selected in this chart is the ratio financial stressors “worry “usually” worried about
socioeconomic comparing those reporting about paying mortgage being able to buy nutritious
indicators. that they had less than a or rent” and “worry about food were over 5.0 times
The ratio is high education to high being able to buy nutritious likely to have five or more
computed by school graduates for those food”. Those that “always” ACEs as compared to those
dividing an that reported five or more or “usually” worried about that “never” worried about
indicator by another ACEs in childhood – paying their mortgage or this stressor.
indicator serving as those with less than a high rent were 4.0 times more
a baseline. school education were likely to have five or more
Table 13 provides 2.3 times as likely to have ACEs than those that
both the indicator five ACEs as compared to “never” worried about this
and baseline high school graduates. financial stressor.
indicator.24
AC E s I N M I N N E SOTA
MINNESOTA ACE FINDINGS
Minnesotans reporting activity limitation TABLE 14: NUMBER OF ACEs BY Disability Status
0 1 2
or use of special equipment for disability status 100
Number of Aces
0 0 0 1 2
reported more ACEs in childhood. 7% 13% 1 1
12% 2 2
80 12% 16% 3 3/4
The BRFSS includes two questions to determine disability status 4 5+
among respondents. The first question asks about whether the 60 22% 12% 5+
PERCENT
respondent is limited in any way in any activities because of 22%
/4 4
physical, mental, or emotional problems. The second question 40
asks if the respondent has health problems that require the use 47%
of special equipment such as a cane, a wheel chair, a special bed, 20 37%
or special telephone. Any “yes” responses are included in the
“limitations/special equipment use” group. 0
Due to rounding, the numbers may exceed 100%.
NO LIMITATIONS LIMITATIONS
Table 14 provides a view of these results by the number of ACEs OR SPECIAL EQUIPMENT
in childhood reported. Minnesotans with “limitations/uses special
equipment” in activities (63 percent) are more likely to report ACES
as compared to 53 percent of Minnesota adults
with “no limitations.”
Table 14 also confirms that multiple ACEs have a graded effect
on disability status. For those reporting three or more ACEs,
29 percent reported limitations/use of special equipment while
19 percent reported no limitations. A higher percent of those
reporting five or more ACEs also indicated limitations/use of
special equipment in activities, more often than no limitations.25
AC Es IN MINNES OTA
MINNESOTA ACE FINDINGS
Health Conditions and ACEs
T
he stressful experiences included under the broad
concept of adverse childhood experiences can ACEs can affect an
cause trauma and suffering for the child and
everyone in the family. For this reason alone, society
individual’s health
has an interest in reducing the prevalence of these and well-being
experiences. The concept of ACEs has additional power years or decades after
asthma
and importance because of its association with an
those experiences
individual’s health and well-being years or decades after
those experiences occurred. In this section, we discuss the occurred.
associations between ACEs and key health indicators.
diabetes Health Status
The number of ACEs are related to an individual’s
obesity
self-reported health status later in life. Minnesotans
reporting five or more ACEs are less likely to view
their health as “excellent” and more likely to rate
it as “fair or poor” compared to persons reporting no ACEs.
For example, 19 percent of adults with five or more ACEs
smoking rated their health as “fair or poor” compared to 9 percent
of adults with no ACEs. (Table 15)
50
45
40 15: NUMBER OF ACEs BY
TABLE Health Status MINNESOTA 2011
drinking
Number of Aces 0 1
35 0 0 0 1
30 1 1
24%
2 2
25
21% 3 3/4
17 19
%
17% 18% 18%
20 4 5+
PERCENT
depression
% 5+
% 13
15 %
11 11% 12%
10 9 % /4 4
5
0 0 1 2 3 4 5+ 0 1 2 3 4 5+
anxiety HEALTH STATUS
FAIR OR POOR
Fair or Poor
HEALTH STATUS
EXCELLENT
Excellent26
AC E s I N M I N N E SOTA
MINNESOTA ACE FINDINGS
Mental Health 50 16: NUMBER OF ACEs BY
TABLE Chronic Mental Health MINNESOTA 2011
Number of Aces 0
45
0 0 0
ACEs are powerfully associated with 40 1 1
indicators of mental health issues later 35 36% 2 2
in life, and the higher the ACE score, 30 30% 31% 3 3/4
4 5+
the more likely adults are to report 25 26% 26% 5+
depression or anxiety in adulthood. PERCENT
The percentage of adults who report that
20 19% 18% /4 4
they have ever been diagnosed with
15
12
% 14 %
a depressive or anxiety disorder rises
10
8% 10%
steadily and rapidly as the number of
5 5%
adverse childhood experiences increases. 0 0 1 2 3 4 5+ 0 1 2 3 4 5+
For example, 36 percent of adults with DEPRESSION ANXIETY
an ACE score of five or more have been DEPRESSION ANXIETY
diagnosed with depression, compared to
only 8 percent of those with an ACE score diagnosed with an anxiety disorder, hold true for both males and females.
of zero. Similarly, 31 percent of adults with compared to only 5 percent with no
an ACE score of five or more have been ACEs. (Table 16) These strong associations
Chronic Health Conditions
The pattern of associations are more than twice as likely only at the highest levels of of adults who have been
between adverse childhood to have been diagnosed with adverse childhood experiences. diagnosed with diabetes
experiences and chronic asthma, compared to adults However, the percentage of appears to change very little
health conditions later in life reporting no ACEs (22% to adults who are obese increases no matter how many ACEs
is not so clear cut. Adults who 8%). Table 17 shows that the only slightly as the ACE score have been reported.
reported five or more ACEs association becomes strong increases, and the percentage
50
45
TABLE 17: NUMBER OF ACEs BY
40
Chronic Health Conditions MINNESOTA 2011
Number of Aces 0
35
32% 0 0 0
30 29 28%% 1 1
26% 27% 2 2
25
22% 23% 3 3/4
4 5+
PERCENT
20
5+
15 14% 14%
11 10
% %
8% 7% 7% 7% 6% 8% 8%
10 /4 4
5
0 0 1 2 3 4 5+ 0 1 2 3 4 5+ 0 1 2 3 4 5+
ASTHMA DIABETES OBESITY
ASTHMA DIABETES OBESITY27
AC Es IN MINNES OTA
MINNESOTA ACE FINDINGS
Health Risks and ACEs
A
dverse childhood experiences are also associated with key health risk indicators such as
smoking and chronic drinking as adults. ACE related
The percentage of adults who are current smokers rises from 11 percent for adults with no ACEs to
studies have
42 percent for adults with five or more ACEs. The smoking rate rises most sharply when the number identified
of ACEs reaches five or more. Many studies have documented the strong links between mental health strong links
problems and smoking, and the data suggests the possibility that adverse childhood experiences may
between
underlie both.
high ACEs
and chemical
dependency.
TABLE 18: NUMBER OF ACEs BY
50 Health Risk Behaviors MINNESOTA 2011
Number of Aces 0 1 2 3 4 5+
45
42%
0 0 0 1 2 3/4 5+
1 1
40 2 2 3
3 3/4
35 4 5+
30 28% 5+
25 24%
PERCENT
/4 4
20 20 21%
%
15 14% 13%
10 9% 10% 8% 11%
5
6%
0 0 1 2 3 4 5+ 0 1 2 3 4 5+
CHRONIC DRINKING CURRENT SMOKING
CHRONIC DRINKING CURRENT SMOKER
Chronic drinking does not increase when the number of ACEs is in the low to middle range, but then
rises sharply among those adults reporting four or more ACEs. (Table 18) Other ACE related studies
have identified strong links between high ACEs and chemical dependency.
6% 13%28
AC E s I N M I N N E SOTA
MINNESOTA ACE FINDINGS
Disparity Ratios
D
isparity ratio patterns illustrate the graded effect While there is definite increased risk of asthma for those with
of ACEs on health conditions and behaviors. five or more ACEs, there is no clear pattern for four or fewer ACEs.
Tables 19 & 20 shows the association between ACEs and There is also a clear increase in reported chronic drinking for
chronic health conditions later in life. Disparity ratios are computed those with four or more ACEs; however, the association between
by dividing the percent of respondents with one or more ACEs one to three ACEs and reported chronic drinking is less clear.
by the percent of respondents with no ACEs. Tables 19 & 20 further
illustrates that there are associations between increases in ACEs TABLE 19: NUMBER OF ACEs BY Increased Risk MINNESOTA 2011
and selected health conditions. The risk for anxiety, depression RATIO TO 0 ACEs
and smoking increases as the numbers of ACEs increases. CHRONIC CONDITIONS 1 2 3 4 5+
In fact, the likelihood of depression goes from 1.5 (one ACE) to Asthma 1.4 1.3 1.8 1.8 2.8
4.5 (5 or more ACEs). In other words, a person with 5 or more ACEs Diabetes 1.0 1.0 0.9 1.1 1.1
Obesity 1.1 1.2 1.3 1.2 1.4
is 4.5 times more likely to be depressed than a person with
Depression 1.5 2.4 3.3 3.8 4.5
no ACEs. The stepwise increase is not as evident for obesity and Anxiety 2.0 2.8 3.6 5.2 6.2
diabetes. The increased risk for diabetes ranges from 1.0 for one Chronic Drinking 1.5 1.7 1.3 2.3 2.2
ACE to 1.1 for five or more ACEs. This means that a person with Current Smoker 1.8 1.9 2.2 2.5 3.8
one ACE is at equal risk for diabetes as a person with no ACEs. Health Status Fair or Poor 1.2 1.4 1.2 1.9 2.1
TABLE 20: Increased Risk* OF CONDITION/BEHAVIOR WHEN ACE IS PRESENT MINNESOTA 2011
Number of Aces 0 1
*Increased risk = percent with chronic condition (1 or more ACEs)/percent with chronic condition (No ACEs)
0 0 0 1
7 1 1
2 2
3 3/4
6 4 5+
5+
I N C R E A S E D R I S K C O M PA R E D T O N O A C E s
Chart indicates times more likely. 1 represents equal risk to zero ACEs
5
/4 4
4
3
2
1
0 1 2 3 4 5+ 1 2 3 4 5+ 1 2 3 4 5+ 1 2 3 4 5+ 1 2 3 4 5+ 1 2 3 4 5+ 1 2 3 4 5+ 1 2 3 4 5+
ASTHMA DIABETES OBESITY DEPRESSION ANXIETY CHRONIC CURRENT POOR
DRINKING SMOKER HEALTHYou can also read