AFRICA'S PROSPECTS MACRO, BUSINESS, CONSUMER AND RETAIL INDICATORS - Nielsen

Page created by Emily Bowman
 
CONTINUE READING
AFRICA'S PROSPECTS MACRO, BUSINESS, CONSUMER AND RETAIL INDICATORS - Nielsen
EDITION 6 - QUARTER 4, 2017

   AFRICA’S
   PROSPECTS
   MACRO, BUSINESS, CONSUMER AND RETAIL INDICATORS

Copyright © 2018 The Nielsen Company (US), LLC. Confidential and proprietary. Do not distribute.
                                                                                                   1
SHIFTING
                                LANDSCAPES
                                 SLOW & EXTENDED RECOVERY
                                Sub-Saharan Africa’s prospects improved in 2017 as global financial conditions
                                were more favorable, commodity prices rallied, and inflation slowed helping
                                revitalise household demand. Economic growth predictions, however, remain
                                below pre-crisis averages and conditions are still tough, calling for coping
                                tactics that are attuned to the times. As governments, retailers, manufacturers
                                and consumers continue to adjust to these challenging times, individual country
                                prospects remain in flux with seven countries changing position in the latest
                                Africa Prospects Indicator rankings. The only country remaining firm into
                                Quarter 4’2017 is Cote d’Ivoire, holding steady in first position, although with a
                                smaller advantage.

                                                              OVERALL RANKING TREND
         RAN

                   QUARTER 1’15            QUARTER 3’15           QUARTER 1’16            QUARTER 3’16    QUARTER 2’17    QUARTER 4’17
          K

           1       NIGERIA                 COTE D’IVOIRE          COTE D’IVOIRE           KENYA           COTE D’IVOIRE   COTE D’IVOIRE

           2       COTE D’IVOIRE           KENYA                  KENYA                   COTE D’IVOIRE   KENYA           GHANA

           3       KENYA                   TANZANIA               TANZANIA                TANZANIA        TANZANIA        SOUTH AFRICA

           4       TANZANIA                NIGERIA                GHANA                   SOUTH AFRICA    CAMEROON        KENYA

           5       ZAMBIA                  ZAMBIA                 CAMEROON                GHANA           GHANA           TANZANIA

           6       CAMEROON                CAMEROON               UGANDA                  CAMEROON        SOUTH AFRICA    CAMEROON

           7       UGANDA                  SOUTH AFRICA           NIGERIA                 UGANDA          UGANDA          NIGERIA

           8       GHANA                   UGANDA                 SOUTH AFRICA            NIGERIA         NIGERIA         UGANDA

           9       SOUTH AFRICA            GHANA                  ZAMBIA

                                Ghana moves into second position, the highest rank achieved to date, from
                                continued advancement in the economic and consumer areas. GDP growth is
                                at its highest level in four years and inflation continues to ease to levels last
                                seen in 2013, relieving consumer wallet pressures and allowing for increased
                                spend in store. Consumer confidence is at an all-time high with 48% of
                                Ghanaians feeling that the time is right to buy the things they need and want.
                                79% feel that their personal finances will be in a good/excellent position and
                                69% feel that their job prospects will be good/excellent in the coming year.
                                Whilst retailer prospects still rank lower, the outlook for growth and ease of
                                doing business is improving. In addition, Ghana has continually been ranked as
                                the best country prospect by businesses for successive periods.

Copyright © 2018 The Nielsen Company (US), LLC. Confidential and proprietary. Do not distribute.
                                                                                                                                          2
The region’s two largest economies are leading the comeback in Sub-Saharan
                                Africa’s recovery. In the second quarter of 2017, Nigeria exited a five-quarter
                                recession and South Africa emerged from two successive quarters of negative
                                growth. Economic activity has picked up, albeit amidst growth rates that remain
                                fairly low, as crude oil and metal prices recover. Both countries improved their
                                standing on the overall prospect ranking with improved indicators. South Africa
                                moves into third position and Nigeria rebounds from its previous low, to
                                seventh on the ranking.

                                                          CURRENT RANKING DYNAMICS

                                             OVERALL                  MACRO                 BUSINESS         CONSUMER        RETAIL
         COUNTRY
                                              RANK                     RANK                   RANK             RANK           RANK

         COTE D’IVOIRE                            1                       3                        7               6           1

         GHANA                                    2                       1                        1               4           7

         SOUTH AFRICA                             3                       6                        8               1           3

         KENYA                                    4                       4                        2               2           5

         TANZANIA                                 5                       2                        3               7           6

         CAMEROON                                 6                       8                        6               3           2

         NIGERIA                                  7                       5                        4               4           8

         UGANDA                                   8                       7                        4               8           4

                                South Africa’s retail and consumer prospects are strong as retailers feel
                                progressively more optimistic in their view on growth. Sentiment towards ease
                                of doing business has risen to some of the highest levels to date, and
                                consumer spend in store is increasing, together with a willingness to try new
                                products. The biggest risk is the business outlook which remains weak as a
                                consequence of the political and administrative uncertainty which has slowed
                                structural reforms and constrained private sector investment.

                                                                                      Nigeria’s potential remains mixed.

                                     84%
                                                                                      As consumer sentiment regains
                                                                                      positive momentum, so does the
                                                                                      business outlook. The retail
                                                                                      environment remains extremely
                                     OF NIGERIANS FEEL THAT                           tough, but retailer growth views are
                                     THEIR PERSONAL                                   improving somewhat as inflation
                                     FINANCES                                         eases and shopper spend in store
                                     WILL BE GOOD/EXCELLENT                           recovers.
                                     OVER THE NEXT 12
                                     MONTHS

Copyright © 2018 The Nielsen Company (US), LLC. Confidential and proprietary. Do not distribute.
                                                                                                                                      3
Kenya’s stumble in the ranking continued into Quarter 4’2017, relinquishing
                                another two places to fourth position. Deteriorating macro-economic indicators,
                                weaker agricultural production and poor retail performance added to the woes
                                of the prolonged and disruptive election period. Early indicators for 2018
                                suggest that the economy is on a sounder footing, and the calmer political
                                scene will support a more favorable year ahead.

                                Fading consumer confidence was also impacted by rising inflation in the first
                                half of 2017 due to the drought. While inflation rates levelled out towards the
                                end of 2017, only 23% of Kenyans hold the view that it is currently a
                                good/excellent time to buy the things they need – trailing a year ago by 19%.
                                Consumer sentiment is likely to recover to more optimistic levels, however
                                cautionary consumer actions are likely to continue for the first half of 2018.

                                           WORSENING CONFIDENCE INDICATORS IN KENYA
                                                          % EXCELLENT/GOOD (Q4’17 VS. Q4’16)

                                                                 66%
                                                                                    59%
                52%
                                    42%                                                               42%

                                                                                                                  23%

           JOB                                             PERSONAL                                TIME TO
           PROSPECTS                                       FINANCES                                BUY

                                Weaker consumer trends are also evident for Kenya’s East African neighbours,
                                Uganda and Tanzania, who slip in the overall rankings to eighth and fifth
                                position respectively. Retailers’ views on growth and ease of doing business
                                are similarly at some of their lowest levels to date in both countries, despite
                                fairly steady economic growth. For manufacturers and retailers this points to
                                complex challenges to achieve sustained levels of performance. Those that
                                adapt quickly and are able to meet consumer-driven demand, balance
                                distribution and operational efficiency will succeed.

Copyright © 2018 The Nielsen Company (US), LLC. Confidential and proprietary. Do not distribute.
                                                                                                                        4
PART 1

                                              MACRO PROSPECTS

                                              DISPARATE DISTRIBUTION OF
                                              OPPORTUNITIES
                                              Economic growth turned the corner in Sub-Saharan Africa in 2017 from the
                                              lows in 2016, but was weaker than expected at 2.4%. The region is still
                                              experiencing negative per capita income growth, weak investment and a
                                              decline in productivity output. While the rebound has been led by the sub-
                                              continent’s largest economies, growth rates remain low, as commodity reliant
                                              countries continue to deal with the effects of the earlier price collapse and slow
                                              private investment.

                              ECONOMIC GROWTH – CURRENT VS PRE-COMMODITY PRICE SLUMP
             9.3%

                       8.0%

                                     7.9%

                                                      7.6%

                                                                7.5%

                                                                           6.8%

                                                                                                                                                                1.5%
                                                                                                                                                   1.9%

                                                                                                                                                                             1.2%
                                                                                    4.4%

                                                                                                                                                                                        0.6%
                                                                                               4.1%

                                                                                                            3.4%

                                                                                                                           3.2%

                                                                                                                                        2.9%

                                                                                                                                                                                                               -4.3%
                                                                                                                                                                                                    -1.9%
           GHANA

                                                                                  KENYA

                                                                                                         ZAMBIA
                    RWANDA

                                                  ETHIOPIA

                                                             UGANDA

                                                                                                                                                NIGERIA

                                                                                                                                                                                               NAMIBIA
                                                                                                                                                          SOUTH AFRICA

                                                                                                                                                                         BOTSWANA
                                                                       TANZANIA

                                                                                                                                                                                    ZIMBABWE
                                                                                                                      CONGO (DR)

                                                                                                                                   MOZAMBIQUE
                              COTE D'IVOIRE

                                                                                                                                                                                                            ANGOLA
                                                                                           CAMEROON

                                                                                                 Q4'14            Q4'17

                                              Global financial headwinds and regional macro-economic vulnerabilities have
                                              taken a toll on the resilience of the growth paths for Sub-Saharan Africa’s
                                              countries over the past four years. The crash in commodity prices dealt the
                                              biggest blow as oil, iron ore and other metals account for more than 60% of the
                                              sub-region’s exports. The more resilient states have been those with diversified
                                              economies such as Rwanda, Tanzania and Kenya. Ghana and Uganda are
                                              exceptions where growth has been spurred on by the discovery of new oil
                                              reserves.

Copyright © 2018 The Nielsen Company (US), LLC. Confidential and proprietary. Do not distribute.
                                                                                                                                                                                                                       5
PART 1

                               MACRO PROSPECTS

                                LONG TERM LENSE STILL GLOWING

                                Over the past 20 years, Africa has experienced progressive development in
                                many markets due to a combination of economic, political and social
                                advancement. Economic growth and structural change in Africa’s markets will
                                continue to have a profound bearing on the evolution and advancement
                                expected for consumers, manufacturers and retailers for many years still to
                                come.

                                SSA’s GDP growth for the next five years is set to steadily accelerate with an
                                average annual growth rate of 3.7% (2018-2022). The 12 biggest countries
                                (82,6% of GDP) are set to outpace the SSA average growth rate, with non-
                                commodity dependent states forecast to contribute a greater proportion due to
                                their speed of growth at 5.9%. With opportunities opening up beyond the top
                                three economies, this provides an expanding number of countries and
                                consumers for retailers and manufacturers to tap into.

                                                 SSA GDP AVG. GROWTH (2018-2022): 3.7%

            TOP 12 CY's                                                                   4.9%                     56%►52%
                    TOP 3                    1.7%
                                                                                                                TOP 3 COUNTRIES’
                                                                                                                      SHARE
                  NEXT 9                                                                           5.9%        OF GDP OVER 5 YEARS

               ETHIOPIA                                                                                             7.9%
        COTE D'IVOIRE                                                                                        6.9%
              TANZANIA                              GROWING                                                 6.7%
                UGANDA

                  GHANA
                                                     FASTER                                          6.2%

                                                                                                    6.1%
                  KENYA                                                                             6.1%

                                  TOP 3: NIGERIA, ANGOLA,SOUTH AFRICA | NEXT 9: CAMEROON, CDI, DRC, ETHIOPIA,
                                  GHANA, KENYA, TANZANIA, UGANDA, ZAMBIA

                                Continuing advancement at a country level will attract a more rapid rate of
                                investment, by accelerating the industrial and business foundations to enable
                                change. With improving physical and digital infrastructure, job creation and
                                better personal circumstances, amongst others, the growth trajectories for
                                businesses have the potential to increase exponentially.

Copyright © 2018 The Nielsen Company (US), LLC. Confidential and proprietary. Do not distribute.
                                                                                                                                     6
PART 2

                               BUSINESS PROSPECTS

                                MORE SELECTIVE CORPORATE
                                FOCUS
                                The 2016 fall in commodity prices delivered a significant dose of reality to the
                                “Africa Rising” narrative. Pre-crash, businesses highlighted growth prospects
                                as good/excellent in 35% of 17* SSA countries (scored at 6 or higher out of
                                10). Since then this has dropped to 29% of countries with promising growth
                                prospects. On the counter end of the scale, an equal number (29%) of
                                countries are deemed to be poor business prospects, despite the revival
                                in GDP growth - versus only 6% previously.

                                On average, businesses rate the consolidated SSA growth outlook less
                                favorably, at 5.3 for 2018. This indicates a fair view of growth, and lower
                                expectations than pre the commodity price plunge, when this figure stood
                                at 5.8.

                                                   BUSINESS VIEW ON COUNTRY GROWTH
                                                                                                                         SSA AVG
                                                                                                                          SCORE

       QUARTER 4'2017                        29%                                        41%                        29%     5.3

                                                    POOR                         FAIR              GOOD/EXCELLENT

       QUARTER 4'2015           6%                                   53%                                      35%          5.8

                                *17 SSA COUNTRIES: SOUTH AFRICA, NIGERIA, KENYA, GHANA, TANZANIA, UGANDA, ZAMBIA,
                                COTE D’IVOIRE, CAMEROON, ANGOLA, ETHIOPIA, CONGO (DR), MOZAMBIQUE, ZIMBABWE,
                                BOTSWANA, NAMIBIA, RWANDA.

                                Due to the prevailing tough trading conditions, companies are rationalising their
                                focus to fewer countries that are essential to success. With the exception of
                                Ghana, all of the countries appraised by companies in the Nielsen business
                                survey, have been rated with growth projections as the same or (mostly)
                                deteriorating. The biggest downward shifts in assessment are for the resource
                                intensive economies of Angola, Cameroon, Congo (DRC) and Nigeria. Into the
                                latest quarter, Ethiopia has also been rated less positively due to the political
                                uncertainty and civil unrest that has disrupted economic activity and business
                                operations.

Copyright © 2018 The Nielsen Company (US), LLC. Confidential and proprietary. Do not distribute.
                                                                                                                                   7
PART 2

                                 BUSINESS PROSPECTS

                                   MORE ASSURED BUSINESS
                                   GROWTH ABILITY
                                   On a more positive note businesses scored their own growth expectations for
                                   2018 at more optimistic levels than country growth for 15 of the 17 countries,
                                   except for Cote d’Ivoire and Ethiopia. Contrary to the lower average country
                                   growth expectation over the past two years, the SSA average for own business
                                   growth has remained at 6 – which represents good expectations for corporate
                                   growth.

                                                         OWN BUSINESS GROWTH EXPECTATIONS

            7.0      6.9
                             6.6       6.6         6.6
                                                              6.3        6.3       6.3      6.2          6.2       6.1
                                                                                                                            6.0        5.9
                                                                                                                                                      5.5
                                                                                                                                                                      5.3

                                                                                                                                                                                 4.4
                                                                                                                                                                                          4.2

         EXCELLENT                                                       GOOD                                                                                                             FAIR
             KENYA

                     GHANA

                                                                                                                   ZAMBIA
                              RWANDA

                                                                         NIGERIA

                                                                                   UGANDA

                                                                                                         NAMIBIA

                                                                                                                                                                      ETHIOPIA
                                        BOTSWANA

                                                                                            MOZAMBIQUE

                                                                                                                                       SOUTH AFRICA
                                                   TANZANIA

                                                                                                                            ZIMBABWE

                                                                                                                                                                                           CONGO (DR)
                                                                                                                                                      COTE D'IVOIRE

                                                                                                                                                                                 ANGOLA
                                                              CAMEROON

                                   This affirms an improving ability by companies to adapt and operate within
                                   tougher climates to withstand the conditions and grow. These strategies
                                   required a stronger focus on differentiation, innovation and optimisation. In
                                   2015, businesses were primarily focused on more tactical retail plans, with
                                   Route to Market/Distribution, Retail Execution and Supply Chain Management
                                   featuring as the top 3 priorities. This was not unsurprising, given that Africa’s
                                   retail universes and structures are some of the most complex in the world,
                                   dominated by traditional trade channels. It has been all about getting the
                                   products to the sales environment and reaching the right stores.

Copyright © 2018 The Nielsen Company (US), LLC. Confidential and proprietary. Do not distribute.
                                                                                                                                                                                                        8
PART 2

                               BUSINESS PROSPECTS

                                GETTING TO GRIPS WITH
                                CONSUMER NEEDS
                                Revisiting these priorities two years on, shows that Route to Market/
                                Distribution is still the core focus, but a new second priority has emerged.
                                Consumer Demand enters the top five as a key area of importance for
                                companies.

                                Achieving sustained long term growth, especially amidst tough trading times,
                                calls for a comprehensive understanding of consumers’ reality in order to meet
                                their product needs and generate demand. In SSA the main drivers of product
                                choice are recommendation, affordability and availability, but brand
                                differentiators and success factors extend beyond these attributes. Businesses
                                are clearly signaling that it is no longer enough to simply make a product
                                available in trade. The consumer comes first, followed by the right product
                                in the right place.

                                                           TOP 5 BUSINESS PRIORITIES
        2 YEARS AGO (Q4’15)                                                            CURRENT (Q4’17)

        1                    ROUTE TO MARKET/DISTRIBUTION                              1                 ROUTE TO MARKET/DISTRIBUTION

        2                    RETAIL EXECUTION                                          2                 CONSUMER DEMAND

        3                    SUPPLY CHAIN                                              3                 SUPPLY CHAIN

        4                    INSIGHT & METRICS                                         4                 GROWTH FORECAST

        5                    STOCK MANAGEMENT                                          5                 PRODUCT INNOVATION

                                Innovation now also features as a top five priority.
                                Companies cannot just ‘bring a brand’ that has
                                worked well elsewhere. Success is about more than
                                                                                                   INNOVATION
                                availability and affordability, it is about meeting                GOES HAND IN HAND
                                consumers’ needs across a range of requirements
                                                                                                    WITH FULFILLING
                                                                                                   CONSUMER DEMAND
                                including: convenience, tradition, taste, ease of use,
                                portability, scarcity and accessibility, while also
                                considering health and wellness, aspiration, niche,
                                socially conscious, personalised, and sustainable
                                brands.

Copyright © 2018 The Nielsen Company (US), LLC. Confidential and proprietary. Do not distribute.
                                                                                                                                        9
PART 3

                               CONSUMER PROSPECTS

                                CONSTRAINED CONSUMER
                                CIRCUMSTANCES
                                Consumer spending and mindset indicators have deteriorated substantially
                                post the global financial turmoil in recent years. Before the commodity price
                                crash 29% of SSA retailers felt that spend in store was increasing compared to
                                only 20% currently. The biggest change in outlook has occurred in Nigeria and
                                Uganda where sentiment regarding spend has dropped by 30 and 20
                                percentage points, respectively.

                                               SPEND IN STORE
                                                   % INCREASING

                                             29%                         SOUTH…

                                           26%                           GHANA

                                       21%                               KENYA

                                      19%                                NIGERIA

                                      19%                                CAMEROON

                                     18%                                 COTE…

                                    16%                                  TANZANIA

                                   15%                                   UGANDA

                                                     Q4'14      Q4'17

                                Similarly, the average proportion of consumers willing to try new products has
                                dropped from 47% to 37%. The increase in risk averse behavior is typical of
                                mounting wallet pressures where consumers cannot afford to make costly
                                mistakes. This is evident in all countries measured, with the exception of
                                Ghana, which has increased slightly albeit off low levels.

                                                                                                   WILLINGNESS TO TRY
                                                                                                          % INCREASING

                                                                                                   56%                   SOUTH AFRICA

                                                                                             41%                         KENYA

                                                                                             40%                         CAMEROON

                                                                                          34%                            NIGERIA

                                                                                          33%                            TANZANIA

                                                                                          33%                            UGANDA

                                                                                         32%                             COTE D'IVOIRE
                                       37% (▼10%)                                      27%                               GHANA
                                      WILLING TO TRY
                                      NEW PRODUCTS                                                       Q4'14   Q4'17

Copyright © 2018 The Nielsen Company (US), LLC. Confidential and proprietary. Do not distribute.
                                                                                                                                         10
PART 3

                               CONSUMER PROSPECTS

                                THE PRICE DIVIDE

                                Ghanaian and Ivorian consumers are the least open to trying new alternatives
                                with purchasing decisions rooted firmly in familiarity and trust (Cote d’Ivoire)
                                and affordability (Ghana). Although inflation levels have eased in Ghana, and
                                remain low in Cote d’Ivoire, the absolute cash outlay for these consumers is
                                one of the highest in Africa. A common basket of essential goods costs close to
                                US$23 in Cote d’Ivoire and US$22 in Ghana. Understandably then trying new
                                products at relatively higher costs is a greater risk for these consumers.

                                                        COMMON ITEMS WALLET SPEND

                        LEAST PREMIUM                     PRICE                                    MOST PREMIUM    PRICE

                        UGANDA                               $12.65                                ANGOLA            $42.25

                        TANZANIA                             $13.94                                CONGO (DRC)       $25.49

                        RWANDA                               $14.03                                COTE D’IVOIRE     $22.86

                        MOZAMBIQUE                           $14.05                                GHANA             $21.77

                        ETHIOPIA                             $14.11                                NAMIBIA           $18.33

                       COMMON BASKET CONSISTS OF: 500G FRESH WHITE BREAD, 1KG RICE, 12 EGGS, 1KG CHICKEN,
                       1KG TOMATOES, 1KG POTATOES, 1L REGULAR MILK, 1,5L BOTTLED WATER, 330ML SODA, 1 WAY
                       PUBLIC TRANSPORT TICKET, 1L FUEL, 1 MINUTE PREPAID AIRTIME
                       (NO DISCOUNT/PLAN)

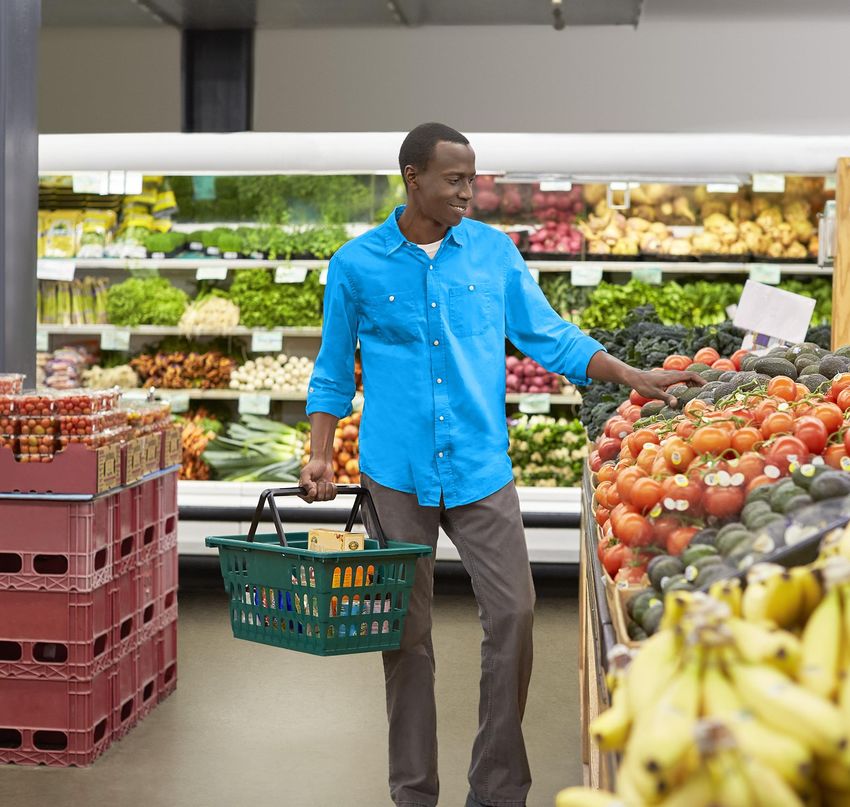
                                On a continent where shopping and consumption is centred around
                                circumstances, manufacturers need to innovate accounting for consumer
                                earnings, ability to purchase, the fact that commuter habits influence where
                                and when they shop, home storage and refrigeration capabilities. Daily or
                                multiple purchases in a day are the norm, based on what consumers are able
                                to spend.

                                As development and personal income capacity improves, consumption ability
                                will follow, opening up opportunities for new products across the price
                                spectrum.

Copyright © 2018 The Nielsen Company (US), LLC. Confidential and proprietary. Do not distribute.
                                                                                                                              11
PART 3

                                                         CONSUMER PROSPECTS

                                                         VOLUMES OF OPPORTUNITY

                                                                                      One of the biggest drivers of consumption
                                                            1 IN 6                    opportunity is the absolute number and growth of
                                                                                      people on the continent. The SSA population is set
                                                            PEOPLE IN THE
                                                            WORLD WILL LIVE           to expand to 15% of the global population by
                                                            IN SSA BY 2025            2025 – an increase of over 260 million people
                                                                                      (equivalent to an entire Middle East region).

                                                         The rate of growth will vary by country, with more mature countries like South
                                                         Africa seeing a slowdown in their growth, but big and small countries alike will
                                                         present volume opportunities.

                                                         From a business perspective, growing populations mean larger workforces and
                                                         more consumers with the ability to spend. Pursuing those consumers who are
                                                         able to spend more than $4 per day equates to one fifth of the SSA population,
                                                         but double (41%) the income. The largest potential in absolute consumers lies
                                                         in Nigeria and South Africa. Cote d’Ivoire currently has the biggest ratio of
                                                         consumers (32%) who are defined as consuming class.

                                                         Into the future there is tremendous potential in Nigeria, Ethiopia, Congo (DRC),
                                                         Kenya, Tanzania and Uganda as more people become part of the consuming
                                                         class. The Kenya and Ethiopia consumer opportunities are likely
                                                         to materialise earlier as they are coupled with highly positive GDP growth
                                                         supporting consumer advancement.

                                                                    BUBBLE SIZE: TOTAL POPULATION – FUTURE POTENTIAL
                                       30

                                       25
         CONSUMING CLASS >$4 PER DAY

                                                                                           NIGERIA
                                       20                                                   20.1M
                                                                                        ZA
                                                                                       16.5M
                                       15                                                                                           KENYA
                                                                                                                                    14.6M
                                                                                                                                                        ETHIOPIA
                                                                                                          DRC                                            12.1M
                                       10                                                                10.0M
                                                                                                                                                            CDI
                                                                                                                                          UG                           GH
                                                                                                                             CAM                            7.6M
                                                                                                                                         6.4M                          6.1M
                                       5         ANG                                                                         5.4M
                                                 4.5M
                                                                                                             MZ ZAM                                         TZ
                                       0                                                                     0.9M 1.6M                                     1.8M

                                       -5
                                            -5      -4     -3     -2      -1      0       1          2           3       4           5          6   7         8    9          10
                                                                                               GDP GROWTH

Copyright © 2018 The Nielsen Company (US), LLC. Confidential and proprietary. Do not distribute.
                                                                                                                                                                                   12
PART 4

                               RETAIL PROSPECTS

                                ROCKY RETAIL ROAD

                                Retailers have been adversely affected by the
                                tougher economic times, with a recovery in
                                sentiment yet to be expressed. Their views on
                                country growth and ease of trading reached all
                                time lows in Quarter 4’2017, despite the economic
                                easing and lightening of business and consumer
                                sentiment.

                                The greatest drop in retailer sentiment is reflected in Nigeria, Uganda,
                                Tanzania and Kenya, which show double digit declines pre versus post crisis.

                                                 EASE OF DOING BUSINESS - % IMPROVING

                                                                                                                    36        38
                   28                                                                       31
                                                                         23                               21             8
                                     18                14                                                       5

                                                 -16               -14                               -3
                               -21                                                     -8
             -27

             NIGERIA           UGANDA            TANZANIA            KENYA          CAMEROON          COTE      SOUTH        GHANA
                                                                                                     D'IVOIRE   AFRICA

                                                                    Q4'14      Q4'17        CHANGE

                                                                  Ghanaian and South African retailers display the
                                                                  highest levels of confidence in conducting business
                                                                  in the current times, both also reflecting an upward
                                                                  trend in sentiment.

                                                                  In line with this sentiment, both countries have
                                                                  delivered positive retail sales growth (value) and
                                                                  lower levels of inflation, compared to Nigeria and
                                                                  Kenya where retail sales and volumes are
                                                                  declining, together with sentiment.

Copyright © 2018 The Nielsen Company (US), LLC. Confidential and proprietary. Do not distribute.
                                                                                                                                     13
SUMMARY

                               WHAT’S NEXT IN AFRICA?

                                BALANCING THE NOW AND NEXT

                                While conditions remain tough in many African markets and the recent
                                setbacks mean that gains have been less than anticipated, the near and long
                                term horizons still distinctly point to some of the most substantial consumer and
                                retail opportunities around the world. Multinational companies faced with low
                                growth in mature or developed markets will continue to look to Sub-Saharan
                                Africa for growth, but there is no need to wait for further development before
                                these prospects can become a reality. Companies need to think and plan for
                                multiple timelines to access and scale Africa’s opportunities, pioneering their
                                own paths to performance.

                                                                                                    47%
                        COMPANIES WITH
                         A LONG-TERM
                             VIEW
                         OUTPERFORM                                                                 MORE REVENUE
                          THEIR PEERS                                                                  THAN OTHER FIRMS
                                                                                                          (2001 – 2014)
                                                                                                      MCKINSEY & COMPANY

                                Understanding the economic, business, consumer and retail indicators based
                                on the here and now, combined with the outlook for the next 12 months,
                                informs planning in the short to mid term, however there is a growing need to
                                have a more considered future view. Some of the macro drivers of change
                                such as population growth, urbanization and physical and digital infrastructure
                                progress will ease the way for business success, but perhaps the most critical
                                factor will be understanding the evolving lifestyles of Africa’s consumers.

                                The ability to anticipate and change to meet consumers’ existing and new
                                needs is critical. This means that not all products today will be fit for the future
                                - constant, informed and future-focused innovation and capacity building will be
                                key to success. The ADAPTABLE brand will capture a larger share of the
                                prize, today and tomorrow.

Copyright © 2018 The Nielsen Company (US), LLC. Confidential and proprietary. Do not distribute.
                                                                                                                           14
SOURCES &
                                METHODOLOGY
                                MACRO PROSPECTS: represents 17 Sub Saharan Africa countries: South Africa,
                                Nigeria, Kenya, Ghana, Tanzania, Uganda, Zambia, Cote d’Ivoire, Cameroon, Angola,
                                Ethiopia, Democratic Republic of Congo (DRC), Mozambique, Zimbabwe, Botswana,
                                Namibia, Rwanda.
                                GDP size, GDP growth, Core Inflation, Food Inflation, Population and Consumer
                                Spending sourced from World Bank and country specific Central Banks and Statistical
                                Institutions. Common Consumer Basket Spend sourced from Numbeo. Data is updated
                                quarterly, where available, and quoted as per latest quarter available. Where information
                                is published monthly the reading at mid-month of the quarter is used.
                                Methodology: Ranking factored on GDP growth and GDP size, updated quarterly.

                                BUSINESS PROSPECTS: Nielsen survey conducted amongst business executives
                                with responsibility for single or multiple African countries. Edition 6 represents more than
                                130 country level responses from multinational, regional and local manufacturers and
                                retailers in the Consumer Packaged Goods and Telecommunication industries. Two
                                standard questions are fielded bi-annually, and additional issue-based questions are
                                covered for spotlight features.
                                Methodology: Ranking factored on Country Growth View and Own Business Growth
                                View.

                                CONSUMER PROSPECTS: Nielsen survey conducted amongst 6,400 Grocery and
                                Kiosk Traders in eight countries: South Africa, Nigeria, Kenya, Ghana, Tanzania,
                                Uganda, Cote d’Ivoire and Cameroon. Nielsen Consumer Confidence Survey conducted
                                amongst 2,000 respondents in South Africa, Nigeria, Kenya and Ghana. An Online
                                methodology is used in South Africa and Mobile methodology for Nigeria, Kenya and
                                Ghana. Both surveys are conducted quarterly.
                                Methodology: Ranking factored on Consumer Spend in Store and Consumer Trend on
                                Willingness to Try New Products.

                                RETAIL PROSPECTS: Nielsen survey conducted amongst 6,400 Grocery and Kiosk
                                traders in eight countries: South Africa, Nigeria, Kenya, Ghana, Tanzania, Uganda, Cote
                                d’Ivoire and Cameroon. Nielsen monthly Retail Measurement Services (RMS) data,
                                aggregated from a defined basket of categories, analysed by annual rolling quarters.
                                Methodology: Ranking factored on Retailer View of Growth, Ease of Doing Business and
                                Inflation.

                                AFRICA PROSPECTS INDICATOR:
                                The overall Indicator rankings are created from 9 common datasets and 12 weighting
                                calculations to determine the relative indicators for each of the individual dimensions.
                                Methodology: Overall ranking is factored on an equal weighting combination of the 4
                                dimensions, available for the 8 countries where common datasets are available.

                                OTHER REFERENCES:
                                Nielsen Emerging Market Insight (EMI I and II) country reports
                                Nielsen What’s Next Starts Now – Africa report
                                World Bank Africa Pulse Fall 2017
                                Where companies with a long-term view outperform their peers, McKinsey & Company

Copyright © 2018 The Nielsen Company (US), LLC. Confidential and proprietary. Do not distribute.
                                                                                                                               15
ABOUT THE
                                AUTHOR

                                AILSA WINGFIELD
                                Executive Director
                                Thought Leadership
                                Nielsen Emerging Markets

                                Ailsa Wingfield leads thought
                                leadership and foresight initiatives in
                                Nielsen’s global Emerging Markets,
                                with a particular focus on Africa and
                                Middle East.

                                She has over 25 year’s experience,
                                working extensively with clients
                                across developing markets, to
                                uncover and capture opportunities for
                                future growth.

Copyright © 2018 The Nielsen Company (US), LLC. Confidential and proprietary. Do not distribute.
                                                                                                   16
DISCLAIMER
                                This publication has been produced by Nielsen Emerging Markets Thought Leadership.
                                It is distributed for informational purposes only. Nielsen makes no express or implied
                                warranties with respect to any data included in this publication, and expressly disclaims
                                all warranties, including but not limited to, any warranties of accuracy, non-infringement,
                                merchantability, quality or fitness for a particular purpose or use.

                                Other than information sourced from Nielsen, the information contained in this
                                publication has been obtained from sources that Nielsen believes to be reliable, but
                                Nielsen does not represent or warrant that it is accurate or complete. Nielsen is not
                                responsible for the content or performance or security of any third party web site that
                                may be accessed via hyperlink in this publication and any information on such sites are
                                not incorporated by reference.

                                The views expressed in this publication are those of the author(s) and are subject to
                                change, and Nielsen has no obligation to update its opinions or the information in this
                                publication. This publication does not constitute investment advice or take into account
                                the circumstances of those who receive it. This report may not be redistributed or
                                published, in whole or in part, without the express written consent of Nielsen.

                                ABOUT NIELSEN
                                Nielsen Holdings plc (NYSE: NLSN) is a global measurement and data analytics
                                company that provides the most complete and trusted view available of consumers and
                                markets worldwide. Our approach marries proprietary Nielsen data with other data
                                sources to help clients around the world understand what’s happening now, what’s
                                happening next, and how to best act on this knowledge. For more than 90 years Nielsen
                                has provided data and analytics based on scientific rigor and innovation, continually
                                developing new ways to answer the most important questions facing media, advertising,
                                retail and fast-moving consumer goods industries. An S&P 500 company, Nielsen has
                                operations in over 100 countries, covering more than 90% of the world’s population. For
                                more information, visit www.nielsen.com.

                                  THE SCIENCE BEHIND WHAT’S NEXT TM

Copyright © 2018 The Nielsen Company (US), LLC. Confidential and proprietary. Do not distribute.
                                                                                                                              17
You can also read