Ageing populations: We are living longer lives, but are we healthier?
←
→
Page content transcription
If your browser does not render page correctly, please read the page content below
Population Division
                                                                                               UN DESA/POP/2021/TP/NO.2
                                                                                                          September 2021

Ageing populations: We are living longer lives, but are we
healthier? *
Jean-Marie Robine **

 Abstract
 Many indicators point to an increase in the life span of adults in the developed world since the middle
 of the twentieth century. For example, the number of people reaching the age of 100 years has never
 been greater than it is today. These demographic changes raise two main types of questions. The first
 is whether life expectancy in good health can increase as much as total life expectancy or whether
 this increase in longevity comes at the cost of an increase in years of life in poor health and/or
 disability. The second type of question is whether these demographic changes are simply a new
 transition, after the elimination of infant mortality and premature mortality of young adults,
 increasing total life expectancy but without changing the characteristics of human longevity, or
 whether they are more fundamentally the beginnings of a change in the characteristics of human
 longevity, a real revolution in adult longevity. This technical paper does not claim to answer these
 questions but simply to present the demographic and epidemiological data that have been
 accumulating for more than 70 years and that still need to be analysed in order to try to answer these
 new questions.

 Keywords: Human longevity / life expectancy / healthy life expectancy / demographic transitions /
 adult longevity revolution

 Sustainable Development Goals: 3

*
  This paper was prepared as part of a consultancy commissioned by the Population Division of the Department of Economic and Social Affairs,
United Nations. The paper benefitted from comments and suggestions by Lina Bassarsky, Jorge Bravo, Yumiko Kamiya and John Wilmoth.
**
   Research Director, Institut National De La Sante et de La Recherche Medicale (INSERM).

                          Population Division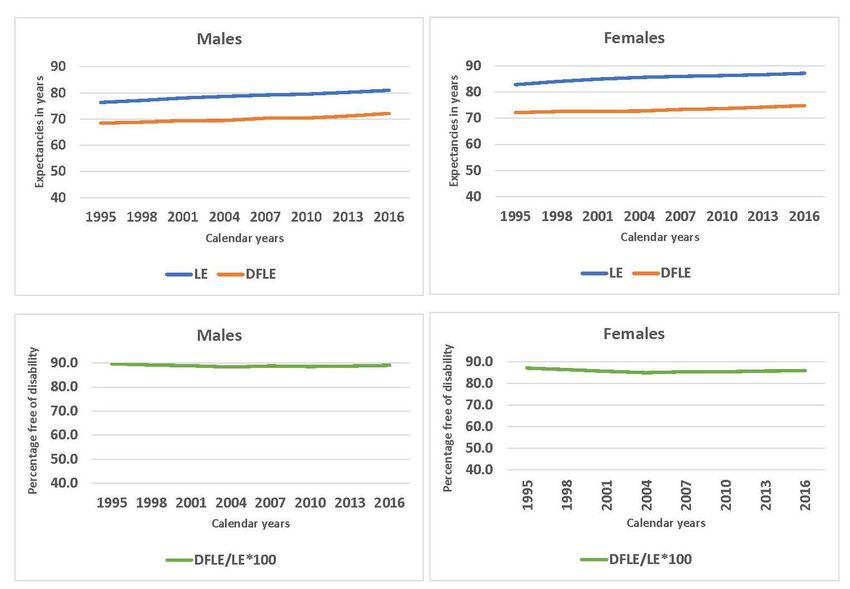
Contents

I. Introduction ................................................................................................................................................................ 1
II. The compression of mortality ................................................................................................................................... 1
III. The decline in mortality at older ages ...................................................................................................................... 5
IV. Health expectancies ................................................................................................................................................. 6
V. The adult longevity revolution ................................................................................................................................ 13
VI. The discussion of the successful ageing model ..................................................................................................... 17
References ................................................................................................................................................................... 19
Annex 1: The tools of epidemiology ........................................................................................................................... 24

The Population Division of the Department of Economic and                                      healthier? United Nations, Department of Economics and
Social Affairs provides the international community with                                       Social Affairs, Population Division,
timely and accessible population data and analysis of                                          UN DESA/POP/2021/TP/NO. 2
population trends and development outcomes. The Division                                       This technical paper is available in electronic format on the
undertakes studies of population size and characteristics and                                  Division’s website at www.unpopulation.org. For further
of the three components of population change (fertility,                                       information, please contact the Population Division,
mortality and migration). The purpose of the Technical                                         Department of Economic and Social Affairs, Two United
Paper series is to publish substantive and methodological                                      Nations Plaza, DC2-1950, New York, 10017, USA; phone:
research on population issues carried out by experts both                                      +1 212-963-3209; e-mail: population@un.org.
within and outside the United Nations system. The series
promotes scientific understanding of population issues                                         This publication has been issued without formal editing. The
among Governments, national and international                                                  views expressed in the paper do not imply the expression of
organizations, research institutions and individuals engaged                                   any opinion on the part of the United Nations Secretariat.
in social and economic planning, research and training.                                        Copyright © United Nations, 2020, made available under a
Suggested citation: Jean-Marie Robine (2021). Ageing                                           Creative Commons license (CC BY 3.0)
populations: We are living longer lives, but are we                                            http://creativecommons.org/licenses/by/3.0/igo/

                                  Population Division                                                                                                                        ii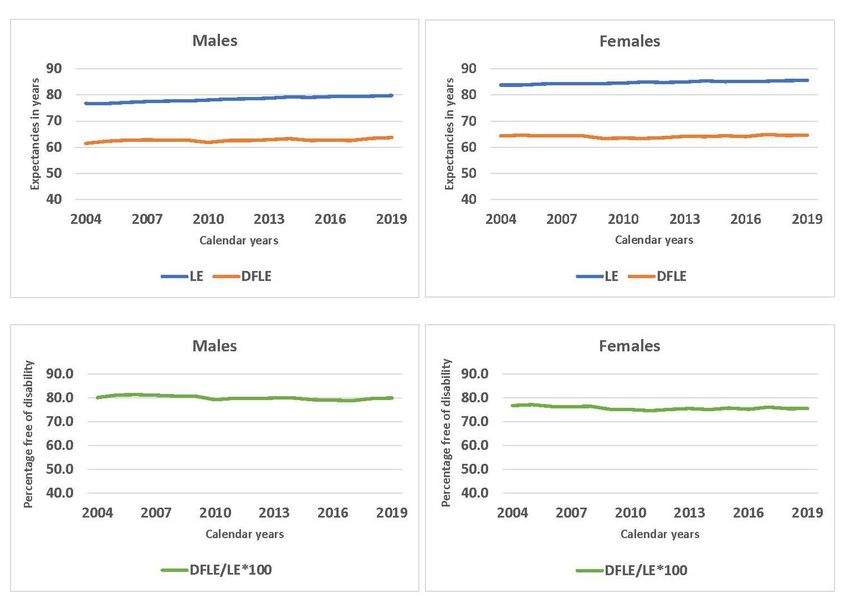
I. INTRODUCTION

     The increased survivorship of human populations to higher adult ages has been well documented in the
developed world since the middle of the twentieth century, a trend that has spread to many developing
countries since. The question arises of whether this constitutes a revolution in longevity, or does it merely
mark a transition to higher levels of life expectancy without fundamentally changing the limits of human
life, which have long been estimated at around 100 years? There are different views or “schools of thought”
on this question, and this paper does not aim to settle that debate. Rather, the paper reviews the evidence
and analysis presented over the last 40 years or so, with a particular focus on a question that is ancillary to
the main debate, namely, whether life expectancy in good health is increasing as much or more than total
life expectancy.

    The paper is organized in five sections. The first deals with the compression of mortality around a
typical age at death. The second deals with the decline in mortality observed at older ages. The third
introduces the concept of healthy life expectancy and the data available to measure it. The fourth section,
entitled “The adult longevity revolution”, presents, with the example of France, the data and indicators
available to assess the extension of human life. Finally, the fifth section discusses the models of successful
and/or healthy ageing that have been proposed in the light of this increased longevity. The data and analysis
presented should be useful to shed light on some aspects of the current debates on the limits of longevity,
health status and the quality of life of the increasing number of older persons in the population.

     In the 1970s, the vast majority of biologists, physicians, demographers and statisticians considered that
the human lifespan was limited to around 100 years. In this regard, they did not differ fundamentally from
earlier authors who did not imagine that life expectancy could increase much more than the values already
reached in Western countries. This vision of a “ceiling” could be explained by two mechanisms, one,
biological, namely the existence of biological limits due to cellular senescence, and the other, medical, the
development of chronic degenerative diseases with age (Robine and others, 2020a). For many biologists in
the 1970s, after eliminating the remaining premature deaths, only the modification of the biological rate of
ageing could significantly increase life expectancy (Hayflick, 1975; Strehler, 1975). This apparent scientific
consensus is likely to have influenced demographers and statisticians in the 1970s in justifying their
technical choice of setting limits for future values of life expectancy, often at values around 80 years
(Oeppen and Vaupel, 2002).

                                   II. THE COMPRESSION OF MORTALITY

    The publication of James Fries’ article “Aging, natural death, and the compression of morbidity” in the
New England Journal of Medicine in 1980, sounded like a thunderclap in the world of medicine and social
sciences. Despite its title, the article deals in reality, more with the compression of mortality than the
compression of morbidity. The author reaffirms the existence of natural mortality more or less confounded
with old age mortality and the existence of a defined limit to human longevity, which should be reached
when life expectancy is 85 years. Eventually, Fries reaffirms that the upper limit of attained ages does not
vary over time. He writes: “For example, adequate data on the number of centenarians have been available
in England since 1837; over this time, despite a great change in average life expectancy, there has been no
detectable change in the number of people living longer than 100 years or in the maximum age of persons
dying in a given year.” (Fries, 1980).

    In fact, Fries was following in the footsteps of the founding fathers of biology and demography, who,
since the eighteenth century, have considered that the longevity of species, including the human species in
particular, is an intrinsic, invariable characteristic of each species. In 1749, Buffon had written: “…if we
take the human race in general, there is virtually no difference in the length of life; a man who does not die
of accidental illnesses lives everywhere for eighty or a hundred years; our ancestors did not live longer, and

                     Population Division                                                                   1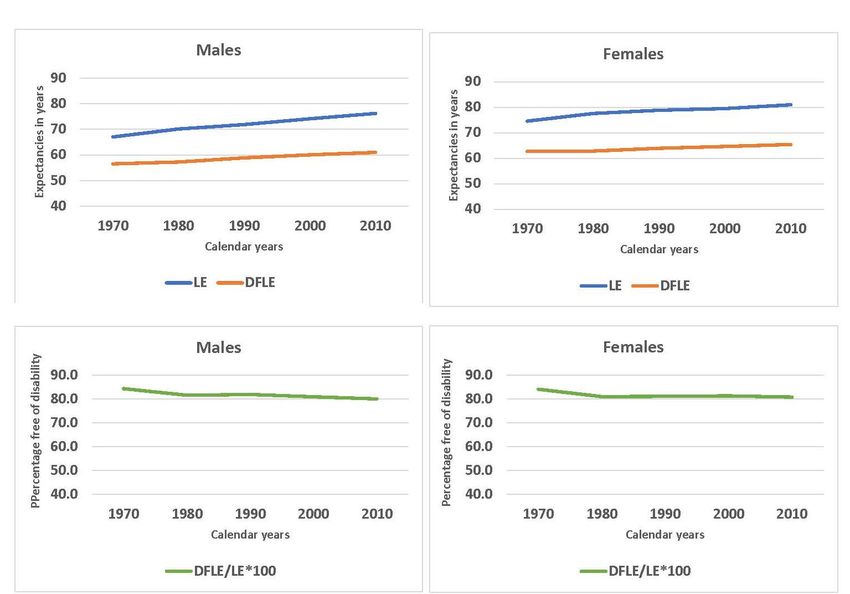
since the century of David this term has not varied at all.” Buffon's ideas were taken up in 1790 by William
Smellie, who spread them widely, particularly in the English-speaking world. It should be noted that in the
eighteenth century, the tools of modern statistics had not yet been developed and that the notions of
distribution, central values (mean, median and mode) and extreme values, were not yet clearly identified.
Thus Buffon could write in 1749 “[that] There are men who have lived beyond the ordinary term; and,
without mentioning those two old men mentioned in the Philosophical Transactions, one of whom lived
one hundred and sixty-five years [i.e., Henry Jenkins], and the other one hundred and forty-four [i.e.,
William Parr], we have a great number of examples of men who have lived for one hundred and ten and
even one hundred and twenty years....” He generalised this proposition in 1777 when he wrote:

           …that there must be in all species, and consequently in the human species as well as in that
           of the horse, some individuals whose life is prolonged to twice the ordinary life, that is, to
           one hundred and sixty years instead of eighty. These privileges of Nature are in truth placed
           far and wide for time, and at great distances in space; they are the big lots in the universal
           lottery of life; nevertheless, they are sufficient to give even the oldest old men the hope of
           an even greater age (Buffon, 1777).

    In fact, when eighteenth and early nineteenth century authors talk about the length of human life, which
they often describe as common or ordinary, it is not known exactly what they are talking about. Are they
talking about the typical longevity of the adult population, what we now call the modal age at death, which
corresponds to the most frequent adult life spans? Is it an ordinary limit of the longest life spans estimated
empirically? This largely explains the different values displayed, which range from 70 to 100 years.

    It was not until the introduction of modern statistical tools into the study of mortality by Wilhelm Lexis,
considered one of the pioneers of modern demography, that the terminology was finally clarified. Lexis, in
1878, distinguished three types of mortality, namely (1) an inverted J-curve immediately following birth,
revealing constitutional defects in children, (2) a normal curve around the late mode of death and, in
between, (3) an intermediate zone corresponding to premature deaths that Lexis saw as accidents
prematurely interrupting adult life trajectories (figure 1).

     According to Lexis, the second distribution represents natural lifetimes that are distributed according
to the law of errors (Lexis, 1878; Kannisto, 2001). It should be noted that Lexis thus follows the classical
tradition that considers that life spans do not vary over time. Centred around 72.5 years, the distribution of
natural life spans in Lexis ranges from 40 to 100 years. This seems to support both the first dictionaries in
the vernacular languages, which set the age of old age at 40 years (Richelet, 1680), 1 the biblical texts which
set the life span of man at 70 years and the works of the eighteenth century, which set the ordinary end of
the human life span at 90 or 100 years, with extreme values around 45 years for the first to die of natural
death and 95 years for the last (figure 1).

     The main contribution of Fries’ paper was to reveal to the scientific and medical community the
phenomenon of mortality compression that took place during the twentieth century. The long time series
mortality data, available in digital form in the Human Mortality Database (HMD 2021) since 1816 for
France, 1835 for Denmark or 1872 for Italy, for example, illustrate this compression of mortality (figures
2, 3 and 4, respectively).

    In concrete terms, said compression involved firstly: (1) a gradual reduction and then a virtual
disappearance of mortality among the youngest (infant and child mortality), (2) then, and in parallel, a
reduction in adult premature mortality and, (3) finally, the postponement of mortality among all adults
(Cheung and others, 2005). It has since been shown that as long as mortality declines more before the age
1
  In Richelet’s dictionary, old age is defined as the time in a man’s life, which is between manhood and decrepitude. This would be an age range
from 40 to 70 years.

                           Population Division                                                                                             2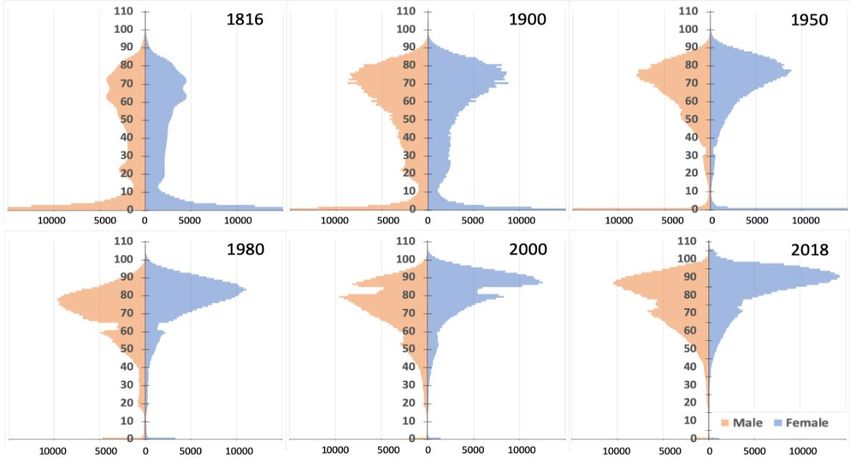
that concentrates the most deaths (i.e., the life-span mode, see box 1) than after that age, the compression
 of mortality around the most frequent life spans will continue (Thatcher and others, 2010).

                  Figure 1. Representation of the distribution of deaths according to Wilhelm Lexis relating to 3 types of mortality:
                                         juvenile mortality, normal mortality and premature mortality

                             Source: LEXIS, 1878.

                  Figure 2. Number of deaths by sex and age in France from the nineteenth to the twenty-first centuries, 1816-2018
Age at death

               Source: HMD, 2021.
Age at death

                        Number of deaths                   Number of deaths                   Number of deaths

                  Source: HMD, 2021.

                                    Population Division                                                                            3
Figure 3. Number of deaths by sex and age in Denmark from the nineteenth to the twenty-first centuries, 1835-2020

                Age at death
                Age at death

                                  Number of deaths              Number of deaths                     Number of deaths

                      Source: HMD, 2021.

               Figure 4. Number of deaths by sex and age in Italy from the nineteenth to the twenty-first centuries, 1872-2017
Age at death
Age at death

                               Number of deaths              Number of deaths                    Number of deaths

                      Source: HMD, 2021.

                                      Population Division                                                                        4
Fries’ proposal immediately led to a debate within the American demographic community, with Myers
and Manton in particular challenging the occurrence of mortality compression, at least on the basis of
American data (Myers and Manton, 1984a and b). This debate also led to an awareness of the decline in
mortality among older persons (Crimmins, 1981; Manton, 1982; Rice and Feldman, 1983). For while Fries
was right about the compression of mortality, he was wrong about the existence of a limit to human
longevity expressed in terms of life expectancy, around the age of 85. Fries had relied mostly on the work
of biologists. Since the 1930s, demographers had concentrated on life expectancy (i.e., the average life
span) and the study of mortality rates, particularly infant mortality, leaving the study of the distribution of
life spans and longevity to biologists (box 1). The latter had noted an increase in life expectancy and a
decrease in old-age mortality, but they did not imagine that an increase in human longevity could have
occurred (Comfort, 1968; Hayflick, 1975; Strehler, 1975). In the words of Alex Comfort, from whom Fries
draws inspiration, “The potential life-span in Palaeolithic man probably resembled our own...” (Comfort,
1964); which echo views expressed in the middle of the eighteenth century (see Buffon, 1749). It is worth
noting that biologists continued to maintain this hypothesis of an invariant lifespan for the human species
for a long time to come, in the absence of a major scientific breakthrough in the biology of ageing leading
to the modification of the biological rate of cellular ageing (Cutler, 1985; Walford, 1985; Hayflick, 1996).
Similar arguments are put forward today by scientists who believe that longevity records cannot increase
much from current records (Dong and others, 2016; Le Bourg and Vijg, 2017; Olshansky, 2018a).
Box 1. Life expectancy versus life span
While demographers have made life expectancy at birth the main indicator of human longevity, biologists have been
more interested in the shape of survival curves and the distribution of life spans, identifying several characteristics
such as the more or less rectangular aspect of survival curves or the age of the oldest survivor (maximum life span)
(Comfort, 1968).
Life expectancy is the mathematical average of all life spans achieved, whether completed in adulthood or interrupted
in childhood.
Animal population specialists, biologists or ecologists, often use the age at which 10 per cent of individuals of a given
birth cohort are still alive as an indicator of the longevity of species. The life expectancy then makes it possible to
measure in a particular context how much of the potential longevity of a species is lived, on average.
In 2001, Vaino Kannisto, going back to the work of Lexis (1878), proposed using the age at which most adults die as
an indicator of human longevity. According to Kannisto, this age, which indicates the most frequent adult life spans,
is a more natural indicator of human longevity than life expectancy at birth because it is typical of adult longevity. 2
III. THE DECLINE IN MORTALITY AT OLDER AGES
Shortly after Fries’ article, Roger Thatcher published his first paper on the number of centenarians in
1981, where he showed that the number of centenarians had increased in England and Wales since 1950.
Studies on centenarians multiplied thereafter. They confirm both the considerable increase in the number
of centenarians in Western countries since the end of the Second World War (Vaupel and Jeune, 1995) and
the decline in mortality at older ages (Kannisto, 1994; Kannisto and others, 1994; Kannisto, 1996). It is the
fall in mortality between the ages of 80 and 100 years that explains most of the increase in the number of
centenarians observed in Western countries (Thatcher, 1992 and 1999; Vaupel, and Jeune, 1995). The
decline in mortality at older ages becomes one of the main drivers of the growth in life expectancy, which
continues to increase over time (Wilmoth, 2000; Oeppen and Vaupel, 2002; Vallin and Meslé, 2009;
2
In statistical terms, this “most frequent” value is the mode of life spans distributed by age (Horiuchi and others, 2013).
Population Division 5Christensen and others, 2009; Vaupel and others, 2021), with relatively few exceptions of temporary
“crisis” mortality years. This persistent rise in life expectancy now extends to the majority of countries
around the world, which are seeing an explosion in the number of centenarians (Robine and Cubaynes,
2017). The swelling numbers of very old people reinforces questions about the quality of the years of life
expectancy gained, which have led to calculations of life expectancy in good health. Thus, as early as 1997
Hiroshi Nakajima, who was at the time Director of the World Health Organisation (WHO), said “In
celebrating our extra years, we must recognise that increased longevity without quality of life is an empty
prize, that is, that health expectancy is more important than life expectancy;” (WHO, 1998).
IV. HEALTH EXPECTANCIES
In his 1982 article Changing Concepts of Morbidity and Mortality in the Elderly Population, Kenneth
Manton puts three scenarios into perspective, (1) that of the compression of morbidity corresponding to
Fries’ proposals, which he describes as optimistic, (2) that of the expansion of morbidity corresponding to
the observations and hypotheses of Gruenberg (1977) and Kramer (1980), which he describes as
pessimistic, and (3) that of a dynamic equilibrium between longevity and morbidity, which he argues for in
his paper (Robine and others, 2020a). In the pessimistic scenario, the decline in mortality is due to a
reduction in the lethality of degenerative diseases without a decrease in their incidence. The direct
consequence is an increase in the prevalence of chronic diseases and disabilities in an ageing population
(see the tools of epidemiology in annex 1).
In the optimistic scenario, the postponement of chronic degenerative diseases to higher ages through
the adoption of better lifestyle habits, even with an increase in life expectancy, may compress the years of
morbidity into a smaller portion at the end of life. In the intermediate dynamic equilibrium scenario, the
decrease in mortality is related to the severity of degenerative diseases. For Manton (1982), there are two
ways to reduce mortality. The first, as noted by Gruenberg (1977) and Kramer (1980), is to reduce the
lethality of degenerative diseases. The second is to slow down the progression of these diseases. In the latter
case, life expectancy increases because the diseases prevalent in the population are less severe. They lead
less often or later to disability or death (box 2). For Manton, the introduction of levels of severity in
prevalent morbidity or disability is essential for understanding the dynamics linking health and longevity
(Manton, 1982).
Box 2. Three theories of health status change
The theory of “compression of morbidity” states that the age of onset of the first infirmity, disability or other morbidity
can be delayed and that if this delay is greater than the increase in life expectancy, then the years of ill health will be
reduced, compressed between the (later) onset and the time of death (Fries, 1980, 1983 and 2003).
The theory of “expansion of morbidity” states that while the decrease in mortality is mainly due to a decrease in the
lethality of diseases, the prevalence of degenerative diseases, including mental illness and disabilities increases sharply
in the population. This theory is based on two papers with evocative titles, The Failures of Success (Gruenberg, 1977)
and The Rising Pandemic of Mental Disorders and Associated Chronic Diseases and Disabilities (Kramer, 1980).
The theory of “dynamic equilibrium” is based on the assumption that mortality and morbidity are interrelated. The
idea is that by slowing down disease processes from the earliest stages, advances in medical care and case management
can both increase life expectancy by delaying fatal outcomes and decrease the severity of prevalent disease states such
as the severity of associated disability for disabling diseases (Manton, 1982).
Population Division 6Health expectancies soon emerged as a tool to answer the questions raised by the increase in life
expectancy and the number of people surviving to very old ages. In particular, health expectancies were
intended to help decide between these three scenarios or theories, and to ascertain whether the increase in
life expectancy is ultimately accompanied by a decrease in morbidity, an increase in the prevalence of poor
health or an equilibrium between the quantity and quality of years lived.
The concept of health expectancies dates back to the 1960s (Sanders, 1964; Sullivan, 1965 and 1971).
They were adopted in 1984 by a working group on the epidemiology of ageing of the World Health
Organisation (figure 5), which proposed that, in addition to life expectancy (LE), life expectancy without
disability and life expectancy without chronic disease should be used (WHO, 1984). In fact, health
expectancies allow the three theories of health status change to be tested. Figure 5 shows three survival
curves.
Figure 5. Three survival curves: Total survival, disability-free survival and chronic disease-free survival - Hypothetical
curves for women in the United States of America in the 1980s
Source: WHO, 1984.
The first, labelled “Mortality”, represents the regular survival curve. By integrating individual life
spans, the area under this curve measures life expectancy (i.e., the average of life spans). The second curve
labelled “Disability” represents the disability-free survival curve. Similarly, the area under this second
curve measures disability-free life expectancy (DFLE). The difference between these first two areas
measures the disability life expectancy (DLE). The third curve labelled “Morbidity” represents the chronic
disease-free survival curve. The area under this third curve measures the life expectancy without chronic
disease (LEwoCD) and the difference with the area under the first curve, the regular survival curve,
measures the life expectancy with at least one chronic disease (LEwCD).
These indicators allow the three theories to be redefined in comparable ways. The simplest way is to
consider the relative change in life expectancy and in health expectancy of interest. Thus, with disability,
for example, one can calculate the disability-free life expectancy. If life expectancy increases
proportionately more than disability-free life expectancy, there is a decrease in the share of disability-free
years in life expectancy. It can therefore be concluded that an expansion of disability in the population is
Population Division 7taking place. If life expectancy increases proportionately less than disability-free life expectancy, there is
an increase in the share of disability-free years in life expectancy. It can therefore be concluded that a
compression of disability has occurred in the population. If life expectancy (LE) increases as much as
disability-free life expectancy, there is no change in the share of disability-free years in life expectancy. It
can therefore be concluded that a dynamic equilibrium between life expectancy and disability has occurred
in the population.
Similarly, with morbidity, life expectancy without chronic disease can be calculated. If life expectancy
increases proportionately more than life expectancy without chronic disease, there is a decrease in the share
of years lived without chronic disease within life expectancy. It can therefore be concluded that an
expansion of morbidity in the population has occurred. If life expectancy increases proportionately less
than life expectancy without chronic disease, there is an increase in the share of years lived without chronic
disease within life expectancy. It can therefore be concluded that a compression of morbidity has occurred
in the population. If life expectancy increases as much in proportion as life expectancy without chronic
disease, there is no change in the share of years lived without chronic disease within life expectancy. It can
therefore be concluded that a dynamic equilibrium between life expectancy and morbidity has occurred in
the population.
Box 3. The calculation of healthy life expectancy
Proposed by Sanders in 1964, the first calculations of healthy life expectancy were made by Sullivan in 1971 for the
National Center for Health Statistics (NCHS), which is now part of the Centers for Disease Control and Prevention
(CDC) of the United States of America.
The Sullivan method, which was developed to calculate disability-free life expectancies introduces the prevalence of
disability by age and sex observed in the population into the standard period life table. This prevalence makes it
possible to qualify the years lived in the table and to distinguish between years lived with and without disability. The
resulting disability-free life expectancies (DFLE) and disability life expectancies (DLE) at each age x satisfy the
following conditions:
LE(x) = DFLE(x) + DLE(x)
The proportion of years lived without disability within life expectancy is calculated as the ratio:
[DFLE(x) / LE(x)] * 100
There are also other methods for calculating health expectancies, in particular multi-state tables which offer a high
degree of mathematical homogeneity with the life table. For an overview of these methods, see Saito and others, 2014.
There are other ways of specifying the three theories of population health status change with these
health expectancy indicators (see Robine and others, 2020a, for an overview). But the simplest and most
commonly used way is the one outlined above for disability. It has made it possible to build up time series
in several countries and thus provide an initial answer to the questions posed (see below). Box 3 details the
calculation of disability-free life expectancy and box 4 details the main dimensions of health.
At the end of the 1980s, REVES, 3 an international research network, was set up by the dozen or so
research teams that had already carried out work on disability-free life expectancy (DFLE) and were
concerned about the comparability of results between countries. Starting with North America and Western
Europe, the network has gradually expanded to all continents (Robine, 1992; Jagger and Robine, 2011;
Robine and Cambois, 2019). Its annual scientific meeting continues to focus on methods for calculating
and measuring health states with the threefold objective of improving the usefulness of health expectancies,
3
Réseau Espérance de Vie en Santé, available at https://reves.site.ined.fr/fr/accueil/a_propos_de_reves/.
Population Division 8the accuracy of estimates and their comparability across countries. REVES has produced two reference
manuals published in 2003 and 2020, respectively (Robine and others, 2003; Jagger and others, 2020).
Box 4. The major dimensions of health: Absence of disease, perceived health, and functioning
The first and most obvious dimension of health is the absence of disease. Not being sick. This is the oldest definition.
This is the medical dimension of health. However, in many cultures and languages, “health” is a rather neutral word
and concept, that requires qualification of being in good or bad health. This leads to the second dimension, the lay or
perceptual dimension of health, which refers to the perceived quality of life and depends on the use of health care.
The third dimension is the functional dimension of health. This is often the demensions preferred by researchers,
embedded in the calculation of life expectancy with or without disability, because it offers a range from the highest
functional performance to the most degraded functioning, with the ultimate limit of death. This dimension allows for
many levels of functioning. For example, if we are interested in the mobility of individuals, we can classify them in
many categories ranging from strictly bedridden to globetrotters. But all three dimensions are important. The first and
third have been the subject of international classifications to detail diseases and different functional states. The There
are other dimensions or definitions of health, with dynamic features. For example, to be in good health is to be able
to fall ill and recover, which refers more to biological notions of physiological reserve, robustness, or, conversely,
frailty. Others are related to the notions of vital energy, the desire to live, and conation. Still others consider the proper
use of our health capital to acquire goods whose value would be greater than health, referring to economic or social
notions of agency. Not all of these dimensions lend themselves to calculations of life expectancy in good health, but
they are all worth discussing (Canguilhem, 1943).
Gradually, national governments and supranational agencies or organizations, such as the European
Commission (Jagger and others, 2008; Boegaert and others, 2018), have adopted health expectancies as key
indicators of economic and social development and have organised themselves to be able to compile time
series of health expectancies and, in particular, disability-free life expectancy (DFLE), the earliest of which
date back to the 1970s for the United States of America (figure 6).
Figure 6. Trends in life expectancy (LE), disability-free life expectancy (DFLE) and the proportion of disability-free years
in life expectancy (DFLE/LE*100) in the United States of America, between 1970 and 2010, by sex
Source: Crimmins and others, 2016.
Population Division 9Figure 7. Trends in life expectancy (LE), disability-free life expectancy (DFLE) and the proportion of disability-free years
in life expectancy (DFLE/LE*100) in Japan, 1995-2016, by sex
Source: Hashimoto and others, 2010 and Ojima, 2019.
Abstracting from the first values calculated for the year 1970, there appears to be a near stagnation in
the proportion of years lived without disability in the United States of America between 1980 and 2010,
despite the steady increase in life expectancy over these three decades (Crimmins and others, 2016). Figure
7 shows a similar situation in Japan, although the period covered is shorter, covering some 20 years between
1995 and 2016 (Hashimoto and others, 2010; Ojima, 2019) and figure 8 shows a largely identical situation
for France, but for an even shorter period covering only about 15 years, from 2004 to 2019 (Deroyan, 2019
and 2020). France, like several other Western European countries, has calculations dating back to the 1980s,
but since 2004 the calculations have been coordinated by the European Commission and involve 31
European countries including those of the European Union, using the same standardised disability indicator
(Jagger and others, 2008; Boegaert and others, 2018).
There are many ways to measure the prevalence of disability in a population. Disability has already
been the subject of two international classifications coordinated by the World Health Organisation (WHO,
1980 and 2001). The main levels (or dimensions) articulated by these classifications are (1) impairments,
which are measured at the organ level, (2) functional limitations, which are measured at the level of major
functions such as hearing, walking or understanding, through tests dealing with specific actions or
problems, (3) activity restrictions, which are measured through day-to-day and social roles which can be
performed by various combinations of actions and finally (4) disadvantages, which involve a comparison
with others, in this case those who do not have a disability or at least the disability under consideration.
Calculations of disability-free life expectancy have been carried out with all these dimensions, but the most
common ones focus, like the three curves presented above, on activity limitations or restrictions. These
calculations require data from population-based surveys because only the individual can indicate whether
Population Division 10he or she is limited or restricted in his or her activities in total. The underlying notion is that the quality of
life depends on the social participation of individuals and that detriments to full social participation are
activity restrictions to basic and social roles, such as eating, sleeping, going to school, working, having and
raising children, having leisure and a social life, etc. The European indicator, the Global activity limitation
indicator (GALI) refers to activities that people usually do without further specification (Carvalho Yokota
and Van Oyen, 2020; Bogaert and others, 2018).
Figure 8. Trends in life expectancy (LE), disability-free life expectancy (DFLE) and the proportion of disability-free years
in life expectancy (DFLE/LE*100) in France, between 2004 and 2019, by sex
Source: Deroyan, 2019 and 2020.
It is important to note that the terminology has changed over time. What was identified and designated
as deficits in the 1980s (impairments, functional limitations and activity restriction) are now identified and
designated in terms of aptitudes (intrinsic capacity and functional ability) by the WHO (WHO, 2015), but
the actual content and intention are the same. WHO website states that “Functional ability is about having
the capabilities that enable all people to be and do what they have reason to value. This includes a person’s
ability to: meet their basic needs; learn, grow and make decisions; be mobile; build and maintain
relationships; and contribute to society.” WHO acknowledge that “Functional ability consists of the
intrinsic capacity of the individual, relevant environmental characteristics and the interaction between
them” (WHO, 2020).
The three data series presented above in figures 6-8 covering 3 continents (North America, Asia and
Europe) strongly suggest that the increase in life expectancy in recent decades has been accompanied by a
proportional increase in disability-free life expectancy (DFLE), with the number of years lived without
disability as a share of total life expectancy remaining fairly constant. These results do not support the
theory of “morbidity expansion” or of the theory of “morbidity compression” but favour a “dynamic
equilibrium” between longevity and health. In fact, all life spans are increasing, life expectancy without
Population Division 11disability as well as life expectancy with disability, in roughly the same proportion. The implication of such
a result is that, while on the one hand, an increase in life expectancy in good functional health should be
welcome, there should also be concerns about the increase in the number of years lived with disabilities.
Robine and others (2020a), reviewed all the studies available across the world on trends in health
expectancy, in particular, disability-free life expectancy (DFLE). In Northern America and Europe the
countries studied were: the United States of America since 1970, France, Italy, Norway, Spain and Sweden
since the 1980s, Belgium, the Netherlands and the United Kingdom of Great Britain and Northern Ireland
since the 1990s and Denmark since the 2000s. Asia, China, Japan and Singapore were studied since the
1990s. Australia was also included since the end of the 1990s.
From that review, five general results can be extracted (Robine and others, 2020a and 2020b). First,
contrary to expectations in the 1970s and 1980s, life expectancy has continued to increase in all countries
studied, suggesting that increasing longevity cannot be attributed only or mainly to major biological
discoveries. In all countries, women’s life expectancy remains higher than men’s, but in almost all cases,
between 1990 and 2010, men’s life expectancy increased faster than women’s, thus reducing the gender
gap. Second, the majority of countries have experienced a relative compression of disability measured either
starting at birth (United Kingdom of Great Britain and Northern Ireland, Spain) or at age 65 (United States
of America, United Kingdom of Great Britain and Northern Ireland, Sweden, Denmark, Norway, France,
Spain, China and Australia). In contrast, a relative expansion of disability was observed in Japan, Hong
Kong Special Administrative Region of China (SAR) and Singapore, the countries and territories with some
of the highest life expectancies of the world. Third, the number of years lived with disability changed little,
remaining almost constant in the United States of America and Australia, increasing slightly in the United
Kingdom of Great Britain and Northern Ireland, the Netherlands, Catalonia (Spain), Japan, Hong Kong
(SAR) and Singapore, and decreasing slightly in Norway. Fourth, the number of years with severe disability
generally increased (United Kingdom of Great Britain and Northern Ireland, France, Japan, Hong Kong
(SAR) and Singapore), including years with mobility problems (Sweden, Catalonia and Singapore) and
years with care needs (United Kingdom of Great Britain and Northern Ireland, France, Japan).
Finally, the most unexpected result from the perspective of the 1970s and 1980s (Gruenberg, 1977;
Kramer, 1980; Manton, 1982) is the sharp decline in the prevalence or the extent of cognitive impairment
observed in some countries (United States of America, United Kingdom of Great Britain and Northern
Ireland, Denmark, France, Netherlands and Australia) but not in all (Sweden, Japan and China). There is
no single explanation for this favourable trend where it has been observed, but increasing levels of
education, improvements of living conditions and of health care systems could be contributing to better
health over the life course, leading to a lower risk of dementia in later life (Crimmins and others, 2018; Wu
and others, 2017). Conversely, the increase in the prevalence of dementia in all Asian countries for which
there are studies (Wimblad and others, 2016), may be related to a type or phase of economic growth that
could, at least initially, be associated to increased cardiovascular risk factors such as hypertension, smoking
and obesity (Larson and Langa, 2017; Prince and others, 2016). However, these explanations do not fit well
the case of Japan, Hong Kong (SAR) and Singapore. At present, trends in life expectancy with and without
cognitive impairment or dementia are only available for a few countries (Robine and others, 2020a and
2020b).
Elsewhere in the world, in Eastern Europe, the Middle East, India, Africa and Latin America, national
studies on health expectancy trends are partial and fewer in number. In India, according to a recent study,
older people (age 60 and over) experienced between 1995 and 2004 both an increase in life expectancy and
in life expectancy without mobility limitation but only older men and older rural persons experienced a
reduction in the proportion of remaining life with mobility limitation, suggesting a relative compression of
disability, older women and older urban persons have experienced an increase in the proportion of
remaining life with mobility limitation, suggesting a relative expansion of disability (Sreerupa and others,
Population Division 122018). In South Africa, according to another study, at age 50 and older healthy life expectancy, based on a
self-rated health measure, increased more than life expectancy over the period 2005-2012 (Chirinda and
others, 2018). In Sao Paulo, in Brazil, DFLE at age 60 strongly decreased between 2000 and 2010 while
life expectancy has kept increasing (Campolina and others, 2014).
V. THE ADULT LONGEVITY REVOLUTION
In this section, the focus will be on countries with long time series of mortality data, such as Sweden
since 1751, France since 1816, Denmark since 1835, Iceland since 1838, England and Wales since 1841,
Belgium since 1841, Norway since 1846, the Netherlands since 1850, Scotland since 1855, Italy since 1872,
Switzerland since 1876, Finland since 1878 (Human Mortality Database, 2021) and Japan since 1899. 4
These data should make it possible to better understand this revolution in adult longevity and in particular,
the extent to which the age of “normal” or “natural” mortality, to use nineteenth century terminology, or
more prosaically, the age of mortality of the older persons, in today’s parlance, is being postponed. Several
indicators have been proposed to identify the timing and dynamics of this revolution. A basic one is the
change over time in the maximum age at death reported in a population, as in figure 9 displaying for Sweden
a strong increase in the maximum age at death, especially over the last decades (Wilmoth and others, 2000).
Figure 9. Maximum reported age at death (MRAD) in Sweden between 1861 and 1999 by gender
Source. Wilmoth and others, 2000.
But this indicator, like any extreme value, suffers from high volatility, with large fluctuations from one
year to the next. By contrast, central values are based on a large number of observations. By construction,
period life expectancies at birth averaging numerous cohort life spans (or cohort life expectancy, which
covers all lifespans of a single birth cohort) minimize such annual fluctuations. However, life expectancy
subsumes at least two different questions, namely: (1) how many babies will survive to become adults; and
(2) how long adults will live. Kannisto has proposed to answer this second question by using the late mode
of life spans, which he considers a much more natural or typical indicator of human life spans (Kannisto,
4
With a gap of a few years during the Second World War (Saito and others, 2021).
Population Division 132001; Canudas-Romo, 2008 and 2010). The mode, however, is by definition, subject to larger annual
fluctuations than life expectancy. To remedy this problem, smoothing techniques can be used (Ouellette
and Bourbeau, 2011) to obtain a more stable central indicator of human longevity (Horiuchi and others,
2013).
Using French data dating back to 1816 (Human Mortality Database, 2021), the evolution of several of
these indicators over two centuries, from 1816 to 2016, can be studied and compared. In this section, the
focus will be on women because several studies suggest that women are outpacing men in increasing
longevity, while men tend to lag behind by a few decades. However, gender differences is addressed more
in detail in box 5. Figure 10 displays six longevity indicators, including another indicator of the limit of
human life, the highest age at which at least 30 deaths are recorded in any given year (Robine and Herrmann,
2020). Of course, this age depends partly on the size of successive cohorts, but in France, cohort size has
not varied considerably, except for cyclical accidents, over the last few centuries.
Figure 10. Six longevity indicators observed in France between 1816 and 2016, females
130
120
Longevity indicators in years
110
100
90
80
70
60
50
40
30
20
1816
1821
1826
1831
1836
1841
1846
1851
1856
1861
1866
1871
1876
1881
1886
1891
1896
1901
1906
1911
1916
1921
1926
1931
1936
1941
1946
1951
1956
1961
1966
1971
1976
1981
1986
1991
1996
2001
2006
2011
2016
Calendar years
LE(0) Median Mode l(10) HAPaL30 MRAD
Source: Robine and Herrmann, 2020.
The dark blue line at the bottom of the graph shows the evolution of period life expectancy at birth.
Three periods can be distinguished. Before 1870, life expectancy seems stable, staying around 40 years.
Then a strong increase is observed after the Franco-German war of 1870-71 and the beginning of the
industrial revolution. This increasing trend continues until after the Second World War. Significant
fluctuations are observed during the whole period but were particularly sharp during the three Franco-
German conflicts, 1870-71, 1914-18 and 1939-45. After the Second World War, the fluctuations disappear,
and growth continues at a sustained average rate of 3 months per year until said growth starts to slow down
in the last 10 years. The dotted red line, which represents the age at which 50 per cent of individuals are
still alive (i.e., the median of lifetimes in the period life table) follows the line of life expectancy at birth
without providing much additional information. In contrast, the grey line showing the age at which the
largest number of adults die (i.e., the mode of lifetimes in the period life table) shows only two major
(distinct) periods. There is no change in the most frequent age at death of adults before the First World War.
That modal age only starts an upward trend after the war. Since the 1960s, life expectancy at birth and the
mode of adult life spans have been increasing at the same rate.
Population Division 14The yellow curve, which indicates the age at which 10 per cent of individuals still survive, which
ecologists and biologists use as a measure of the longevity of different species, follows the mode (most
common age at death of adults), albeit with slightly less fluctuations. These first four curves are derived
from the period life tables, while the last two curves are based on empirical data observed each year from
1816 to 2016 in the French female population. The light blue line, which indicates the highest age, providing
at least 30 deaths per year (HAPaL30), also shows only two distinct periods. The first is a period of no
change before the end of the Second World War, with no significant fluctuations. The HAPaL30 has a value
of 99 years most of the time, otherwise it is 98 or 100 years. This indicator has risen linearly, without any
acceleration or slowdown being detected, from 99 years in 1946 to 109 years in 2016, i.e., an increase of
10 years in the space of 70 calendar years. Finally, the green line shows the maximum reported age at death
(MRAD) each year. Apart from the fact that the older values could be questioned, this indicator shows
substantial annual fluctuations, as can be expected for extreme values. The case of Jeanne Calment's death
at the age of 122 in 1997 (Robine and others, 2019) reinforces the more unpredictable nature of this series.
These observations can be summarised in four periods. (1) Before the last quarter of the nineteenth
century and beyond the annual fluctuations, all indicators appear to be essentially stable. (2) From the last
quarter of the nineteenth century onwards, life expectancy at birth increased, but there was no discernible
change in the most frequent age of death of adults until the end of the First World War. This means that
only the decrease in infant and child mortality and/or adult premature mortality contributed to the increase
in life expectancy during that period. (3) From the end of the First World War, the most frequent age at
death of adults started to shift to higher ages, but without any impact on the other (“empirical”) statistical
measures of the limit of human longevity. (4) Finally, from the end of the Second World War onwards, the
empirical statistical limit of human longevity, as measured by HAPaL30, started to increase in a linear
fashion. Note that the average difference between MRAD and HAPaL30 is seven years and that it seems to
be distributed over the whole period according to a law that resembles, in Lexis' terms, the “law of errors”
(Robine and Herrmann, 2020).
Box 5 shows that these observations hold for French men, albeit with a time lag of a few decades. But
can these observations be generalised to all the countries that have reached the same values of life
expectancy as France? Only similar analyses in the different countries will tell. The trends presented here
for France suggests that the period of compression of adult mortality did exist in the country for the period
from the end of the First World War to the end of the Second World War. What about other countries? The
last period, after the end of the Second World War, is characterised by a revolution in adult longevity, with
a shift towards higher ages of the whole distribution of life spans that are not prematurely interrupted by
accidents. For HAPaL30, our indicator of the empirical statistical limit of human longevity, the increase is
linear. This does not mean that the increase will never stop. Until 1946, the empirical statistical limit of
human longevity had not moved. Will a new plateau be reached, and if so, at what age? Is this longevity
revolution not just another transition, the first having eliminated juvenile mortality, the second having
reduced premature mortality, the third having compressed adult mortality and the fourth having lengthened
their life span?
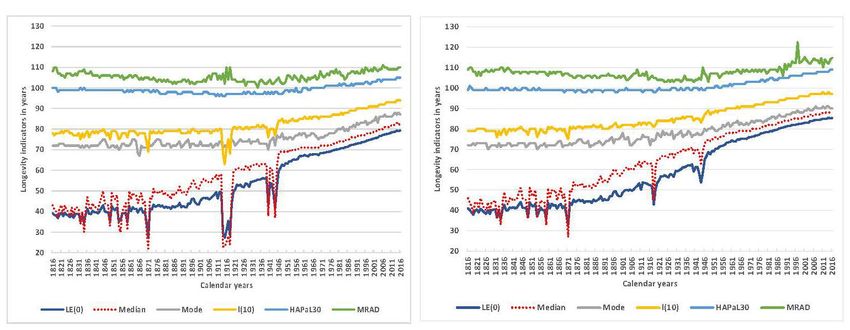
Population Division 15Box 5. Can we talk about a male-female health-survival paradox?
The female longevity advantage
The French data used to illustrate the adult longevity revolution shows clearly the female advantage of today. At the
beginning of the statistical series, in 1816, there is little difference between the sexes: while life expectancy at birth
(LE(0)) was 41.1 years for females versus 39.1 years for males (a 2 year gap), the most frequent adult age at death
(Mode) was 72 years for both sexes, and the highest age still providing 30 deaths (HAPaL30) was 99 years for females
versus 100 years for males. Two centuries later, in 2016, LE(0) was 85.3 years for females versus 79.3 years for males
(a six-year gap), the Mode reached 90 years for females versus 87 years for males (a three-year gap) and HAPaL30
was 109 years for females versus 105 years for males (a four-year gap). These gaps become apparent and widen after
the First World War, as shown in the graph below.
Six longevity indicators observed in France between 1816 and 2016,
males (left panel) versus females (right panel)
Source: HMD, 2021 and IDL, 2021.
For each of these indicators, the graph shows how far behind males were in 2016. Thus, the male LE(0) of 79.3 years
was reached by females as early as 1984, i.e., 32 years earlier. The median value for males was reached by females as
early as 1986, i.e., 30 years earlier, and the values of the other four male indicators as early as 1987, i.e., 29 years
earlier, thus confirming the observation that the progress on longevity made by males follows that of females some
30 years later.
This phenomenon can be illustrated in the other direction, by taking the example of some symbolic values. Thus,
LE(0) of 70 years is reached by French females as early as 1952 compared to 1979 for males, i.e., a 27-year gap, Mode
of 80 years is reached by females as early as 1946 compared to 1980 for males, i.e., a 34-year gap, and HAPaL30 of
105 years is reached by females as early as 1982 compared to 2014 for males, i.e., a 32-year gap.
Disability-free life expectancy
As figures 6, 7 and 8 show for the United States of America, Japan and France, this longevity advantage does not
necessarily translate into a large disability-free life expectancy (DFLE) advantage. For example, the 4.8 years
advantage of American females over males for LE(0) is reduced to 4.4 years in terms of disability-free life expectancy
(DFLE) in 2010, the 6.1 years advantage of Japanese females for LE(0) is reduced to 2.7 years in terms of DFLE in
2016, and the 5.9 years advantage of French females for LE(0) is reduced to 0.9 year in terms of DFLE in 2019. So,
while as a proportion of total years lived, American females spend as much time without disability as American males,
Japanese females and especially French females spend much more time with disabilities than their male counterparts.
Population Division 16Therefore, can we talk about a male-female health-survival paradox?
The question remains open for at least two reasons. First, there is no trade-off between health and longevity in the
sense of males living shorter but healthier lives than females or vice versa. Clearly females live at least as long as
males in good health when health is measured in functional terms. Secondly, several longitudinal studies suggest that
females survive better under current conditions than males regardless of their health status. Thus, the greater longevity
of females can be explained by a greater capacity to survive in poor health compared to males. These greater survival
capacities would explain both their greater longevity and their greater accumulation of disability. The Tempere
(Tiainen and others, 2013) study, Vitality 90+, sheds some particularly interesting light on this issue, suggesting that
in the absence of disability, males survive as much as females, whereas in the presence of disability their survival
capacity collapses whatever the level of prevalent disability, unlike females, whose survival performance is more
closely correlated with the severity of disability.
VI. THE DISCUSSION OF THE SUCCESSFUL AGEING MODEL
As noted earlier in this paper, the enthusiasm for James Fries’ theory of “compression of morbidity”
was immediate, particularly in the fields of ageing biology, geriatrics, psychology and in several social
sciences. Thus, the biologist, Hayflick, could write as early as 1981, commenting on Fries’ theory, that if
age-related fatalities can be eliminated without changing the biological clock itself “the result would be a
society whose members would live full, physically vigorous, youthful lives until death claimed them at the
stroke of midnight on their one-hundredth birthday.” These ideas were echoed in John Rowe and Robert
Kahn's famous article, Human aging: Usual and successful, published in Science in 1987. They too
acknowledged the progress of mortality highlighted by Fries and concluded their paper by pointing out that
“A revolutionary increase in life span has already occurred. A corresponding increase in health span, the
maintenance of full function as nearly as possible to the end of life, should be the next gerontological goal”
(Rowe and Kahn, 1987). Rowe was Professor of Medicine and founding Director of the Division on Aging
at Harvard Medical School, as well as director of the MacArthur Foundation Research Network on
Successful Aging. Kahn was a professor of psychology and a founding member of the Institute for Social
Research at the University of Michigan. In their joint 1987 paper, they wrote:
In many data sets that show substantial decline with age, one can find older persons with minimal
physiological loss, or none at all, when compared to the average of their younger counterparts. These people
might be viewed as having aged successfully with regard to the particular variable under study, and people
who demonstrate little or no loss in a constellation of physiological functions would be regarded as more
broadly successful in physiologic terms. (Rowe and Kahn, 1987).
The success of the theory of “compression of morbidity” and that of the model of “successful aging”
have been such (Robine, 2019) that, in most countries, little room had been left for the consideration and
study of old age, the losses associated with it (Baltes and Baltes, 1990), senescence, the decrease in
physiological reserves and the associated frailty (Fried and others, 2001). Over the years, however, there
has been a growing awareness and study of a variety of end-of-life situations (Gill and others, 2010),
particularly among nonagenarians and centenarians, a large proportion of whom suffer from disease
(Andersen-Ranberg and others, 2001), disability (Gondo and others, 2006; Motta and others, 2005; Evert
and others, 2003), frailty (Herr and others, 2016 and 2018) or some degree of cognitive decline (Winblad
and others, 2016), not to mention social isolation. Figure 11 illustrated the mismatch between the
distribution of life spans and the epidemiological background (Olshansky, 2018b).
Population Division 17You can also read