Aging Induced p53/p21 in Genioglossus Muscle Stem Cells and Enhanced Upper Airway Injury
←
→
Page content transcription
If your browser does not render page correctly, please read the page content below
Hindawi
Stem Cells International
Volume 2020, Article ID 8412598, 13 pages
https://doi.org/10.1155/2020/8412598

Research Article
Aging Induced p53/p21 in Genioglossus Muscle Stem Cells and
Enhanced Upper Airway Injury

          Lu-Ying Zhu,1 Li-Ming Yu ,2,3 Wei-Hua Zhang,2,3 Jia-Jia Deng,2,3 Shang-Feng Liu,2
          Wei Huang,2 Meng-Han Zhang,2,3 Yan-Qin Lu ,1 Xin-Xin Han ,2 and Yue-Hua Liu                                             2,3

          1
            Xiangya School of Stomatology, Xiangya Stomatological Hospital, Central South University, Changsha 410078, China
          2
            Oral Biomedical and Engineering Laboratory, Shanghai Stomatological Hospital, Fudan University, Shanghai 200001, China
          3
            Department of Orthodontics, Shanghai Stomatological Hospital, Fudan University, Shanghai 200001, China

          Correspondence should be addressed to Yan-Qin Lu; lu_yanqin@163.com, Xin-Xin Han; xxhan@fudan.edu.cn,
          and Yue-Hua Liu; liuyuehua@fudan.edu.cn

          Received 7 November 2019; Revised 18 January 2020; Accepted 8 February 2020; Published 4 March 2020

          Guest Editor: Toru Ogasawara

          Copyright © 2020 Lu-Ying Zhu et al. This is an open access article distributed under the Creative Commons Attribution License,
          which permits unrestricted use, distribution, and reproduction in any medium, provided the original work is properly cited.

          Aging of population brings related social problems, such as muscle attenuation and regeneration barriers with increased aging.
          Muscle repair and regeneration depend on muscle stem cells (MuSCs). Obstructive sleep apnea (OSA) rises in the aging
          population. OSA leads to hypoxia and upper airway muscle injury. However, little is known about the effect of increasing age
          and hypoxia to the upper airway muscle. The genioglossus (GG) is the major dilator muscle to keep the upper airway open.
          Here, we reported that muscle fiber and MuSC function declined with aging in GG. Increasing age also decreased the migration
          and proliferation of GG MuSCs. p53 and p21 were high expressions both in muscle tissue and in GG MuSCs. We further found
          that hypoxia inhibited GG MuSC proliferation and decreased myogenic differentiation. Then, hypoxia enhanced the inhibition
          effect of aging to proliferation and differentiation. Finally, we investigated that hypoxia and aging interact to form a vicious
          circle with upregulation of p53 and p21. This vicious hypoxia plus aging damage accelerated upper airway muscle injury. Aging
          and hypoxia are the major damage elements in OSA patients, and we propose that the damage mechanism of hypoxia and aging
          in GG MuSCs will help to improve upper airway muscle regeneration.

1. Introduction                                                       with each other to repair damaged muscle [9, 10]. Muscle is a
                                                                      homeostatic tissue and can tolerate daily wear-and-tear by
The root source of obstructive sleep apnea (OSA) is repeated          repair and regeneration [11]. With increasing age, the
hypoxia during sleep [1, 2], and OSA has a higher prevalence          important reason of progressive weaken and regenerative
at advanced age [3, 4]. Genioglossus (GG), a major upper              dysfunction is the functional decline muscle MuSCs [12].
airway dilator, is key to OSA pathophysiology. Compared               In aging cells, there are also inactivated antioxidative path-
with other skeletal muscles, genioglossus has high specific            ways, increased reactive oxygen species, and apoptosis [13].
gravity of oxidized muscle fiber and is sensitive to oxygen            GG repair and regeneration are very important to OSA
[5]. The upper airway muscle collapses more easily with               patients. However, the influence of aging to GG MuSCs is
aging [6], and there is an age-related change in the fiber-            still unknown.
type distribution of the upper airway muscle [7]. However,                 p53 is a famous tumor suppressor and mutated in a large
the effect of increasing age to GG function and the related            proportion of cancers [14]. Meanwhile, p53 is a transcription
mechanism remains to be elucidated.                                   factor involved in many cell processes, such as cell-cycle con-
    Muscle stem cells (MuSCs) are responsible for muscle              trol, DNA repair, apoptosis, and cellular stress responses
growth and injury repair throughout the life [8]. After               [15]. p53 also is a downstream member of aging and hypoxia
stimuli, MuSCs can differentiate into myocytes and then fuse           signaling pathway [16, 17]. p53 increases its expansion and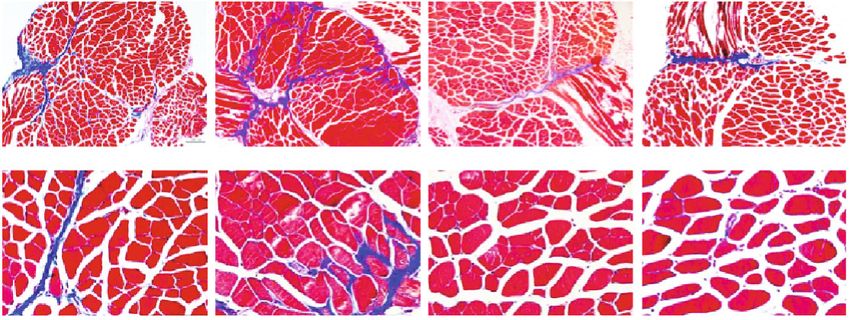
2                                                                                                       Stem Cells International

encourages in aging skeletal muscle. An apoptotic environ-         2.3. Wound Healing Assay and Transwell Cell Migration
ment is encouraged by p53 in muscle tissue [18]. Then, p53         Assay. For wound healing assay, GG MuSCs from four age
is sensitive to hypoxia and may suppress muscle cell prolifer-     groups were seeded in 6 well plates. After nearly100% conflu-
ation by interacting with p21 and hypoxia-inducible factor-        ence, a single wound was created with a sterile 200 μl plastic
1α (HIF-1α) [19]. p21 plays an important role in muscle dif-       pipette tip in the center of the well, then washed with PBS
ferentiation after injury [20]. Limited reports show that hyp-     twice to remove the cellular debris and cultured by 1% FBS
oxia promotes autophagy and modulates mitochondrial                in DMEM for 24 h. The wound was captured at 0 and 24 h.
function of the GG MuSCs [1, 2]. However, the mechanism            The size of the wound healing was measured using Image J
of aging GG MuSCs under hypoxia and whether p53 and                1.5 software.
p21 are involved in this process are still unclear.                    For migration assay, GG MuSCs (1 × 10⁵ ) were seeded in
     Repeated airway collapse and obstruction caused hypoxia       the transwell inserts (Costar, China, pore size: 8 mm). The
in OSA patients. This hypoxia aggravates upper airway mus-         assays and counting of migrating cells were performed as
cle damage. Muscle damage further increases obstruction            described previously [24]. After incubation at 37°C for 24 h,
and forms a vicious cycle. Some studies have reported that         GG MuSCs remaining on the upper chamber membrane
the prevalence of OSA increases with aging [3, 4]. Our previ-      were removed with cotton swabs. The migrated cells were
ous work has showed that hypoxia inhibits the myogenic dif-        fixed in ice-cold 4% PFA for 10 min and stained with a 1%
ferentiation of GG MuSCs and causes muscle disturbances            crystal violet solution for 10 min. Images were captured five
[21–23]. However, the mechanism of aging and hypoxia               field at 100× magnification.
damage to GG MuSCs has few reported. In this study, we
hypothesized that aging and hypoxia might injure the GG            2.4. Electromyography of the GG Muscle (EMGGG). EMGGG
MuSCs by upregulating p53 and p21.                                 was acquired and analyzed as previously described [25]. In
                                                                   brief, mice were anesthetized with 1% pentobarbital, then
                                                                   we turned over the digastric muscle and exposed the gen-
2. Materials and Methods                                           ioglossus muscle. Next, two Teflon-insulated wire loop
                                                                   electrodes were used to record EMGGG. The EMGGG sig-
2.1. Animals and Ethical Issues. C57BL/6 mice (male, 1 to 12
                                                                   nal was amplified, band-pass filtered from 1 to 1000 Hz
months old) were obtained from Shanghai Bikai Biotechnol-
                                                                   (ADInstrument Australia), and digitized at a sampling rate
ogy. Mice were kept under natural aging conditions in the
                                                                   of 1000 Hz (LabChart 8). The EMGGG was rectified, and a
animal house facility, with a 12:12 h light and dark cycle.
                                                                   1 s time constant was applied to compute the moving
All animals were anesthetized and euthanized. The mouse
                                                                   average (LabChart 8).
GG were removed, then frozen in liquid nitrogen and stored
at −80°C rapidly for subsequent quantitative polymerase
                                                                   2.5. Hematoxylin and Eosin and Masson Trichrome Staining.
chain reaction (qPCR) measurements. This research
                                                                   The GG were collected from four age groups male C57BL/6
complied with the Animal Ethics Committee of Shanghai
                                                                   mice and were fixed in ice-cold 4% PFA. Then, GG were
Stomatology Hospital, Fudan University.
                                                                   embedded in paraffin and cut into 4 μm thick sections by a
                                                                   paraffin slicer. Sections were mounted on glass slides, then
2.2. Cell Cultures and Proliferation Assays. Under sterile con-    were stained with hematoxylin and eosin (H&E, Solarbio,
ditions, the GG were excised. Firstly, the tissues were cut into   Beijing, China) staining for observing the muscle fiber
1 mm3 size. Next, the muscle slurry was digested with 0.1%         morphology, and Masson trichrome staining (Servicebio,
type I collagenase (Gibco, USA) and 0.05% trypsin-EDTA             Wuhan, China) was performed to analyze collagen content
(Gibco, Canada) at 37°C each for 30 min. Then, the digestion       in muscle fibers.
was stopped by the addition of Dulbecco’s Modified Eagle
Medium (DMEM, Gibco, UK) supplemented with 10% fetal               2.6. Immunohistochemistry (IHC) and Immunofluorescence
bovine serum (FBS, Gibco, New Zealand). Finally, cells were        (IF) Assay of Tissues. For IHC assay, the 4 μm sections
plated on the culture dishes, and twice repeated differential       embedded in paraffin were deparaffinized and rehydrated.
attachment treatment was used to remove fibroblasts. In             Then, slides were incubated with 10% goat serum seal (Novus
the next experiments, to avoid fibroblasts taking over the          Biologicals, USA) solution at room temperature for 30 min.
other cell populations and becoming the predominant cell           Next, slides were incubated with primary antibodies against
type in the culture, we only used MuSCs from passage 1.            p53 (1 : 500, Santa Cruz Biotechnology) and p21 (1 : 500,
Once the cells reached 90% confluence, they were differenti-         Santa Cruz Biotechnology) overnight at 4°C. Then, the slides
ated by incubation 2% horse serum (Hyclon, USA) in                 were incubated with the second antibody (1 : 1000, Abcam,
DMEM. CoCl2 was dissolved to 200 μM for actual use in              UK) at room temperature for 1 h. Enzyme conjugate was
DMEM.                                                              applied for 10 min at room temperature followed by develop-
    The proliferation of GG MuSCs was assessed using cell          ment with AEC (Solarbio, Beijing, China). Each section
counting kit-8 (CCK-8, Dojindo, Japan) assays. Briefly, cells       was captured three times using a light microscope. For
were seeded in 96-well plates at a density of 5 × 10³ cells        the negative control, PBS was used in place of primary
per well. After 6 days culture, cells were treated with 10%        antibody.
CCK8 in DMEM for 2 h. Optical density (OD) of each well                For IF assay, the 4 μm sections were rehydrated. After
was measured at 430 nm on a microplate reader at 37°C.             rehydrated, 0.25% Triton X-100 in PBS was used as a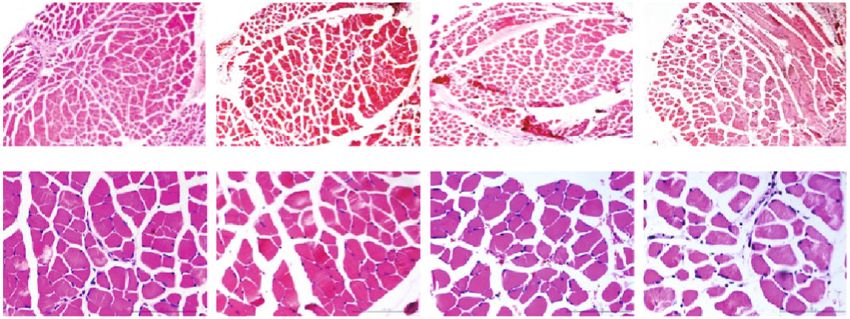
Stem Cells International                                                                                                      3

                                               Table 1: Primer sequences for qPCR.

Gene                                          Forward                                                     Reverse
β-Actin                          GTGACGTTGACATCCGTAAAGA                                       GCCGGACTCATCGTACTCC
p53                               CCCCTGTCATCTTTTGTCCCT                                    AGCTGGCAGAATAGCTTATTGAG
p21                              CGAGAACGGTGGAACTTTGAC                                       CCAGGGCTCAGGTAGACCTT
p16                               GCTCAACTACGGTGCAGATTC                                      GCACGATGTCTTGATGTCCC
MyHC                             GCGAATCGAGGCTCAGAACAA                                      GTAGTTCCGCCTTCGGTCTTG
MyoD                             CGGGACATAGACTTGACAGGC                                     TCGAAACACGGGTCATCATAGA
BAX                               AGACAGGGGCCTTTTTGCTAC                                     GTAGTTCCGCCTTCGGTCTTG
BCL-2                              GCTACCGTCGTGACTTCGC                                      CCCCACCGAACTCAAAGAAGG

membrane permeability agent. Then, sections were blocked          at 4°C. After 4 × 6 min washes in TBST, secondary anti-
with 10% goat serum seal solution at room temperature for         body (1 : 10000, Cell Signaling) was at room temperature
30 min. Next, slides were incubated with primary antibodies       for 2 h and the intensities of dies against p53 and p21 as
against Ki67 (1 : 1000, Thermo scientific) and Pax7 (1 : 250,      a control for all other bands. Data were analyzed by Image
Abcam, UK) overnight at 4°C, and then slides were incubated       J 1.5 software.
with anti-rabbit secondary antibody (1 : 10000, Abcam, UK)
in the dark at room temperature for 1 h. Finally, sections were   2.10. Statistical Analysis. The statistical analysis was
incubated with 4 ′ ,6-diamidino-2-phenylindole (1 : 10000,        performed by GraphPad Prism 7.0 (GraphPad Software, La
DAPI, Abcam, UK) for 10 min and photoed using fluores-             Jolla, CA). All results were shown as mean ± SD from at least
cence microscopy.                                                 3 independent experiments. p value was measured for the
                                                                  statistical significance of a two-tailed Student’s t-test, and
2.7. Immunofluorescence Assay of Cells. Cells were seeded in       data were calculated by Excel. p < 0:05 was considered statis-
24 well plates and stained in ice-cold 4% PFA at room tem-        tically significant.
perature for 10 min on the third day. Cells were washed three
times with PBS, and 0.25% Triton X-100 was used as mem-
brane permeability agent. Next, cells were blocked with 5%
                                                                  3. Results and Discussion
bovine serum albumin (BSA) for 1 h and with primary anti-         3.1. Results
bodies against Ki67, Pax7, and HIF-1α (1 : 300, Novus Bio-
logicals, USA) at 4°C for 48 h. Phosphate-buffered saline          3.1.1. The Structure and Function of Upper Airway Muscle
(PBS) is the control to primary antibody. Then, cells were        Were Affected by Increasing Age. The upper airway becomes
washed three times with phosphate-buffered saline Tween-           more collapsible with aging, and the genioglossus (GG) is
20 (PBST) and were incubated with a second antibody for           the major upper airway muscle to maintain pharyngeal
1 h at room temperature in the dark. At last, cells were incu-    patency [6]. Therefore, the structure and function of GG play
bated with DAPI for 8 min, and pictures were captured by          an important role in OSA. New generation fibers are related
fluorescence microscopy.                                           with muscle force deficit and fatigability [26]. Compared
                                                                  with other skeletal muscle, genioglossus has high specific
2.8. Quantitative Real-Time Polymerase Chain Reaction             gravity of the oxidized muscle fiber and is sensitive to oxygen
Assay. Total RNA was extracted from cells or tissues using        [5]. To investigate whether GG muscle was altered by
TRIzol (Ambion, USA) reagent and then reverse transcribed         increasing age, we first examined the cross-sectional area
to cDNA using PrimeScript RT reagent kit (Tiangen, China).        (CSA) of muscle fibers which derived from four age groups.
Quantitative RT-PCR was performed with 20 μl of reaction          Our results showed that 6-month-old or 12-month-old mice
mixture containing SYBR Green PCR Master Mix (Light               had a CSA reduction compared to 2-month-old mice and a
cycler, USA). Primer sequences of target genes are listed in      significantly less in 1-month-old compared to 2-month-old
Table 1. Relative expression level of each gene was calculated    mice (Figure 1(a)). Similar results were found in collagen
using the 2 − ΔΔCt methods. RNA expression was normal-            content of GG, which showed that 2-month-old mouse gen-
ized to β-actin expression.                                       ioglossus has highest collagen content and less collagen con-
                                                                  tent in 6 and 12-month-old mice compared to 2-month-old
2.9. Western Blot Analysis. Cells were collected by 2x lysis      mice (Figure 1(b)).
buffer. Then, 30 μl of total protein was separated on a 10%            Then, we used electromyography to analyze if muscle
SDS-PAGE gel, and protein in the gel was transferred to a         damage changes with increasing age. Electromyography is a
0.45 μm polyvinylidene difluoride (PVDF) membrane.                 kind of potential change that occurs when skeletal muscle is
Membrane was blocked by immersion in 5% milk for 1 h              excited due to the generation, conduction, and diffusion of
at room temperature. Next, membrane was incubated with            action potential of muscle fiber. We anesthetized mice of dif-
primary antibodies against p53 (1 : 1000, Proteintech), p21       ferent ages (1-month-old, 2-month-old, 6-month-old, and
(1 : 1000, Abcam), MyHC (1:500, DSHB), MyoD (1 : 500,             12-month-old) and then examined the genioglossus electro-
Millipore), and β-actin (1 : 10000, Absin, China) overnight       myographic activity (EMGGG) of these mice. The results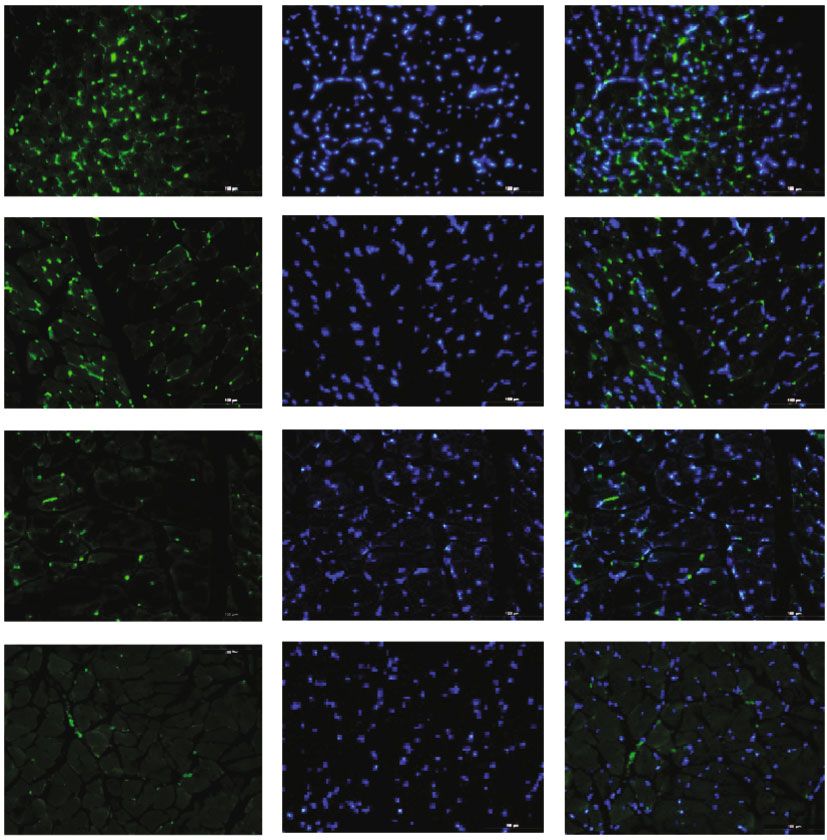
4 Stem Cells International
1m 2m 6m 12 m
Muscle fiber size (휇M2)
800
⁎⁎
600
⁎
400
H&E
200
0
1 2 6 12
Age (months)
(a)
1m 2m 6m 12 m
Collage fiber content (%)
8 ⁎
6
Masson
4
⁎⁎ ⁎⁎
2
0
1 2 6 12
Age (months)
(b)
EMG (휇V)
40 600
1m 0
⁎⁎
−40
⁎⁎
0 1.0 2.0 3.0 4.0 5.0 6.0/s
40
2m 0 400
⁎⁎⁎
⁎⁎⁎
−40
⁎⁎
0 1.0 2.0 3.0 4.0 5.0 6.0/s s
⁎⁎⁎
⁎⁎
40
⁎
6m 0 200
−40
0 1.0 2.0 3.0 4.0 5.0 6.0/s s
⁎⁎
⁎⁎
⁎⁎
40
12 m 0
−40 0
0 1.0 2.0 3.0 4.0 5.0 6.0/s s 1 2 6 12
Age (months)
⁎
Integral amplitude (휇V s)
Maximum amplitude (휇V)
Average frequency (Hz)
Maximum frequency (Hz)
(c)
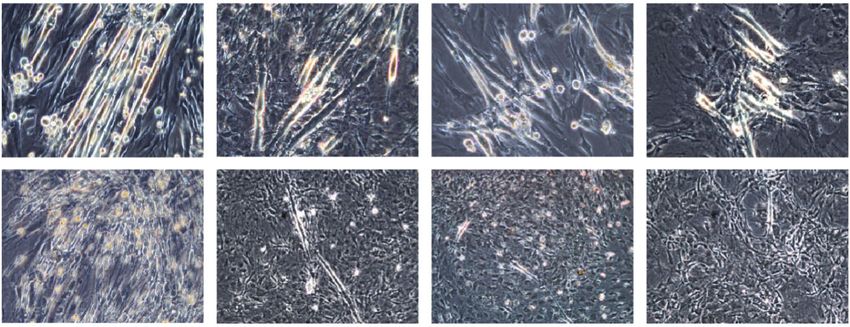
Figure 1: The structure and function of GG declined with aging. (a) The cross-sectional area of muscle fiber in 2-month-old significantly
increased compared to other age groups. (b) The collagen content of 2-month-old was the highest among four age groups mice. (c) The
genioglossus electromyographic activity in four age groups. ∗ p < 0:05, ∗∗ p < 0:01, and ∗∗∗ p < 0:001. Scale bars are 100 μm.
showed that four indexes of EMGGG, including integral factor, was identified as a quantifiable marker for stem cells
amplitude, maximum amplitude, average frequency, and [27]. Therefore, we used Pax7 to detect the self-renewal func-
maximum frequency, decreased with aging, except that tion of GG MuSCs. Immunofluorescence assay showed that
1-month-old was weakest (Figure 1(c)). These findings the Pax7-positive cells decreased gradually with aging
indicated that the structure and function of GG had sig- (Figure 2(a)). We observed that the percentage of Pax7-
nificant reduction with increasing age in adult mice. positive cells in the GG were markedly reduced in 12-
month-old (1.8%) compared to other age groups in
3.1.2. The Renewal Ability Declined and p53/p21 Increased in Figure 2(e) (1 m: 3.7%; 2 m: 2.5%; and 6 m: 2.0%).
Aging GG. In order to investigate whether increasing age Similar results were found in proliferation ability of cells
affected the self-renewal function of MuSCs in GG, Pax7, in GG. To investigate whether increasing age repaired the
the expression of the paired type homeobox transcription proliferation ability of cells in GG. Ki67, a marker protein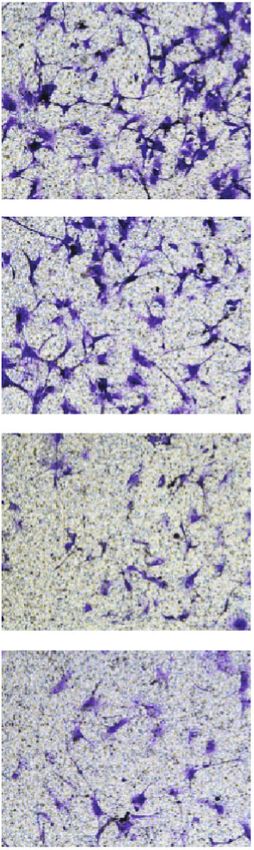
Stem Cells International 5
Ki67 DAPI Ki67/DAPI
Pax7 Pax7/DAPI Enlarged Pax7/DAPI
1m
1m
2m
2m
6m 6m
12 m 12 m
(a) (b)
5
Positive rate (%)
4 Pax7
3 ⁎ ⁎⁎
⁎
2
p53 p21 1
0
1 2 6 12
Age (months)
1m 1m (e)
Positive rate (%)
3 Ki67
⁎
2 ⁎
⁎⁎
1
0
2m 2m 1 2 6 12
Age (months)
(f)
10 p53 ⁎
Relative mRNA
8 ⁎⁎
expression
6
6m 6m 4
2 ⁎⁎
0
1 2 6 12
Age (months)
15 p21
⁎⁎
Relative mRNA
expression
12 m 12 m 10 ⁎
5
⁎
0
1 2 6 12
Age (months)
(c) (d) (g)
Figure 2: The renewal ability declined and senescence phenotype increased in aging GG. (a) Pax7, Pax7/DAPI, and enlarged Pax7/DAPI
detected in GG muscles. (b) DAPI, Ki67, and Ki67/DAPI were detected in GG muscles. (c) The protein level of p53 was significantly
increased in 12-month-old GG. (d) The protein level of p21 dramatically increased in 12-month-old GG compared to 1-month-old,
2-month-old, or 6-month-old. (e) Pax7-positive cells in GG significantly reduced in 12-month-old compared to 1-month-old. (f)
Ki67-positive cells in GG greatly reduced in 12-month-old compared to 1-month-old. Ki67 was observed by immunofluorescence
staining. (g) The mRNA levels of p53 and p21 also upregulated in aging GG. ∗ p < 0:05 and ∗∗ p < 0:01. Scale bars are 100 μm.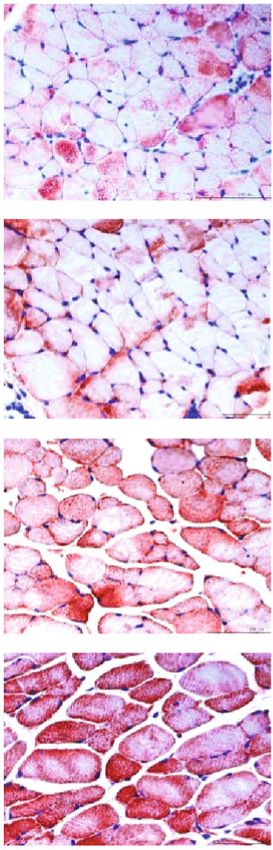
6                                                                                                     Stem Cells International

for cell proliferation, was tested (Figure 2(b)). The results     expressions were more obvious in GG MuSCs derived from
showed that Ki67-positive cells in the GG were reduced in         aging muscle.
12-month-old (0.8%) compared with other age groups in
Figure 2(f) (1 m: 2.5%; 2 m: 1.5%; and 6 m: 1.0%). Therefore,     3.1.5. Hypoxia Enhanced the Inhibitory Effect of Aging on GG
we concluded that the renewal function of GG decreased with       MuSC Proliferation. To explore whether hypoxia affected the
aging.                                                            proliferation of GG MuSCs, GG MuSCs were cultured under
    Moreover, p53 and p21 are not only famous tumor sup-          normoxia (0 μM CoCl2) and hypoxia (200 μM CoCl2). The
pressors but also members downstream of the aging and hyp-        results showed that the cell number under hypoxia was
oxia signaling pathway [16, 17]. The senescence in GG was         decreased to approximately 40% that of cells cultured under
evaluated by the levels of p53 and p21. Immunohistochemis-        normoxia (Figure 5(a)). Then, we performed immunofluo-
try analysis revealed that the protein levels of p53 and p21      rescence staining for HIF-1α, the master transcription factor
were much higher in the GG of 12-month-old mice than              in response to cell hypoxia [28]. Our results showed that
young mice (Figures 2(c) and 2(d)). Meanwhile, p53 and            CoCl2 treatment induced high expression of HIF-1α. The
p21 mRNA in 12-month-old were highest (p53 ≥ sixfold              data confirmed its nuclear localization in the CoCl2-treated
and p21 ≥ eightfold) among all age groups (Figure 2(g)).          groups, while no fluorescence was detected in control cells
These findings discovered that p53 and p21 increased in            (Figure 5(b)). Meanwhile, the results showed that the per-
aging GG.                                                         centage of Pax7-positive cells under hypoxia (87.78%) were
                                                                  higher than cells under normoxia (83.53%). It demonstrated
                                                                  that hypoxia promoted MuSCs self-renewal function
3.1.3. GG MuSCs Exhibited Worse Migration and
                                                                  (Figure 5(b)). Ki67 is a marker protein of ribosomal RNA
Proliferation Abilities in Older Age. OSA caused hypoxia
                                                                  transcription, which is necessary for cellular proliferation
and GG muscle injury. When the muscle is injured, MuSCs
                                                                  [29]. The results showed that Ki67-positive cells from 12-
undergo differentiation into myocytes and fuse with each
                                                                  month-old were significantly reduced compared to 1-
other in order to repair the injured muscle. Therefore,
                                                                  month-old under normoxia, and the decrease was higher
MuSCs are important functional cells in GG. To explore
                                                                  than that observed under hypoxia (Figure 5(c)). The results
whether aging impaired GG MuSCs function, we derived
                                                                  of negative control group without primary antibody were
GG MuSCs from four age groups of mice (Figure 3(a)). The
                                                                  shown (Figure 5(d)). Together, our data suggested the toxic-
cells were fixed after cultured 3 days. Immunofluorescence
                                                                  ity of hypoxia and implied that hypoxia decreased the prolif-
staining showed about 87% of isolated cells were Pax7-
                                                                  eration and promoted self-renewal function of GG MuSCs,
positive and 80% of cells were MyoD-positive (Figure 3(b)),
                                                                  especially in older age cells.
which are the markers of MuSCs. The wound healing and
the transwell migration chamber of GG MuSCs are shown
                                                                  3.1.6. Hypoxia Strengthened the Influence of Aging in the
(Figures 3(c) and 3(d)). Wound healing assay showed that
                                                                  Differentiation of GG MuSCs and Increased p53 and p21
the migration of GG MuSCs from 12-month-old was signif-
                                                                  Expression. When GG muscles are damaged, GG MuSCs dif-
icantly slower than the other three groups (Figure 3(e)).
                                                                  ferentiate into myotubes, which plays an important role in
The transwell migration chamber assay showed that GG
                                                                  repairing the damaged tissues [30]. To explore the relation-
MuSCs were all statistically significant among four age
                                                                  ship between aging and GG MuSCs differentiation, we exam-
groups (Figure 3(e)). On the fourth day, the cell proliferation
                                                                  ined the levels of MyHC and MyoD. The results showed that
of 1-month-old mice was the fastest among the four age
                                                                  under hypoxia, the number of myotubes in GG MuSCs was
groups (Figure 3(f)). The GG MuSCs from 12 month-old
                                                                  much less than that under normoxia. Importantly, the num-
mice exhibited decreased cell proliferation ability. These
                                                                  ber of myotubes was also less in aging GG MuSCs than in
results suggested that aging impaired the migration and pro-
                                                                  young (Figure 6(a)). With increasing aging, MyHC did not
liferation ability of GG MuSCs.
                                                                  have significant change, but hypoxia inhibited the MyHC
                                                                  expression. MyoD is immensely suppressed by hypoxia,
3.1.4. p53/p21 Involved in Hypoxia and Aging Enhanced             especially in aging cells (Figures 6(b) and 6(c)). Under hyp-
Hypoxia Response in GG MuSCs. OSA is characterized by             oxia, p53 and p21 proteins were accumulated. This accumu-
hypoxia during sleep. In order to imitate the hypoxia of          lation is more obvious in aging cells (Figure 6(c)). The
OSA, cells were treated with 0 μM and 200 μM CoCl2, a typ-        mRNA p53 and p21 were significantly increased under hyp-
ical chemical hypoxia model. p53 and p21 are not only             oxia. MyHC and MyoD mRNA were also decreased, and the
famous tumor suppressors but also belong to a downstream          reduction was more severe in aging than young cells
signaling pathway of aging and hypoxia [16, 17]. Firstly, we      (Figure 6(c)). In conclusion, hypoxia aggravated the influ-
detected the levels of p53 and p21. The results showed that       ence of aging on the proliferation and differentiation of GG
p53 and p21 increased in GG MuSCs under hypoxia. The              MuSCs and p53 and p21 involved in the process.
levels of p53 and p21 severely increased in 12-month-old
compared to 1-month-old (Figures 4(a) and 4(b)). Mean-            4. Discussion
while, p16 and BAX increased in hypoxia, especially in aging
GG MuSCs, while BCL-2 decreased (Figure 4(c)). These              The tissue homeostasis and organ function of multicellular
results suggested that p53, p21, and p16 involved the func-       organisms are gradually loss with aging. As aging, stem cell
tion regulation in GG MuSCs under hypoxia. These gene             function has a progressive decline [31]. Therefore, the
Stem Cells International                                                                                                                                                                       7

             3 days                                       5 days                                           Pax7                    DAPI                              Pax7/DAPI

             8 days                                   11 days                                              MyoD                    DAPI                              MyoD/DAPI

                                                    (a)                                                                                        (b)
                                                          0h                                                                     24 h

            1m

            2m

            6m

           12 m

                                                                                                     (c)                                                                         (d)

                                    80                                                                                                                2.5
                                                                                                    200
                                                                         Number of cell per field
               Migration rate (%)

                                    60          ⁎          ⁎⁎
                                                                                                                                          OD 430 nm

                                                                                                    150             ⁎⁎⁎                               2.0
                                                                   ⁎                                                                                                                       ⁎
                                    40                                                              100                                                                                    ⁎
                                                                                                                            ⁎
                                                                                                                                  ⁎⁎                  1.5                                  ⁎
                                    20                                                               50                                                                                    ⁎
                                     0                                                                0                                               1.0
                                         1       2     6           12                                        1        2     6     12                        1    2     3    4    5     6
                                             Age (months)                                                         Age (months)                                       Time (days)

                                                                                                                                                                1m            6m
                                                                                                                                                                2m            12 m
                                                                        (e)                                                                                          (f)

Figure 3: The proliferation and migration of GG MuSCs declined with aging. (a) Primary cells were obtained from GG muscle fibers, and cells
showed a spindle morphology. (b) GG MuSC markers Pax7 and MyoD were positive in cells. (c) Wound healing of GG MuSCs derived from
four age groups. (d) The migration of GG MuSCs derived from four age groups. (e) The wound healing and migration rate are significantly
lower in 12-month-old compared to other age groups at 24 h. (f) The growth curve of GG MuSCs in four age groups. ∗ p < 0:05 and ∗∗ p < 0:01.
Scale bars are 100 μm.
8 Stem Cells International
Age (months) 1 2 6 12 1 2 6 12
CoCl2 (200 휇M) – – – – + + + +
p21
훽-Actin
p53
훽-Actin
(a)
p21 p53 ##
10 6 @@
Relative mRNA expression
Relative mRNA expression
8 #
@ # #
4
6
##
4 ⁎ #
⁎⁎ ## 2
2
0 0
Normoxia Hypoxia Normoxia Hypoxia
1m 6m
2m 12 m
(b)
# #
15 p16 15
Relative mRNA expression
Relative mRNA expression
### @@ BAX @@
@@@
##
10 # 10 @@
@
##
5 ⁎⁎ 5 ⁎⁎ @@
⁎⁎⁎ ⁎⁎
### ⁎
0 0
Normoxia Hypoxia Normoxia Hypoxia
15 BCL-2
Relative mRNA expression
#
10
⁎⁎⁎ ⁎⁎ @
5
0
Normoxia Hypoxia
1m 6m
2m 12 m
(c)
Figure 4: p53/p21 involved in hypoxia response in GG MuSCs. (a) The protein levels of p53 and p21 significantly increased under hypoxia,
particularly in MuSCs derived from older age GG. (b) The mRNA levels of p53 and p21 also obviously grew up under hypoxia. The levels were
higher in old GG MuSCs than in young. (c) The mRNA levels of p16 and BAX increased, while BCL-2 increased under hypoxia, especially in
aging GG MuSCs. Statistical significance is marked as follows: ∗ represents the difference between normoxia and 1-month-old vs. 2-month-
old vs. 6-month-old vs. 12-month-old; ∗ p < 0:05, ∗∗ p < 0:01, and ∗∗∗ p < 0:001. @ represents the difference between hypoxia and 1-month-old
vs. 2-month-old vs. 6-month-old vs. 12-month-old; @p < 0:05, @@p < 0:01, and @@@p < 0:001. # represents difference between same age and
normoxia vs. hypoxia; #p < 0:05, ##p < 0:01, and ###p < 0:001.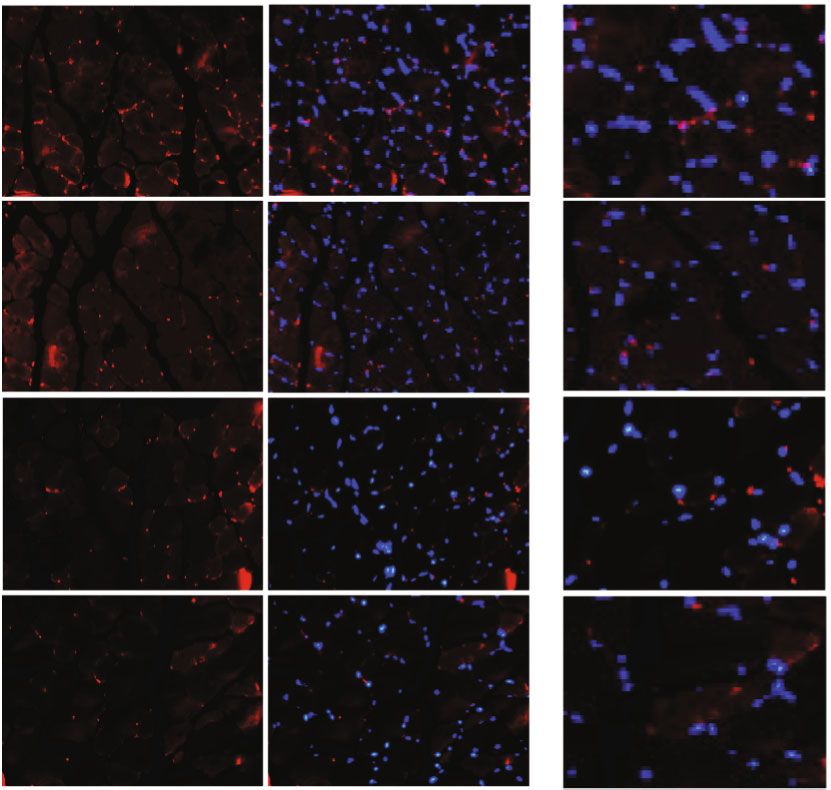
Stem Cells International                                                                                                                                                                 9

                                                     Normoxia            Hypoxia

                                                                                        The number of cell per field
                                                                                                                           800

                                                                                                                           600
                                      1m                                                                                                                              @@
                                                                                                                           400                                              ##
                                                                                                                                                                            ⁎⁎
                                                                                                                           200

                                                                                                                                           0
                                                                                                                                                   Normoxia           Hypoxia
                                  12 m
                                                                                                                                                     1m
                                                                                                                                                     12 m

                                                                            (a)
                                           Bright field          Pax7      HIF-1훼                                              DAPI                                  Merge
                               Normoxia
                               Hypoxia

                                                                            (b)
                                                                                                                       Positive rate (%)   60                   Ki67

                                                                                                                                           40
                                                                                                                                                            ⁎
                                                                                                                                                                        #
                                              Ki67                DAPI      Ki67/DAPI                                                      20                                 #
                                                                                                                                                                              @

                                                                                                                                               0
                              1m

                                                                                                                                                    Normoxia            Hypoxia
                   Normoxia

                                                                                                                                                      1m
                                                                                                                                                      12 m
                              12 m

                                                                                                                                                                              PBS
                              1m

                                                                                                                                                                              DAPI
                   Hypoxia
                              12 m

                                                                                                                                                                              PBS/DAPI

                                                                (c)                                                                                             (d)

Figure 5: Hypoxia enhanced the inhibitory effect of aging on GG MuSC proliferation. (a) The GG MuSCs from 1-month-old and 12-month-
old were treated with 0 μM and 200 μM CoCl2 for 3 days. The cell number was decreased to approximately 40% that of untreated cells. (b)
Immunofluorescence staining for Pax7 and HIF-1α in MuSCs treated with or without CoCl2 for 3 days. (c) Ki67-positive cells in GG
MuSCs under normoxia and hypoxia. Ki67 was observed by immunofluorescence staining. (d) The control experiment of IF. Statistical
significance is marked as follows: ∗ represents difference between same CoCl2 and 1-month-old vs. 12-month-old; ∗ p < 0:05, ∗∗ p < 0:01,
and ∗∗∗ p < 0:001. @ represents the difference in 1-month-old and 0 vs. 200 μM CoCl2; @p < 0:05 and @@p < 0:01. # represents the
difference in 12-month-old and 0 vs. 200 μM CoCl2; #p < 0:05, ##p < 0:01, and ###p < 0:001. Scale bars are 100 μm.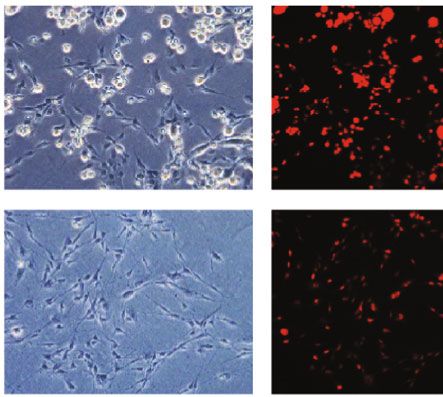
10 Stem Cells International
1m 2m 6m 12 m
Normoxia
Hypoxia
(a)
MyHC
1.5
Relative mRNA expression
1m 2m 6m 12 m
CoCl2 (200 휇M) – + – + – + – + 1.0 ⁎⁎⁎
MyHC ⁎⁎ ##
0.5 ## #
훽-Actin @ @@ ##
0.0
Normoxia Hypoxia
1m 6m
2m 12 m
(b)
1.5
Relative mRNA expression
Age (months) 1 2 6 12 1 2 6 12 MyoD
CoCl2 (200 휇M) – – – – + + + +
1.0 ⁎⁎ ⁎⁎
MyoD
## ##
0.5 @@@
p21 ⁎⁎ @
#
@
p53 0.0
Normoxia Hypoxia
훽-Actin
p21 p53 #
2.5 ## 1.5 @@ ##
Relative mRNA expression
Relative mRNA expression
@@ @@
##
2.0 #
@@
@@ 1.0 ⁎⁎ ⁎⁎
⁎⁎ ⁎⁎
1.5
# ⁎⁎
##
@@ 0.5
1.0
⁎
00 0.0
Normoxia Hypoxia Normoxia Hypoxia
1m 6m
2m 12 m
(c)
Figure 6: Hypoxia strengthened the influence of aging on GG MuSC differentiation. (a) The differentiation of GG MuSCs from four age
groups under normoxia and hypoxia. (b) The expression level of MyHC was tested after differentiation in normoxia and hypoxia. (c) p53,
p21, and MyoD were observed after differentiation under normoxia and hypoxia. p53 and p21 significantly increased, and the expressions
of MyHC and MyoD were markedly downregulated under hypoxia. Aging further inhibited the levels of MyHC and MyoD and increased
the levels of p53 and p21. Statistical significance is marked as follows: ∗ represents the difference between normoxia and 1-month-old vs.
2-month-old vs. 6-month-old vs. 12-month-old; ∗ p < 0:05, ∗∗ p < 0:01, and ∗∗∗ p < 0:001. @ represents the difference between hypoxia and
1-month-old vs. 2-month-old vs. 6-month-old vs. 12-month-old; @p < 0:05, @@p < 0:01, and @@@p < 0:001. # represents the difference
between same age and normoxia vs. hypoxia; #p < 0:05, ##p < 0:01, and ###p < 0:001. Scale bars are 100 μm in all images. Scale bars are 100 μm.Stem Cells International 11
Young Age
Genioglossus muscle Genioglossus muscle
MuSCs MuSCs
Normoxia Hypoxia Normoxia Hyp
y oxia
Hypoxia
p53 p53 p 53
p53 p53
p2
21
p21 p21 p21 p21
MyoD MyoD MyoD MyoD
Myotube b
Myotube Myotube Myotube
Muscle injury Muscle injury Muscle injury
Figure 7: The diagrammatic sketch shows the damage mechanism of hypoxia and aging to genioglossus. Under hypoxia, increasing p53 and
p21 induce the decline of MyoD. Then, low expression of MyoD leads to the reduction of myotube formation, especially in aging MuSCs.
Finally, the results above enhance upper airway muscle injury.
decrease of tissue homeostasis can be attributed to an age- ever, little attention is focused on the interacting of hypoxia
related decline of stem cells [12]. The genioglossus, a major and aging to vicious circle on upper airway muscles. Our
upper airway dilator, has abundant blood supply and high study firstly demonstrated the mechanism of aging and hyp-
specific gravity of the oxidized muscle fiber and is sensitive oxia on upper airway in molecular level.
to oxygen and rapid contraction compared with other skele- We demonstrated that the GG MuSCs from 2-month-
tal muscles [5]. In this study, we characterized the effects of old mice have some abnormal changes compared to other
aging and hypoxia on GG injury and investigated p53/p21 age groups. p53 and p21 were the lowest among four age
role in this process (Figure 7). groups. It may be related to adolescent behavior. During
We firstly investigated that the tissue function, such as adolescence, the development of brain changes can be
cross-sectional area, collagen content, genioglossus electro- dynamic [34, 35]. Neurologically, synaptic and pruning
myographic activity, the Pax7-positive cells and the Ki67 myelination are associated with brain maturation. These
positive cells in genioglossus, which were decreased with processes are assumed to occur in accordance with macro-
aging. Both mRNA and protein p53 and p21 increased in scopic anatomical changes. GG muscle is innervated by the
GG muscle tissue. We also displayed that the proliferation sublingual nerve. When hypoglossal nerve is stimulated, the
and migration of GG MuSCs decreased with aging. There- physiologic state of GG muscle changes [36]. We speculated
fore, we suggest that aging impaired the GG and its MuSCs that the changes of GG MuSCs from 2-month-old mice
function. We further verified the influence of hypoxia in might be due to the development of adolescent stimuli from
MuSCs derived from aging GG. Our data suggested that the the hypoglossal nerve.
migration, proliferation, and differentiation capacity of GG Our results may rich the therapeutic theory and provide
MuSCs declined with aging. Hypoxia further enhanced this some treatment base for OSA patients in aging population.
inhibition effect by increasing the levels of p53 and p21. Clinically, patients with OSA are regularly treated with
Previous reports show that the upper airway becomes mechanical dilation of the upper airway to alleviate the
more collapsible with aging [5]. The type IIa fibers have a sig- symptoms of airway collapse. These mechanical dilation
nificant decrease, and IIb fibers have an increase in aging methods have many shortcomings such as poor patient com-
upper airway muscles [7]. There are some age-related pliance and more complications. The older have a poorer
changes and endurance in GG muscle fiber, and aged rats prognosis for the treatment of mechanical dilation of the
showed decreased susceptibility to hypoxia-induced stress upper airway especially. Therefore, more evidence is needed
[7, 32]. Our group has reported that hypoxia inhibits the to elucidate the underlying mechanisms of interactions
GG MuSCs proliferation and differentiation [23, 33]. How- between aging and hypoxia on GG muscle.12 Stem Cells International
Our results suggested that hypoxia and aging interact to References
form a vicious circle with upregulation of p53 and p21, and
this vicious hypoxia plus aging damage accelerated upper [1] W. Qin, Y. B. H. Zhang, B. L. Deng, J. Liu, H. L. Zhang, and
airway muscle injury. However, we know little about the Z. L. Jin, “miR-17-5p modulates mitochondrial function of
mechanism of neurological control of EMGGG. Altered the genioglossus muscle satellite cells through targeting Mfn2
in hypoxia,” Journal of Biological Regulators and Homeostatic
neurological control of the GG may be the primary mech-
Agents, vol. 33, no. 3, pp. 753–761, 2019.
anism of OSA [37]. Therefore, age-related factors altering
[2] H. Wang, D. Zhang, S. Jia et al., “Effect of sustained hypoxia on
neural control of GG may be important in the elderly.
autophagy of genioglossus muscle-derived stem cells,” Medical
Meanwhile, more studies are expected to explore the neu-
Science Monitor : international medical journal of experimental
rological control mechanism of the aging GG. and clinical research, vol. 24, pp. 2218–2224, 2018.
In summary, our study displayed that the function of GG
[3] G. Magliulo, M. de Vincentiis, G. Iannella et al., “Olfac-
muscles and MuSCs was affected by the aging process. Mean- tory evaluation in obstructive sleep apnoea patients,” Acta
while, hypoxia aggravated the influence of aging in the prolif- Otorhinolaryngologica Italica, vol. 38, no. 4, pp. 338–345,
eration and differentiation of GG MuSCs by increasing p53 2018.
and p21. Our findings highlight the important role of [4] T. Young, E. Shahar, F. J. Nieto et al., “Predictors of sleep-
p53/p21 on the GG muscle during the aging process, and it disordered breathing in community-dwelling adults: the Sleep
may provide therapeutic basis in the repair of OSA upper Heart Health Study,” Archives of Internal Medicine, vol. 162,
airway injury. no. 8, pp. 893–900, 2002.
[5] F. J. Sériès, S. A. Simoneau, S. St Pierre, and I. Marc, “Charac-
teristics of the genioglossus and musculus uvulae in sleep
5. Conclusions apnea hypopnea syndrome and in snorers,” American Journal
of Respiratory and Critical Care Medicine, vol. 153, no. 6,
OSA is a serious upper airway block problem. A population pp. 1870–1874, 1996.
of more than 100 million is tolerant to this disease. OSA
[6] A. D. Ray, T. Ogasa, U. J. Magalang, J. A. Krasney, and G. A.
brings hypoxia and upper airway muscle injury. However, Farkas, “Aging increases upper airway collapsibility in Fischer
the damage mechanism of hypoxia and aging to the genio- 344 rats,” Journal of Applied Physiology, vol. 105, no. 5,
glossus is still unknown. In this study, we firstly discovered pp. 1471–1476, 2008.
the effects of aging and hypoxia on GG MuSCs and showed [7] A. Oliven, N. Carmi, R. Coleman, M. Odeh, and
detailed property analysis of mouse GG MuSCs. We found M. Silbermann, “Age-related changes in upper airway muscles
that aging affected the function of GG tissue and its MuSCs. morphological and oxidative properties,” Experimental Geron-
Hypoxia suppressed the proliferation of mouse GG MuSCs, tology, vol. 36, no. 10, pp. 1673–1686, 2001.
especially in MuSCs derived from aging GG, by increasing [8] P. Feige and M. A. Rudnicki, “Muscle stem cells,” Current Biol-
the expression levels of p53/p21. Identification of p53/p21 ogy: CB, vol. 28, no. 10, pp. R589–R590, 2018.
functions to mouse GG MuSCs may be helpful to understand [9] P. Bi, A. Ramirez-Martinez, H. Li et al., “Control of muscle for-
cell senescence. Our study may benefit to reduce the airway mation by the fusogenic micropeptide myomixer,” Science,
obstruction and benefit the OSA therapies. vol. 356, no. 6335, pp. 323–327, 2017.
[10] A. A. Cutler and B. B. Olwin, “Muscling in on the awesome
proliferative power of the terrible teratoma,” Cell Stem Cell,
Data Availability vol. 23, no. 1, pp. 1-2, 2018.
The data used to support the findings of this study are [11] P. Zhu, C. Zhang, Y. Gao, F. Wu, Y. Zhou, and W. S. Wu, “The
transcription factor Slug represses p16Ink4a and regulates
included within the article.
murine muscle stem cell aging,” Nature Communications,
vol. 10, no. 1, p. 2568, 2019.
Conflicts of Interest [12] L. Li, M. Rozo, S. Yue et al., “Muscle stem cell renewal sup-
pressed by GAS1 can be reversed by GDNF in mice,” Nature
The authors declare that there is no conflict of interest Metabolism, vol. 1, no. 10, pp. 985–995, 2019.
regarding the publication of this paper. [13] S. Wang, Y. Zheng, J. Li et al., “Single-cell transcriptomic atlas
of primate ovarian aging,” Cell, vol. 180, no. 3, pp. 585–
600.e19, 2020.
Acknowledgments [14] A. Gupta, K. Shah, M. J. Oza, and T. Behl, “Reactivation of p53
gene by MDM2 inhibitors: a novel therapy for cancer treat-
We appreciate Zhi-Wen Zhou and Ling-Ling Zhang for their ment,” Biomedicine & Pharmacotherapy = Biomedecine &
intellectual help on this project. The paper is supported by a Pharmacotherapie, vol. 109, pp. 484–492, 2019.
National Natural Science Foundation of China grant [15] A. Rufini, P. Tucci, I. Celardo, and G. Melino, “Senescence and
(81901031 and 81771109), Natural Science Foundation of aging: the critical roles of p53,” Oncogene, vol. 32, no. 43,
Shanghai grant (19ZR1445400), General Program Shanghai pp. 5129–5143, 2013.
Municipal Health and Family Planning Commission grant [16] L. Liu, G. W. Charville, T. H. Cheung et al., “Impaired notch
(201740091), and innovation action project of Shanghai signaling leads to a decrease in p53 activity and mitotic catas-
Science and Technology Commission-laboratory animal trophe in aged muscle stem cells,” Cell Stem Cell, vol. 23, no. 4,
models (grant number 15140903500). pp. 544–556.e4, 2018.Stem Cells International 13
[17] T. J. Humpton and K. H. Vousden, “Regulation of cellular [33] Y. Huang and Y. H. Liu, “Effects of phytoestrogens on genio-
metabolism and hypoxia by p53,” Cold Spring Harbor perspec- glossus contractile properties in ovariectomized rats exposed
tives in medicine, vol. 6, no. 7, p. a026146, 2016. to chronic intermittent hypoxia may be independent of their
[18] M. M. Ziaaldini, E. Koltai, Z. Csende et al., “Exercise training estrogenicity,” European Journal of Oral Sciences, vol. 119,
increases anabolic and attenuates catabolic and apoptotic no. 2, pp. 128–135, 2011.
processes in aged skeletal muscle of male rats,” Experimental [34] B. J. Casey, R. M. Jones, and T. A. Hare, “The adolescent
Gerontology, vol. 67, pp. 9–14, 2015. brain,” Annals of the New York Academy of Sciences,
[19] S. Mizuno, H. J. Bogaard, D. Kraskauskas et al., “p53 gene defi- vol. 1124, pp. 111–126, 2008.
ciency promotes hypoxia-induced pulmonary hypertension [35] R. D. Fields, “Myelination: an overlooked mechanism of syn-
and vascular remodeling in mice,” American Journal of Physi- aptic plasticity?,” The Neuroscientist, vol. 11, no. 6, pp. 528–
ology. Lung Cellular and Molecular Physiology, vol. 300, no. 5, 531, 2016.
pp. L753–L761, 2011. [36] M. F. Pengo and J. Steier, “Emerging technology: electrical
[20] N. Chinzei, S. Hayashi, T. Ueha et al., “P21 deficiency delays stimulation in obstructive sleep apnoea,” Journal of Thoracic
regeneration of skeletal muscular tissue,” PLoS One, vol. 10, Disease, vol. 7, no. 8, pp. 1286–1297, 2015.
no. 5, p. e0125765, 2015. [37] S. C. Veasey, G. Zhan, P. Fenik, and D. Pratico, “Long-term
[21] W. Ding and Y. Liu, “Genistein attenuates genioglossus muscle intermittent hypoxia: reduced excitatory hypoglossal nerve
fatigue under chronic intermittent hypoxia by down- output,” American Journal of Respiratory and Critical Care
regulation of oxidative stress level and up-regulation of antiox- Medicine, vol. 170, no. 6, pp. 665–672, 2004.
idant enzyme activity through ERK1/2 signaling pathway,”
Oral Diseases, vol. 17, no. 7, pp. 677–684, 2011.
[22] Y. H. Liu, Y. Huang, and X. Shao, “Effects of estrogen on gen-
ioglossal muscle contractile properties and fiber-type distribu-
tion in chronic intermittent hypoxia rats,” European Journal of
Oral Sciences, vol. 117, no. 6, pp. 685–690, 2009.
[23] W. Li and Y. H. Liu, “Effects of phytoestrogen genistein on
genioglossus function and oestrogen receptors expression in
ovariectomized rats,” Archives of Oral Biology, vol. 54, no. 11,
pp. 1029–1034, 2009.
[24] Y. Yang, M. Gao, Z. Lin et al., “DEK promoted EMT and
angiogenesis through regulating PI3K/AKT/mTOR pathway
in triple-negative breast cancer,” Oncotarget, vol. 8, no. 58,
pp. 98708–98722, 2017.
[25] M. Polotsky, A. S. Elsayed-Ahmed, L. Pichard et al., “Effect of
age and weight on upper airway function in a mouse model,”
Journal of Applied Physiology, vol. 111, no. 3, pp. 696–703,
2011.
[26] S. S. K. Chan, R. W. Arpke, A. Filareto et al., “Skeletal muscle
stem cells from PSC-derived teratomas have functional regen-
erative capacity,” Cell Stem Cell, vol. 23, no. 1, pp. 74–85.e6,
2018.
[27] P. Seale, L. A. Sabourin, A. Girgis-Gabardo, A. Mansouri,
P. Gruss, and M. A. Rudnicki, “Pax7 is required for the speci-
fication of myogenic satellite cells,” Cell, vol. 102, no. 6,
pp. 777–786, 2000.
[28] S. Mason and R. S. Johnson, “The role of HIF-1 in hypoxic
response in the skeletal muscle,” Advances in Experimental
Medicine and Biology, vol. 618, pp. 229–244, 2007.
[29] R. Rahmanzadeh, G. Huttmann, J. Gerdes, and T. Scholzen,
“Chromophore-assisted light inactivation of pKi-67 leads to
inhibition of ribosomal RNA synthesis,” Cell Proliferation,
vol. 40, no. 3, pp. 422–430, 2007.
[30] M. Buckingham and D. Montarras, “Skeletal muscle stem
cells,” Current Opinion in Genetics & Development, vol. 18,
no. 4, pp. 330–336, 2008.
[31] D. L. Jones and T. A. Rando, “Emerging models and paradigms
for stem cell ageing,” Nature Cell Biology, vol. 13, no. 5,
pp. 506–512, 2011.
[32] J. R. Skelly, R. A. O’Connell, J. F. X. Jones, and K. D.
O’Halloran, “Structural and functional properties of an
upper airway dilator muscle in aged obese male rats,” Respira-
tion, vol. 82, no. 6, pp. 539–549, 2011.You can also read