Agricultural Commodity Traders in Switzerland - Benefitting from Misery?
←
→
Page content transcription
If your browser does not render page correctly, please read the page content below
A Public Eye Report – June 2019

Agricultural
Commodity Traders
in Switzerland –
Benefitting
from Misery?
Executive Summary     3

1   Introduction   7

2   The Big Picture 9
    2.1 – The structural transformation of the global agro-food system     10
    2.2 – Production and trade: key figures and trends 10

3   The role of Switzerland as a global trading hub for agricultural commodities    13

4   Consolidation in the global agro-food system 19
    4.1 – Trends and consequences 20
    4.2 – Horizontal concentration: The global view 22
    4.3 – Swiss-based traders on course for expansion 22
    4.4 – Vertical integration: The global view 23
    4.5 – Swiss-based traders as global value chain managers     23

5   Human rights violations in the production and trade of agricultural commodities      27
    5.1 – No living wages nor living income 28
    5.2 – Forced and child labour 28
    5.3 – Occupational health and safety 30
    5.4 – Deforestation 31
    5.5 – Land conflicts 32
    5.6 – Tax dodging, corruption and links to politically exposed persons 34
    5.7 – Clusters of issues: What these violations have in common 36

6   Power asymmetry: The root cause of human rights violations 37
     6.1 – Producing countries: Lack of enforcement of human rights protections 38
     6.2 – Home states of agricultural commodity traders: Unwillingness to regulate 39
     6.3 – The problematic business model: Global value chain managers 39
     6.4 – Too little is being done to curb corporate power: Shortcomings of competition policies 40
     6.5 – It all comes down to power: How power asymmetry is failing producers and workers 41

7   What needs to happen: Re-balancing of power relations       43

    Annex I – Definitions and Methodology     45
    Annex II – List of abbreviations 47
    Endnotes 48

IMPRINT Agricultural Commodity Traders in Switzerland – Benefitting from Misery?
A Public Eye Report, June 2019, 52 pages | Authors Thomas Braunschweig, Alice
Kohli, Silvie Lang | Contributors Anna Bugmann and Iona Summerson | Acknowledgments
Tomaso Ferrando, Christa Luginbühl, Andreas Missbach and Bernhard Tröster | Editor
Simon Parker | Layout Karin Hutter, karinhutter.com | Cover picture © Paulo Fridman –
Bloomberg/Getty Images

PUBLIC EYE Avenue Charles-Dickens 4, CH-1006 Lausanne | Phone +41 (0)21 620 03 03
Fax +41 (0)21 620 03 00 | contact@publiceye.ch | www.publiceye.ch | CP 10-10813-5
A Public Eye Report | June 2019   3

           Executive Summary

Switzerland is not only home to the world’s largest oil and mineral
traders; it is also a significant trading hub for agricultural
commodities such as coffee, cocoa, sugar, or grains. The majority
of globally significant agricultural traders are either based here
or operate important trading branches in the country. The sector is
highly concentrated with ever fewer powerful companies who also
control the production and processing stages of the industry. In
low-income countries, where many of the commodities traded
by Swiss-based companies are produced, human rights violations
are omnipresent, ranging from the lack of living wages and
incomes, to forced and child labour as well as occupational health
and safety hazards. Moreover, the risk of tax dodging and corrup-
tion has been shown to be particularly high within agricultural pro-
duction and trade. This report sheds light on the opaque sector
of agricultural commodity trade and the human rights violations
related to activities in this business. The report also highlights
Switzerland’s refusal to regulate the sector in ways that could ad-
dress these issues, and it outlines ways to tackle the challenges
at hand.
4 Agricultural Commodity Traders in Switzerland – Benefitting from Misery?
Population growth, rising income levels and urbanisation are destined for the world market, such as cocoa, coffee, or cotton,
driving up demand for food. Growing demand for meat and are produced in low-income countries, where the agricultural
agro-fuels leads to an even greater increase in the production of sector provides work for a significant proportion of the popula-
agricultural commodities such as soy, corn, and sugar. These de- tion. At the same time, human rights violations are widespread
velopments have put in motion a structural transformation of in the production of agricultural commodities, particularly in
the global agro-food system accelerated by technological prog- the Global South. Farmers can barely meet their basic needs
ress and facilitated by economic policies biased towards free with their income and workers can hardly survive on their
trade and an export-led development model. In recent years, wages. While poverty wages are a fundamental issue, a myriad
take-overs, joint ventures and mergers have led to fewer multi- of other problems are commonplace, including forced and child
national companies dominating different stages of agricultural labour, health issues due to the use of pesticides, the destruc-
value chains. Today, a small number of powerful actors control tion of livelihoods through deforestation, and large-scale land
large parts of our entire agro-food system. In addition, many acquisitions resulting in land grabbing. Furthermore, the risk of
companies have come to exert considerable control over the tax dodging, aggressive tax avoidance, corruption and influence
production stage. peddling is particularly high in commodity trading. These prac-
tices often result in human rights violations by reducing states’
capabilities and financial means to ensure the human rights of
SEVERE HUMAN RIGHTS VIOLATIONS their populations are upheld.
Production increases in the agricultural sector have led to a
downward trend in food prices, however the transformation of SWITZERLAND AT THE HEART OF
the global agro-food system has spectacularly failed to eradicate GLOBAL AGRICULTURAL COMMODITY TRADE
malnutrition and hunger worldwide. Furthermore, agricultural
producers and other people eking out a living from agriculture Until now little has been known about Switzerland’s role as a
have suffered enormously under the depressed food prices and global agricultural trading hub. For this report, Public Eye in-
in many cases are deprived of a decent living. Many of the crops vestigated 16 of the world’s most important agricultural traders
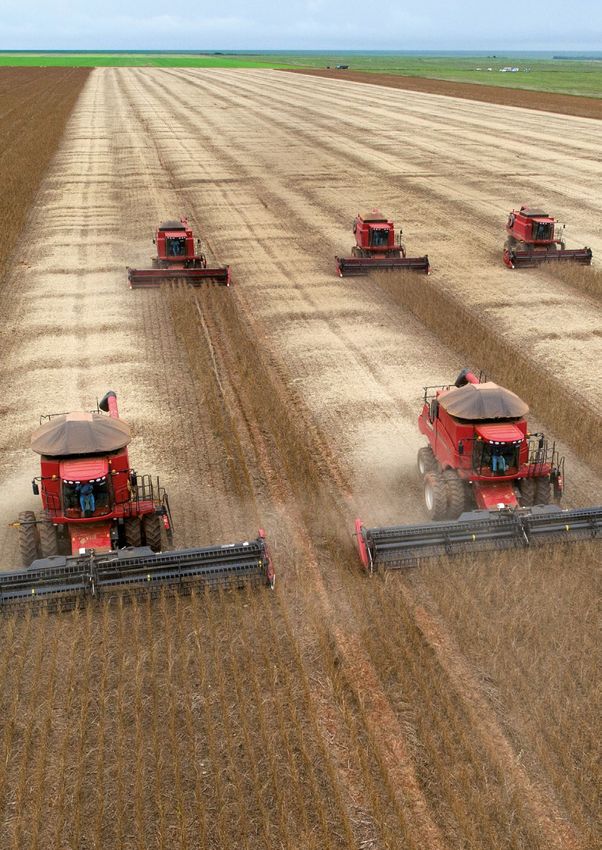
A combine harvester in a corn field in Ines Indart, Argentina. | © Diego Giudice/Bloomberg/Getty Images
A Public Eye Report | June 2019   5

                Cocoa farm labourers collect cocoa pods in Duekoue, Côte d'Ivoire. | © Pascal Maitre/Panos Pictures

and their activities in Switzerland and is now able to shed light    export statistics. This further increases the opacity of an al-
on this very opaque sector. It will come as a surprise to many       ready intransparent sector.
that at least 50% of global grain trade is handled by Swiss-
based actors, and that 40% of globally traded sugar is dis-
patched from computers in Switzerland. Similarly, Switzerland        A PROBLEMATIC BUSINESS MODEL
has its hand in at least 30% of cocoa traded globally, at least
30% of coffee, and at least 25% of cotton. There can be no doubt     A closer look at the sector reveals: The trading companies oper-
that the country has become one of the most important trading        ating from Switzerland also handle processing and many have
hubs for agricultural commodities. Over the last decades many        moved upstream into the production of agricultural commodi-
of the world’s leading agricultural traders have set up their        ties. They either own or lease land or enter into contract farming
trade offices along Lake Geneva or in central Switzerland.           agreements, which allows them to exert considerable control
Lured by an attractive tax policy, a discreet and business-friend-   over the production stage. Many Swiss-based agricultural trad-
ly environment and little regulation in relation to transparency     ers thus cannot be regarded as pure trading companies but
or human rights protections abroad, most agricultural commod-        should be seen as global value chain managers instead. The
ity traders remain largely unknown to the general public. This       move upstream into production creates more direct links be-
is also a result of the fact that commodity trading in Switzer-      tween powerful traders and largely unorganised small-scale
land is comprised largely of so-called transit trade, so that        producers and workers. Because the latter two usually lack the
goods traded via Switzerland do not show up in import and            bargaining power to negotiate better conditions or protect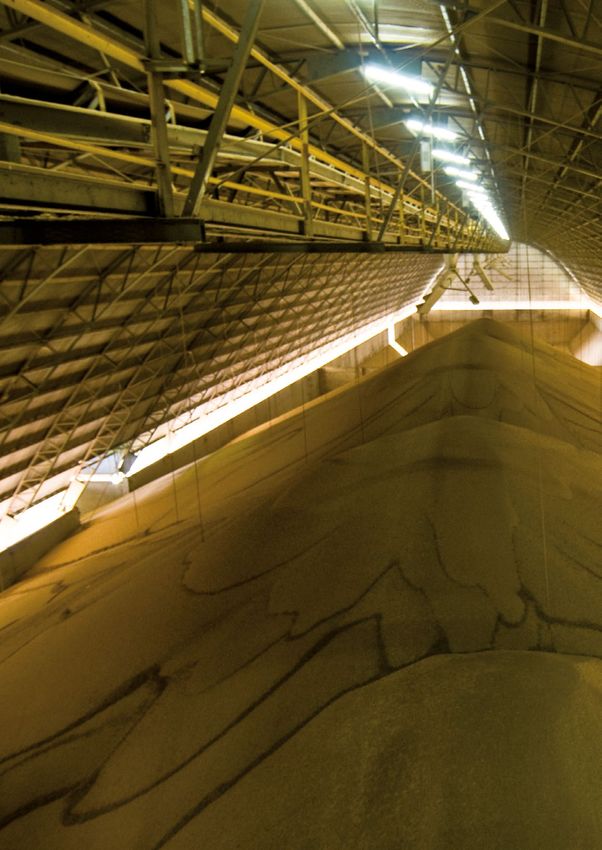
6   Agricultural Commodity Traders in Switzerland – Benefitting from Misery?

themselves against risks, these business relations are often all         people working in production or living in producing areas. Con-
but fair. As this report documents, the very business models of          trary to small-scale farmers and workers, multinational compa-
agricultural traders are thus connected to the many cases of hu-         nies are in a position to shape, interpret and bend the rules gov-
man rights violations in producing countries.                            erning the sector in their favour. This power imbalance is
                                                                         directly reflected in the insufficient policies governing human
                                                                         rights, transparency or competition, as these are often rigged to-
LACK OF REGULATIONS, LACK OF ENFORCEMENT                                 wards already powerful corporations rather than the people in
                                                                         more acute need of protection.
In producing countries, the cause of continuous human rights
violations lies largely in the weak enforcement of laws and reg-
ulations. In the home states of agricultural traders however, the        WHAT NEEDS TO HAPPEN IN SWITZERLAND
main issue is less one of enforcement but rather of an actual lack
of regulation governing human rights protections abroad. Swit-           Switzerland, as a home state to many of the globally significant
zerland still relies largely on corporate social responsibility and      agricultural traders, has a central role to play in ensuring more
has not, to date, issued stringent regulations to tackle human           balanced power relations along global agro-food value chains.
rights violations occurring along the value chains of Swiss-             Switzerland must ensure there is sufficient transparency in
based commodity traders. The persistent obscurity surrounding            the commodity trading sector as well as mandatory Human
the traders’ business compounds the problem. Here too, regula-           Rights Due Diligence that covers high-risk activities and en-
tions requiring more transparency in the sector are in dire need.        sures respect for human rights wherever Swiss companies do
                                                                         business. Moreover, in order to resist the concentration pro-
                                                                         cesses in the global agro-food sector, there is a clear need for
ROOT CAUSE: POWER ASYMMETRY                                              more effective and far-reaching competition policies. Agricul-
                                                                         tural traders as global value chain managers also have an im-
One of the reasons for both inexistent and feeble regulations,           portant role to play in affecting change. This ultimately entails
and weak enforcement in producing countries and home states              a fundamental shift in the relations between traders and peo-
alike, lies in the ability of large, financially strong market players   ple working in production, which is essential in order to en-
such as agricultural traders to abuse their position of power. The       sure the human right to an adequate standard of living, among
unequal distribution of power observed in the global agro-food           other rights. To this end, transparency regarding commodity
system is not arbitrary. On the contrary, it is structural and de-       traders’ business activities and relationships, their pricing
liberate as it enables and perpetuates a system that benefits the        schemes, as well as financial data, is a central requirement and
large multinational companies to the detriment of millions of            would be a decisive first step.
A Public Eye Report | June 2019   7

                                               1

                  Introduction

Soy warehouse at Fartura Farm in Mato Grosso state, Brazil. | © Paulo Fridman/Corbis/Getty Images
8   Agricultural Commodity Traders in Switzerland – Benefitting from Misery?

A structural transformation is under way in the global food sys-       from earning a living income.7 Similar to poverty wages for ag-
tem. The key drivers are rapidly increasing demand for food and        ricultural workers, the unacceptably low incomes of small-scale
changing dietary patterns, technological advances, and decades         farmers constitute a gross injustice. The meagre income of
of national and international policies based on a strict liberali-     farmers leads, in many cases, to human rights violations as
sation agenda. As a result, agricultural production tripled be-        farmers are forced to cut costs, including by relying on child
tween 1960 and 2015, fuelled by productivity increases and a           labour and by cutting corners on safety at work.
massive expansion of land under production.1 This development              The structural transformation of the global food system is
helped to keep food prices at bay in spite of a rapidly growing        characterised by two key features: the expansion of large-scale,
world population. In fact, food prices have shown an overall           high-input, industrial agriculture on the one hand and the emer-
downward trend, although with some notable variations.2 This           gence of global value chains with marked consolidation process-
is good news for the majority of consumers whose food expen-           es on the other. The two trends are mutually reinforcing. They
ditures have decreased over time as a share of disposable house-       increasingly lead to hazardous and exploitative working condi-
hold income. But at the other end of the supply chain, agricul-        tions and to uneven power relations along the value chains.
tural producers and other people living from agriculture have              Largely powerless small-scale farmers and agricultural
suffered a great deal under the depressed food prices and in           workers and very powerful agr0-food companies including
many cases are deprived of a decent living.                            traders are two sides of the same coin. The widely observed
     Moreover, the transformation of the food system has spec-         consolidation processes add to the power and influence of com-
tacularly failed to eradicate hunger and malnutrition. While suf-      panies engaged along value chains. Consolidation features two
ficient food is available at the global scale, close to 800 million    dimensions: a horizontal dimension of market concentration at
people are chronically hungry and some two billion suffer mi-          one stage of the chain and a vertical dimension of integrating
cronutrient deficiencies. At the same time, the prevalence of          over different stages of global value chains (GVCs). Agricultural
overweight and obesity based on an unhealthy diet and over-            commodity traders moving upstream into production by means
consumption is rapidly increasing – not just in developed coun-        of joint ventures, land acquisition, or contract farming arrange-
tries but in emerging and developing countries as well – and has       ments are particularly closely linked to farmers and workers.
reached epidemic proportions. Also, the expansion of food pro-         The increasingly direct relationships and the huge imbalance of
duction has come at a heavy cost to natural resources and the          bargaining power between farmers and traders brings with it a
environment. Groundwater levels have become alarmingly low             responsibility of the latter for the working conditions under
in many places, water resources have been contaminated by ag-          which the goods they produce are traded.
ricultural chemicals, forests are rapidly disappearing, biodiver-          The majority of the most important global traders of agricul-
sity has been grossly eroded, and agriculture is among the major       tural commodities have significant business links to Switzer-
emitters of green house gases.3                                        land, ranging from the many who are headquartered in Switzer-
     The agricultural sector is still a key employer in many parts     land, to those whose global trading branches are based here, to
of the world, particularly in low-income countries, where the          those where only selected or regional activities are conducted
sector absorbs close to two thirds of the working population on        in Switzerland. Public Eye’s analysis shows that the country is
average.4 Many of them work under dire conditions producing            a top-ranked trading hub for agricultural commodities. Hence,
labour-intensive crops destined for the world market, such as          there is a strong case for requiring Switzerland to take bold
bananas, cocoa, coffee, cotton, or oranges. As evidenced in this       steps to ensure that agricultural commodity traders operating
report, human and labour rights violations are widespread in           from here live up to their responsibility to respect human rights
the production of agricultural commodities5, particularly in the       in producing countries.
Global South.                                                              The overall goal of this report is to shed light on the role of
     Hilal Elver, the United Nations Special Rapporteur on the         Switzerland as a key trading hub for agricultural commodities
Right to Food, recently said: “Agricultural workers, including         and to make the case for regulation of the sector. More specifi-
women, children and migrants and plantation workers, are in-           cally, the report aims to:
creasingly faced with low wages, part-time work, informality,
and a lack of social and economic protections. They are further        – Provide a detailed account of agricultural commodity traders
faced with dangerous working conditions owing to regular ex-             operating from Switzerland and of the aggregate share of se-
posure to pesticides and to long hours spent in extreme tem-             lected agricultural commodities traded via Switzerland;
peratures without adequate access to water.”6 Agricultural com-        – Highlight the role of agricultural commodity traders as global
modities with multiple uses, particularly the labour-intensive           value chain managers with important links to production;
ones such as palm oil and to a large extent sugar cane, are of         – Link the huge power asymmetry along value chains to the
particular concern as their demand is rapidly expanding, put-            multitude of human and labour rights violations in the pro-
ting additional pressure on the weakest links of the value chain         duction of many agricultural commodities;
– small-scale producers and workers.                                   – Clarify Switzerland’s obligation to ensure its traders abide by
     Agricultural workers are not the only ones in today’s global        the rules – everywhere.
food system who are denied a decent remuneration for their
hard labour. Small-scale farmers producing for the world mar-          Definitions of key terms used in the report and the methodolog-
ket, such as cocoa or coffee farmers, are often a far cry away         ical approach are provided in the annex.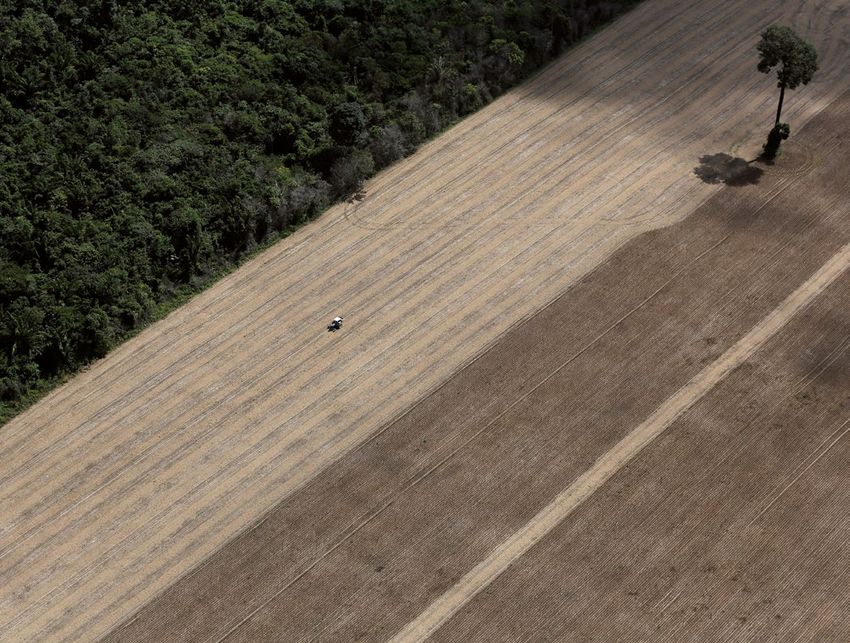
A Public Eye Report | June 2019   9

                              2

The Big Picture

Industrial farm near Sinop in Mato Grosso, Brazil. | © Fábio Erdos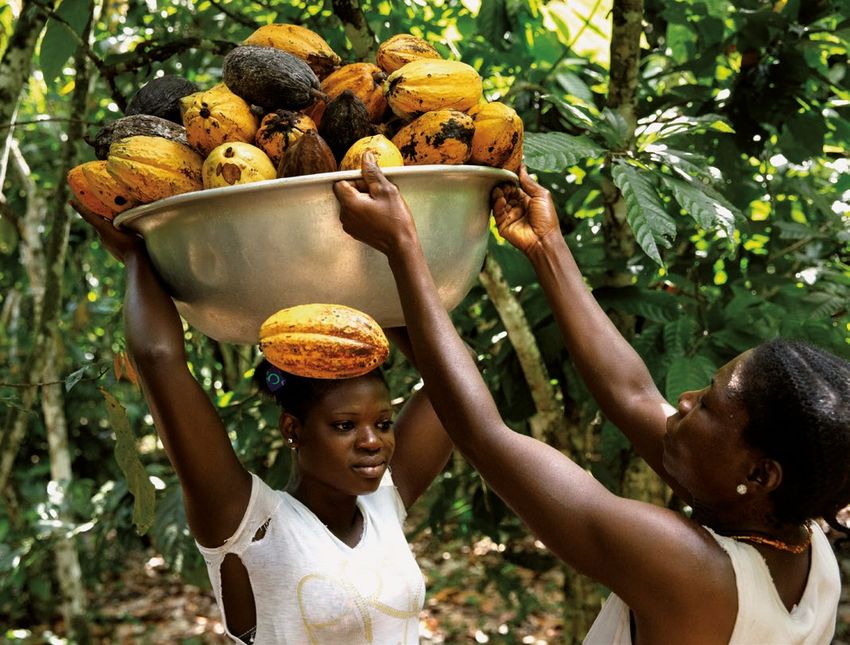
10 Agricultural Commodity Traders in Switzerland – Benefitting from Misery?
2.1 – THE STRUCTURAL TRANSFORMATION OF
THE GLOBAL AGRO-FOOD SYSTEM Of particular concern are the grave human
and labour rights violations inherent
Population growth, rising income levels and urbanisation are in the current system of production of many
driving up food demand and have put in motion a structural
agricultural commodities that
transformation of the global agro-food system that is still un-
derway. This transformation has been fuelled further by techno- are destined for the world market.
logical progress and facilitated by economic policies biased to-
wards free trade and an export-led development model. The
fast-growing global middle class demands more animal pro-
teins, while the changing dietary needs and habits of an ever- 2.2 – PRODUCTION AND TRADE: KEY FIGURES
increasing number of city dwellers means higher consumption AND TRENDS
of processed and convenience foods. Moreover, the utilisation
of agricultural produce for industrial and energy purposes (e.g. Overall, China, India, Brazil and the USA are the world’s key ag-
agro-fuels) adds to the aggregate demand for agricultural com- ricultural producers. For specific crops, however, other countries
modities. According to the latest forecast by the Organisation and regions dominate the scene. The bulk of cocoa, for instance,
for Economic Co-operation and Development (OECD) and the is produced in the West African countries of Côte d’Ivoire and
Food and Agricultural Organization of the United Nations Ghana, while oil palm trees are predominantly cultivated in In-
(FAO), growth in global demand for agricultural commodities is donesia and Malaysia. Looking at key agricultural commodities,
expected to slow down in the coming decade, but developments wheat, corn, rice and soybeans are by far the most important
will vary across commodities and geographic regions.8 crops in terms of total acreage (between 120 and 220 million
World agricultural supply has successfully kept pace with hectares each), according to data from FAOSTAT, the FAO’s sta-
developments on the demand side, as is evidenced by the long- tistics division.10 The dominant role of corn and soybeans is ex-
term trend of decreasing food prices (see figure 2.1). However, plained by their various uses. This is also true of sugar cane and
the expansion of supply has come at high human and environ- oil palms, which rank high in terms of production volume.
mental costs. The rising dominance of industrial and increas- The term “flex crops” has been coined to describe agricul
ingly monoculture-based agricultural production systems and tural commodities with “multiple and interchangeable uses as
the expanding acreage under cultivation are far from sustain- food, feed, fuel, and industrial material“.11 The rapidly growing
able.9 Of particular concern, and the focus of this report, are the consumption of fuel and meat pushes up demand for agro-fuels
grave human and labour rights violations inherent in the cur- and animal feed respectively, and leads to a corresponding ex-
rent system of production of many agricultural commodities pansion of production. For instance, the production of agro-fuel
that are destined for the world market. more than doubled between 2007 and 2015, a growth rate in
Figure 2.1 – Development of real food price index
250
200
150
100
Index (1960 = 100)
50
0
1960
1962
1964
1966
1968
1970
1972
1974
1976
1978
1980
1982
1984
1986
1988
1990
1992
1994
1996
1998
2000
2002
2004
2006
2008
2010
2012
2014
2016
2018
Source: Calculations based on World Bank Commodity Price Data using the monthly US Consumer Price Index to convert to real prices.Index (1960 = 100)
Index (1960 = 100)
50 50 A Public Eye Report | June 2019 11
0 0
1960
1962
1960
1962
1964
1964
1966
1968
1966
1968
1970
1970
1972
1974
1972
1974
1976
1978
1976
1980
1978
1982
1980
1984
1982
1984
1986
1988
1986
1988
1990
1992
1990
1992
1994
1994
1996
1998
1996
1998
2000
2000
2002
2004
2002
2004
2006
2008
2006
2010
2008
2012
2010
2012
2014
2014
2016
2018
2016
2018
Figure 2.2 – Trade share as percentage of production, Figure 2.3 – Export value of important agricultural
2016 commodities, average 2015–2017
100 100 60 60
50 50
80 80
40 40
60 60
30 30
40 40
20 20
Billion USD
Billion USD
20 20
10 10
%
%
0 0 0 0
Soybeans
Wheat
Soybeans
oil
Wheat
oil
Sugar
Corn
Sugar
Rice
Corn
Coffee
Rice
Coffee
Cotton
Cotton
Tobacco
Bananas
Tobacco
Bananas
Cocoa
Tea
Cocoa
Tea
Orange juice
Orange juice
Soybeans
Wheat
Soybeans
Wheat
oil
oil
Sugar
Corn
Sugar
Corn
Rice
Coffee
Rice
Coffee
Cotton
Cotton
Tobacco
Bananas
Tobacco
Bananas
Cocoa
Tea
Cocoa
Tea
Orange juice
Orange juice
Palm
Palm
Palm
Palm
Source: FAOSTAT, except for sugar and cotton (OECD.STAT), Source: Calculations based on data from ITC Trade Map
palm oil (USDA – FAS), and orange juice (USDA – FAS)
excess of 10% per year.12 Much of the production expansion oc- share of global agricultural exports increased from 9.9% to
curs in new areas, regularly giving rise to land conflicts. The 17.4%. At the same time, their share of global imports jumped
Non-Governmental Organisation (NGO) GRAIN documented from 5.6% to 15.6%. This trend, which is forecast to continue
close to 500 cases of land grabbing globally between 2006 and over the coming years, reflects the strong position of the Amer-
2016, many of them related to such flex crops.13 icas as a key agricultural export region, and the key role of Asia
As illustrated in figure 2.2, the internationally traded share as net importer of agricultural products.16
of the most important agricultural goods is just a fraction of In terms of global production, the share of agricultural
their global production, often below 50%. In the case of rice, just value added as a percentage of the world Gross Domestic
5% of total production ends up being traded internationally. For Product (GDP) has continuously declined over the last 20
corn the corresponding share is 13%, for bananas 18%, and for years (1997–2016), from 5.7% to 3.5%. However, the impor-
wheat 25%. Agricultural goods produced in tropical regions and tance of the agricultural sector differs considerably at the na-
dominantly consumed in northern countries evidently display a tional level. While in low-income countries agriculture still
higher trade share of 70% and more. Over the past two decades, contributes 25% to the GDP, this figure is a mere 1.3% in
these trade shares have remained constant for key agricultural high-income countries.17
goods, with the exception of soybeans whose internationally
traded share rose by 20%.14
In terms of value, the main agricultural commodities shipped
around the world are (in decreasing order): soybeans, wheat,
The internationally traded share
palm oil, sugar, corn, rice, coffee, cotton, tobacco, bananas, cocoa, of the most important agricultural goods
tea, orange juice (see figure 2.3). With an export value of USD 53 is just a fraction of their global
billion on a three-year average (2015–2017), soybeans are the un- production, often below 50%.
contested leader, topping runner-up wheat by almost USD 20
billion. In 2018, the USA and Brazil accounted for 85% of soy-
bean exports, while China alone purchased 60% of all exports.
Similarly, over 80% of palm oil was exported by just two coun- A similar development can be observed in the area of em-
tries, Indonesia and Malaysia, with India and China importing ployment. In 2017, 28.5% of the global work force was employed
almost 30% of the total. Highly concentrated trade – with three in agriculture, down from 40% in the year 2000. In low-income
countries responsible for more than half of all global exports of countries, on average two out of three jobholders are still found
a commodity – can also be found in corn (67%), cocoa (66%), cot- in agriculture compared to three out of one hundred in high-
ton (69%), rice (62%), coffee (51%), and tea (53%).15 income countries. Accordingly, the vast majority of the world-
Value-based agricultural trade has grown by 5% per year wide 930 million people working in agriculture are found in low-
since the mid-1990s driven mainly by emerging countries. Their income countries.1812 Agricultural Commodity Traders in Switzerland – Benefitting from Misery?
1
2.
x
HOW COMMODITY TRADING WORKS
Bo
Trade in agricultural commodities takes place in various transactions where two parties can exchange commodity
forms of commodity markets. As shown in the diagram derivatives on individual terms.
below, derivative markets can be distinguished from spot
markets. While in derivative markets rights and obliga- In addition to traditional speculators (i.e., experts of physical
tions to trade a commodity in the future are exchanged, markets whose activities are closely linked to the funda-
on spot markets physical commodities are directly mental supply and demand dynamics in the underlying
traded. Price developments on the two markets are highly physical markets), who have been active in derivative
correlated. markets for centuries and act as counterparts to commercial
traders by hedging their commodity transactions, financial
Commodity derivatives, i.e., standardised options and fu- investors with ample capital resources have become
tures contracts with a specified date and price, can be increasingly active in commodity derivative markets.
traded on regulated exchanges (so-called futures markets). Financial investors such as banks, pension funds and hedge
The world’s largest exchanges for agricultural commodi- funds are not interested in the physical goods, but only
ties are located in the USA. In Europe, important commodity engage in derivatives trading and invest in commodities as
exchanges are located in Amsterdam, London, Paris, and an asset class. The strong rise of financial actors is known
Frankfurt. In addition, increasingly important exchanges as the financialisation of commodity markets.
are found in the emerging markets. Commodity exchanges
are organised marketplaces where transa ctions in On commodity spot markets, physical goods change owner-
financial derivat ives on commodities are centralised. They ship simultaneously with the conclusion of a contract i.e.,
provide a price discovery function for physical com- goods that are actually available are delivered with no or only
modity traders as prices on futures markets are used as a a short delay. Because commodities are bulky and costly
benchmark for spot transactions. Thus, derivative markets to transport, spot market transactions are usually geographi-
serve as central pricing mechanism for the international cally dispersed. They are often contractual arrangements
commodity trade. Furthermore, they serve an insurance between two actors who do business with each other, includ-
function for spot market participants who can use de ing producers, consumers and traders of physical agri-
rivative markets to hedge against the risk of price fluctua cultural commodities. As the terms of business are generally
tions. Commodity derivatives are also traded over- freely negotiable in physical trade, the respective bar-
the-counter (OTC). OTC markets are little-regulated gaining power of market participants becomes critical.
Commodity markets
Commodity markets
Derivative markets
right (options)/obligation (futures) Commodity spot markets
to trade a physical commodity in the future trading of physical commodities
at a given price
bilaterally and
regulated exchanges
unregulated over the
(futures markets)
counter (OTC)
Source: Cornelia Staritz et al., 2015A Public Eye Report | June 2019 13
3
The role of Switzerland
as a global trading hub
for agricultural commodities
Employees on the trading floor of Glencore Agriculture. | © Simon Dawson/Bloomberg/Getty Images14 Agricultural Commodity Traders in Switzerland – Benefitting from Misery?
The history of agricultural production in Switzerland is repre- modities. Commodity trading itself has a long history in Swit-
sentative of similar developments in most high-income coun- zerland, going back to the second half of the 19th century (see
tries. While in the early 19th century 60% of the total workforce box 3.1).
in Switzerland was employed in agriculture, this number de-
creased quickly with industrialisation (1900: 31%, 1950: 19.5%).19
The newest figures from 2018 show 145,000 employed in the
Today, the majority of the globally
agricultural sector in Switzerland, which translates to approxi-
mately 3% of the total workforce.20 The sector has become eco-
significant agricultural traders
nomically negligible – according to the World Bank it made up a are either based in Switzerland or operate
mere 0.66% of Switzerland’s GDP in 2016.21 important trading branches here.
Switzerland has become a country of the service industry,
with the sector currently employing over 75% of the work-
force. Due to the supportive business climate, a tailor-made
tax regime and a stable political setting, the small country has To this day, traders are greeted with open arms in Switzer-
also become one of the most important trading hubs for com- land. In May 2017 the Canton of Geneva signed a Memorandum
1
THE HISTORY OF COMMODITY TRADING IN SWITZERLAND
3.
x
Bo
The origins of commodity trading in Switzerland can be most important trading company for ores and metals,
traced back to the 19th century and it all started with settled in Zug.
agricultural goods.22 In 1851, the Volkart Brothers founded
a trading company in Winterthur which primarily traded The Swiss tax regime has always been extremely attractive
cotton from India. At the turn of the century, Volkart was to trading companies. But it was not the only reason
one of the largest merchants of Indian cotton and one of for companies to relocate here: After the Second World
the world’s major coffee traders. In the French speaking part War, Switzerland was one of the few countries in which the
of Switzerland, André & Cie, a company founded in 1877 import and export of capital was not subject to any
and headquartered in Lausanne, quickly became one of the restrictions or government controls. The presence of
world’s leading grain traders. The third historically signifi- important service providers was another decisive factor for
cant commercial enterprise was the Basel Missionary many companies to establish their offices in the country.
Society, with its United Trading Company specialised in Banks, specialised insurance companies, inspection firms,
trading cocoa and which soon became one of the leading as well as logistics and cargo transport companies were at
cocoa traders globally. their disposal. Numerous companies also supplied the
fast-growing manufacturing industry, most importantly the
But these traditional Swiss trading houses did not make the food company Nestlé, based in Vevey, along with various
country the trading hub it is today. In fact, most of the other chocolate producers.
traditional companies did not survive the competition. Only
Volkart still exists to some extent: It was taken over by the Furthermore, the fact that Switzerland was not a member
Reinhart family at the beginning of the 20th century. of the United Nations (UN) until 2002 provided, prior to
Reinhart is active in the cotton trade and sold its coffee this date, lucrative business opportunities for traders based
branch in 1989. Today, the former coffee trading branch of in Switzerland. For example, André & Cie were able to
Volkart – Volcafé – is still headquartered in Switzerland but circumvent the UN trade embargo against the former
is owned by the British trading house ED & F Man Holdings. Rhodesia (today Zimbabwe) and the US government grain
boycott against the Soviet Union. Marc Rich, a trader with
In the 1950s, international companies started to settle Philipp Brothers and founder of the Swiss trading company
along the shores of Lake Geneva and in central Switzerland. Marc Rich & Co. (later rebranded Glencore) admitted to his
Tailor-made tax breaks facilitated Cargill’s decision to biographer 24 that he did his “most important and most
locate its European office in Geneva in 1956. The tax profitable” work by breaking international embargoes such
authorities agreed to a lump sum of 50,000 francs per year, as in doing business with apartheid South Africa. He also
with the possibility of renegotiating the agreement if the traded with Cuba, Angola and Nicaragua when these
activities were to evolve.23 And evolve, they did: Today, countries too faced an embargo. Rich was later indicted by
Cargill is the world’s largest agricultural commodity trader. a Federal grand jury in the United States for tax evasion and
Also in 1956, Philipp Brothers, who at the time was the for making oil deals with Iran during the Iran hostage crisis.25A Public Eye Report | June 2019 15
of Understanding with COFCO International Ltd. (COFCO Int.), lished by the STSA as can been seen in table 3.1. The authors of
the international trading arm of the Chinese public conglomer- the report used a bottom up methodology analysing individual
ate China National Cereals, Oils and Foodstuffs Corporation company data, which was then cross-checked with information
(COFCO Group).26 Signed by State Council Pierre Maudet in from literature.
the presence of then Federal Council President Doris Leuthard, Public Eye has come up with own estimates based on a sim-
COFCO Int. was granted the full support of the canton for its ilar methodology including a thorough analysis of media cover-
business expansion. The canton also committed itself to provid- age, yearly company reports and data provided from interna-
ing a friendly business environment for the company.27 tional trade associations. Even going by Public Eye’s conservative
Switzerland is currently home to over 500 companies active estimates and focusing solely on trading companies (not Swiss
in commodity trading. These commodity traders top the list of manufacturers such as Nestlé 32 who also buy agricultural com-
companies with the highest turnover.28 Of the 500 commodity modities), the findings confirm Switzerland’s central role in the
traders, approximately 150 are either specialised in agricultural global trade in agricultural commodities. Public Eye estimates
commodities or carry a mixed portfolio of energy, minerals and that at least 40% of globally traded sugar is dispatched from
metals as well as agricultural commodities.29 Today, the majori- computers in Switzerland, as well as at least 30% of cocoa, at
ty of the globally significant agricultural traders are either based least 30% of coffee, and at least 25% of cotton. A significant
in Switzerland or operate an important trading branch along share of the global trade in grains is also handled in Switzer-
Lake Geneva or in central Switzerland. land. The companies collectively referred to as ABCD (Archer
This local presence underpins Switzerland’s pivotal role as a Daniels Midland, Bunge Limited, Cargill Incorporated, and
commodity trading hub, yet says nothing about its market share. Louis Dreyfus Company) who together make up between 70%
It is the very nature of transit trade that fosters the opacity of and 90% of the global grain trade, have important grain trading
the sector and makes it difficult to pinpoint numbers: Usually, activities in Switzerland. Public Eye thus estimates Switzer-
the commodities are neither imported physically to nor export- land’s share in global grain trade to be close to 50%.
ed from Switzerland, even though the deals are organised and
orchestrated by parties in Switzerland. Thus, goods traded via
Switzerland usually do not appear in trade statistics and are
It is the very nature of transit trade
therefore hard to track.
Researchers interested in the subject will at some point turn
that fosters the opacity of the sector.
to data provided by the Swiss Trading and Shipping Association Goods traded via Switzerland
(STSA), the most important industry association for commodity usually do not appear in trade statistics
traders. The organisation provides statistics on Switzerland’s and are therefore hard to track.
market share and these numbers are widely used in research
papers as well as in government reports even though the STSA
has never clarified the underlying methodology it uses nor is it
clear which timeframe their data refers to. While the absence of concise data is vexing, it is not sur-
In its 2018 report on the commodity trade sector in Switzer- prising. The lack of transparency and the discretion of the
land30, the Federal Council used figures from a study31 financed whole sector give the individual players advantages in the mar-
by the Federal Office for the Environment on environmental ket and can therefore be considered part of their business mod-
impacts of commodities traded in Switzerland. These market el. In addition, the majority of the trading companies are pri-
share estimates are largely in the same range as the ones pub- vate and many of them are family owned. Only a few are
Table 3.1 – Estimates of Switzerland’s market share in agricultural commodity trade
CROPS ESTIMATE STSA ESTIMATE FEDERAL COUNCIL ESTIMATE PUBLIC EYE
Cotton No data 28 % > 25 %
Coffee 50 % 53 % > 30 %
Cocoa 35 % 35 % > 30 %
Grains 60 % 43 % (wheat) > 50 %
Sugar 50 % 44 % > 40 %
Source: STSA, 2019; Niels Jungbluth and Christoph Meili, 2018; own estimation16 Agricultural Commodity Traders in Switzerland – Benefitting from Misery?
Table 3.2 – Key figures of investigated Swiss-based agricultural commodity traders
HEAD ACTIVITY REVENUE NUMBER OF
COMPANY QUARTERS IN SWITZERLAND COMPANY TYPE MAIN PRODUCTS (2018) EMPLOYEES
Alvean Sugar, Bilbao, Spain Trading hub in Geneva Private, 50:50 joint Sugar Unknown Unknown
S.L. venture (JV)
between Cargill and
Copersucar
Archer Daniels Chicago, USA Global trade desk in Rolle Public, listed on Grains (corn, wheat, Global: Global:
Midland New York Stock rice), oilseeds USD 31,000 (2019)
Company Exchange (NYSE) (soybeans, palm oil) 64.3 billion Switzerland:
(ADM) Switzerland: > 160 (2019)
USD 12.9 billion
Bunge, Ltd. White Plains, Agricultural commodity Public, listed Grains (wheat, Global: Global:
USA trading coordinated on NYSE corn, rice), oilseeds USD 31,000 (2018)
from two desks, one of (soybeans, palm 45.7 billion Switzerland:
which is in Geneva oil), sugar, fertilizer Switzerland: 85 (2018)
> USD
500 million
Cargill, Inc. Minneapolis, Global hub for grains and Private, family Grains (wheat, corn, Global: Global:
USA oilseeds trading in Geneva owned barley, sorghum) USD 155,000 (2019)
oilseeds (soybeans, 114.7 billion Switzerland:
palm oil), cotton, Switzerland: > 400 (2019)
cocoa, sugar (via > USD 500
JV Alvean), meat million (2017)
Chiquita Principal offices Principal offices in Etoy (CH) Private, delisted Bananas, Unknown Global:
Brands in Etoy, and Fort Lauderdale (USA), from NYSE in pineapples 18,000 (2019)
International, Switzerland, Chiquita Holding SA, 2015, JV between Switzerland:
Inc. and Fort registered in Fribourg Grupo Cutrale 100 (year
Lauderdale, and J. Safra Group unknown)
USA
COFCO Beijing, China Global Corporate and Trading Trading arm of Grains (wheat, Global: Global:
International headquarters in Chêne- Chinese state- corn, rice, barley), USD 34 billion 12,000 (2018)
Ltd. Bougeries, Geneva (COFCO owned COFCO oilseeds (soybeans), Switzerland: Switzerland:
International Trading SA, Group sugar, coffee, > 500 million 150 (2017)
COFCO International Freight cotton (2016, only for
SA, COFCO Resources SA) COFCO
Resources SA)
ECOM Agro- Pully, Headquartered in Pully Private, family Coffee, cocoa, > USD 4 billion Global:
industrial Switzerland owned (94%) cotton, sugar, (2011) 5,400 (2017)
Corp., Ltd. grains, palm oil Switzerland:
70 (year
unknown)
Glencore Rotterdam, Trade hub for grains, oilseeds, JV between parent Grains (wheat, Unknown Global:
Agriculture, Netherlands cotton and sugar in Baar, company Glencore, sorghum, corn, 13,000 (2019)
Ltd. de facto controlled by parent Canada Pension barley), oilseeds
company Glencore head Plan Investment (soybeans),
quartered in Baar Board and British pulses, sugar,
Columbia Invest cotton
ment Management
Corp oration
Louis Dreyfus Rotterdam, Largest hub for commercial Private, family Oilseeds (soy- Global: Global:
Company Netherlands and merchandising activities owned beans, palm oil), USD 18,000 (2019)
(LDC) in Geneva where most of grains (wheat, 36.5 billion Switzerland:
platforms have a global corn, rice), coffee, Switzerland: > 350 (2019)
reach (sugar, dairy, non-US cotton, sugar, EUR 5.7 billion
cotton, proprietary and juice, dairy (2012)
third-party freight chartering
activities), also acts as
strategic regional headquar-
ters for Europe and Black Sea
region, indications that
global juice business is also
handled from GenevaA Public Eye Report | June 2019 17
Table 3.2 – Key figures of investigated Swiss-based agricultural commodity traders (CONTINUED)
HEAD ACTIVITY REVENUE NUMBER OF
COMPANY QUARTERS IN SWITZERLAND COMPANY TYPE MAIN PRODUCTS (2018) EMPLOYEES
Neumann Hamburg, Several subsidiaries in Private, family Coffee Global: Global:
Kaffee Gruppe Germany Switzerland, e.g. Bernhard owned EUR 2.4 billion 2,000 (2019)
Rothfos Intercafé and Switzerland: Switzerland:
NKG Tropical Farm Manage- CHF 130 million 25 (Bernhard
ment which manages (2001, Bernhard Rothfos
all farming operations, both Rothfos Inter- Intercafé, 2019)
headquartered in Zug café) 3 (NKG Tropi-
< CHF 1 million cal Farm
(NKG Tropi- Management,
cal Farm 2019)
Management)
Olam Singapore Regional hub based Publicly listed, Cocoa, coffee, Global: Global:
International in Geneva 53.6% owned by edible nuts, USD 72,000 (2019)
Limited Temasek Holdings oilseeds (palm oil, 26.27 billion Switzerland:
and 17.4 % by soybeans), sugar, Switzerland: 10–19 (year
Mitsubishi spices, dairy, grains unknown unknown)
Corporation (wheat, rice, corn)
vegetables, cotton,
packaged foods
Paul Reinhart Winterthur, Headquartered in Winterthur Private, family Cotton, pulses, CHF 700 million Global:
AG Switzerland owned oilseeds, nuts (2012) 130 (2019)
Switzerland:
60 (2019)
Socotab Frana Geneva, Headquarters, commercial, Private, 100% Raw tobacco CHF 10–19 Switzerland:
SA Switzerland operational and financial subsidiary of a JV million 10 (year
centre of Socotab Group in between Socotab unknown)
Geneva Leaf Tob acco
Company Inc. and
Universal Leaf
Tobacco Company
Sucafina SA Geneva, Headquartered in Geneva Private, Coffee USD 516 million Global:
Switzerland family owned (2012) 850 (2019)
Switzerland:
25 (year
unknown)
Sucocitrico Araraquara, Trading Branch in Lausanne Private, Citrus products, Global: Global:
Cutrale, Ltd. Brazil family owned soybeans USD 1.3 billion 18,000
(2013) (in harvest
Switzerland: season, 2019)
CHF 1–10 million Switzerland:
(2016) unknown
Volcafé, Ltd. Winterthur, Headquartered in Winterthur, Private, Coffee Global: Global:
Switzerland, Volcafé Holding in Winterthur family owned USD 8.12 billion > 6,000
Subsidiary (ED & F Man) (ED & F Man,
of ED & F Man Switzerland: 2018)
Holdings > CHF 500 Switzerland:
Limited, million (Volcafé 50–99 (2016)
headquartered Holding, 2016)
in London, UK
The information was obtained from various, publicly available sources, including annual reports, company websites, press articles and business
information platforms. Detailed sources are available upon request from the authors. All information is subject to change and Public Eye makes no claim
as to the completeness of the information.18 Agricultural Commodity Traders in Switzerland – Benefitting from Misery?
publicly listed and thus obliged to provide a minimum of trans- COFCO Int., Glencore Agriculture Limited (Glencore Agri) and
parency. Olam International Limited (Olam) as well as ECOM Agro
Because of this opacity, it can be very challenging to find industrial Corp. Limited (ECOM). The company with the larg-
information on individual companies. To shed some light on est portfolio is Cargill Incorporated (Cargill), followed by Louis
how global trends in the sector of agricultural trade are reflect- Dreyfus Company (LDC) and Olam. In addition, there is a clear
ed in Switzerland, as well as to illustrate the wide range of in- focus within many companies: Archer Daniels Midland Com-
fluential market players and their diverse portfolios, Public Eye pany (ADM) specialises in soy and corn, Bunge Limited (Bunge)
has investigated 16 companies in detail (see table 3.2). in wheat, corn, rice and oilseeds, Glencore Agri in wheat and
barley, Olam in rice, cocoa and coffee, and ECOM in coffee and
cocoa.
The other half of the companies is comprised of so-called
The lack of transparency and “mono crop” traders, which, for the most part, specialise in only
the discretion of the whole sector give the one agricultural commodity. Fully specialised are Alvean Sugar
individual players advantages in SL (Alvean) in sugar, Sucafina SA (Sucafina) and Neumann Kaf-
fee Gruppe (Neumann) in coffee, Socotab Frana SA (Socotab) in
the market and can therefore be conside-
Oriental raw tobacco and Volcafé Ltd. (Volcafé) in coffee. Large-
red part of their business model.
ly specialised are Paul Reinhart AG (Reinhart) in cotton, Chi
quita Brands International Inc. (Chiquita) in bananas, as well as
Sucocitrico Cutrale Ltda. (Sucocitrico) in oranges.
Many of the companies analysed are more than just trading
About half of the companies demonstrate a considerable companies. In the next chapters, many of them will appear
degree of diversification, which means that their product port- again when topics such as growth, consolidation processes, bar-
folio comprises several agricultural commodities. This applies gaining power, and human rights violations along the value
above all to the large trading companies of the ABCD club, chain come up.A Public Eye Report | June 2019 19
4
Consolidation in the
global agro-food system
Archer Daniels Midland's (ADM) ethanol and corn syrup production plant in Decator, Illinois, USA. | © Benjamin Lowy/Getty Images20 Joint venture with Wilmar
Agricultural Commodity Traders in Switzerland – Benefitting from Misery?
and Green Feed in Vietnam
(Bunge holds 45%), connec-
Acquisition of the ting Bunge's upstream
wheat milling crushing capabilities to
business of Grupo Wilmar's downstream oil
Altex, making Bunge refining and consumer
the leading Mexican products business and to
wheat miller Green Feed's feed milling and
4.1 – TRENDS AND CONSEQUENCES marketing
value. 34 Other activities
models of collaborations between powerful com-
Acquisition of Moinho
Pacifico wheat mill, panies include joint ventures, strategic alliances, and contractu-
A key feature
Joint of the structural
venture with transformation one of
of the
the largest in
agro-food al arrangements. Bunge’s intense consolidation activities over
system isLouis Dreyfus
the rapid expansion of Global Value SouthChains
America (GVCs). the past five Acquisition
years may serveof as illustration for the expansion
GenerallyCommodities
defined, GVCs andencompass all activities and processes a multi-crush and
strategy of agricultural commodity traders (see figure 4.2). The
Aceitera General oilseed refining
needed to turn raw materials into final products that are deliv- wide-ranging impacts of these consolidation processes often
Deheza; 33.3 %(see
share facility in the
ered to end consumers figure 4.1).Acquisition
The spread of of 61%
these activ- escape the scrutiny of regulators due to the narrow mandate of
each in CAIASA, 33
Netherlands and a Joint venture
ities and processes over several countries of the Canadian global.
makes them domestic competition
soybean and
authorities (see section 6.4 on the various
which operates a with Bahri Dry
The expansion of GVCs goes handWheat in handBoard
with market
to con- deficiencies ofrapeseed
national crush
competition policies).
soybean crushing Bulk, the
solidation. Such processes
plant and a terminal reach all stages
improve of GVCs,
the from input The consequences
facility in of
thethe unprecedented consolidation are
Port national
markets toto serve
retail markets
and are in geograpic
characterised by twobalance
trends. In the fewer but more powerful
of Brest firms. These trends have exacerbated
in France shipping arm
horizontal dimension, across with Bunge's
every individual stagegrain
of the GVCs existing power imbalances in agro-food
Asia, the Middle East of value
the chains, thereby
activitiesand
are increasingly
Northern Africaconcentrated footprint and of a few big
in the hands making “farmers ever more reliant on a handful ofof
suppliers and
Kingdom
greater market
companies, such as input providers, producers, traders, proces- buyers, further squeezing their incomesSaudi and eroding
Arabia their abili-
sors, and retailers (while their originalaccess to Canadian
functions are increasing- Acquisition
ty to choose what to grow,of how to grow it, and for whom”, ac-
growers
8 ly blurred). In the vertical dimension, i.e., across different stages cording to the remainig
experts at the International Panel of Experts on Food
of the value chain, multinational companies have gradually ex- 45% of Nutre
Systems (IPES-Food). 35 Moreover, the increasing dominance of
panded their activities and their influence beyond individual Farming B.V.,
big companies in the agro-food sector allowsAcquisition
these companies
of
stages, a process referred to as vertical integration. to expand which handlesinfluence to alter the rules that govern
their political 70% ownership
oilseed
GVCs in their favour. University of Chicagointerest economistin IOILuigi
6 Joint venture processing in
Zingales warns that “market concentration can Loders
easilyCroklaan,
lead to a
with Amaggi, the Eastern Europe
‘Medici Vicious Circle’ where money is used Expanding
to get political
The consequences of private
largest the power and political power is used to make money.” Bunge's36
producer
unprecedented consolidation of are value-added
soybeans in the Glencore’s successful lobbying serves as an illustration of
fewer but more powerful capabilities and a
4 world firms. the political influence on the regulatory framework.
becoming a
In 2010,
devastating drought destroyed much of the crop in Russia and
global leader in
elsewhere. To ensure grain supply for its population, the Rus-
B2B edible oils
sian government considered imposing a ban on grain exports.
The driving forces behind consolidation processes in GVCs Glencore was in favour of such a ban because it would have
2 are the prospects of efficiency gains achieved through synergies freed the grain trader from honouring the now loss-making
based on economies of scale and scope. Mergers and acquisi- futures contracts they had entered into. According to the New
tions (M&A) are the means of choice for agro-food companies in York Times, “pressure was (…) brought to bear by multinational
search of consolidating their power and influence over an ever- grain trading companies, which have been lobbying for the ban
0 increasing part of the GVCs. Over the last decade, M&As in the as a way to escape futures contracts drawn up before the
agro-food sector have increased both in terms of numbers and drought, when prices were far lower. A Russian subsidiary of
2013 2014 2015 2016 2017 2018
8 3 7 4 6 2
Figure 4.1 – Structure of a global value chain of agricultural commodities
Input
supply Trading Consumption
& shipping
Storage Retailing
Processing
Production & refining
Primary Distribution
processing & packagingA Public Eye Report | June 2019 21
Figure 4.2 – Growing big: Bunge’s acquisitions and joint ventures, 2013–2018
Acquisition of the
wheat milling
business of Grupo Joint venture with
Altex, making Bunge Wilmar and Green Feed
the leading Mexican in Vietnam (Bunge
wheat miller holds 45 %), connecting
Acquisition of Bunge’s upstream
Joint venture with Moinho Pacifico crushing capabilities to
Louis Dreyfus wheat mill, one of Wilmar’s downstream
Commodities and the largest in oil refining and
Aceitera General South America consumer products
business and to Green Acquisition
Deheza; 33.3 % share
Feed’s feed milling and of a multi-crush
each in CAIASA,
marketing activities and oilseed re-
which operates a Acquisition of 61 % fining facility in
soybean crushing of the Canadian the Netherlands
plant and a terminal Wheat Board to Acquisition of the remainig and a soybean
to serve markets in improve the 45 % of Nutre Farming B.V., and rapeseed
Asia, the Middle East geographic balance which handles oilseed crush facility in
and Northern Africa with Bunge’s grain processing in Eastern Europe the Port of Brest
footprint and in France
greater market
access to Canadian Joint venture with
growers Bahri Dry Bulk, the
national shipping
arm of the Kingdom
8 of Saudi Arabia Acquisition of
8 70 % ownership
Joint venture
with Amaggi, the 7 interest in IOI
Number of acquisitions and joint ventures
Loders Croklaan,
largest private
expanding
producer of 6 Bunge’s value-
6 soybeans in the
added capabili-
world
ties and be-
coming a global
leader in B2B
4 edible oils
4
3
2
2
0
2013 2014 2015 2016 2017 2018
= illustrative examples of Bunge’s acquisitions and joint ventures
Source: Company website and US SEC. 10-K Form of Bunge Limited (various issues).22 Agricultural Commodity Traders in Switzerland – Benefitting from Misery?
40
100 20
Glencore, the Swiss-based commodities trading company that ing and developing countries.39 Horizontal concentration is
has close ties to the Russian government, pressed hard as the equally well advanced for many agricultural commodities in the
%
80 scope of the drought’s devastation became clear.” The lobbying
37
0
midstream of agro-food GVCs, where agricultural commodities
was successful and shortly thereafter Russia imposed a ban on are turned into foodstuffs, fodder, energy sources, and industrial
Soybeans
Wheat
Palm oil
Sugar
Corn
Rice
Coffee
grain exports. products. In the meat processing industry, a handful of large
The following sections elaborate on the two dimensions of companies, mainly from the USA and Brazil, dominate.40 Anoth-
the consolidation process in the agro-food system: horizontal er illustrative example is cocoa processing, where just three
60 concentration and vertical integration. The developments are companies (Barry Callebaut, Cargill, Olam) hold a global market
illustrated by a wide range of examples, with a focus on Swiss- share of 65%. Similarly, in orange juice processing the combined
based traders. market share of Sucocitrico Cutrale, Citrosuco and Louis Drey-
fus Company is as high as 73% (see figure 4.3). It is worth noting
40 that all but one of these six firms operate from Switzerland.
4.2 – HORIZONTAL CONCENTRATION: The trading sector itself is no exception to these trends to-
THE GLOBAL VIEW wards greater concentration. Indeed, the major agricultural
commodity traders often operate in highly concentrated mar-
Concentration is taking place at all stages of agro-food GVCs, kets. For quite some time, the traditional trading houses of
20 although to differing degrees. This process is far from over as Archer Daniels Midland, Bunge, Cargill, and Louis Dreyfus
witnessed by the most recent, announced, and planned mergers Company have dominated the grain trade.41 More recently,
and acquisitions in the sector, which include a number of mega- predominantly Asian traders such as COFCO Int., Olam, and
mergers. In a recent report, IPES-Food analysed horizontal con- Wilmar have joined the ABCD companies. In this sector merg-
%
0 centration along agro-food GVCs and found a high degree of ers and acquisitions are driving the consolidation process as
concentration in several sub-sectors of the agricultural input well. The precise extent of concentration is difficult to assess as
Soybeans
Wheat
Palm oil
Sugar
Corn
Rice
Coffee
Cotton
Tobacco
Bananas
Cocoa
Tea
Orange juice
industry. In addition, powerful players have expanded over more trading companies are notoriously secretive. But as table 4.1
than one sub-sector, giving them additional power over small- shows, estimates from different authors point to a limited group
scale agricultural producers. With the recent mergers of Swiss- of firms who control large portions of the trade in individual
based Syngenta with ChemChina, Dow with DuPont, and Bayer commodities such as grains, coffee, tea or bananas.
with Monsanto, the market power of the four top firms over
vital input industries has reached troubling dimensions: they
now control well over half of both the global seed and pesticide 4.3 – SWISS-BASED TRADERS ON COURSE
market.38 FOR EXPANSION
At the other end of the value chain, food retailers appear to
be comparatively less concentrated. Nevertheless, the trend to- The global trend towards concentration can be clearly observed
wards consolidation is observed in this sector as well. The big- among Swiss agricultural traders. Agricultural commodity trad-
gest retail companies such as Walmart, Tesco and Costco, con- ers rarely appear in the news in Switzerland, but when they do
tinue to strive to consolidate their positions in key markets mergers and acquisitions make up the majority of the headlines.
while expanding their businesses into growth markets in emerg- In 2017, COFCO Int. acquired Dutch agricultural commodity
Figure 4.3 – Concentration in cocoa and orange juice processing
COCOA ORANGE JUICE
Others Barry Others Cutrale
35 % Callebaut 27 % 33 %
29 %
Cargill Louis Dreyfus
19 % Company
Olam 15 % Citrosuco
17 % 25 %
Source: Hardman Agribusiness, 2016 (cocoa); company websites and media reports (orange juice)You can also read