Agricultural Value Chains - Spotlighting Opportunities and Managing Risks - Babajide Sodipo, Senior Manager, Export Development Advisory - First ...
←
→
Page content transcription
If your browser does not render page correctly, please read the page content below
Agricultural Value
Chains – Spotlighting
Opportunities and
Managing Risks
Babajide Sodipo,
Senior Manager, Export Development
Advisory

 Document Classification: Unclassified
Introduction

•   I would like to convey the most sincere regrets from Professor Benedict Oramah,
    President and Chairman of the Board of the Africa- Export Import Bank (Afreximbank),
    for his inability to be here today due to unavoidable scheduling conflicts.

•   I want to convey his gratitude to the organisers for the kind invitation

•   I will be making this Presentation on his behalf.

2    4 September, 2019      Document Classification: Unclassified
In this Presentation, I shall:
1.   Introduce Afreximbank & provide highlights on its strategic thrust

2.   Review the nature of Agricultural Value Chains, highlighting the opportunities and
     risks, using practical examples (cotton and coffee)

3.   Present some of the Bank’s intervention in Agricultural value chains

4.   Conclude and Suggest a Way Forward

3                         Document Classification: Unclassified
1. Introducing Afreximbank

4   Document Classification: Unclassified
Corporate Profile
Who we are
A pan-African multilateral trade finance institution created in 1993 under the auspices of the African
Development Bank.

Vision
To be the trade finance bank for Africa.

Mission
To stimulate a consistent expansion and diversification of African trade, so as to rapidly increase
Africa’s share of global trade; and in doing so, to operate as a first-class, profit-oriented, socially
responsible financial institution and a “Centre of Excellence in African Trade Matters.”

Mandate
The mandate of the Bank is to finance and promote Intra-and Extra-African Trade using three broad
services:
− Credit (Trade & Project Financing)
− Risk Bearing (Guarantees & Credit Insurance)
− Trade Information & Advisory Services

5                               Document Classification: Unclassified
Shareholding structure
The Bank currently has four classes of                              Top 20 Shareholders
shareholders:                                                       #    Class Shareholder
                                                                    1     A    Central Bank of Egypt
— Class “A” Comprising of African governments,                      2     A    Central Bank of Nigeria
  the African Development Bank (AfDB) as well as                    3     A    Res. Bank of Zimbabwe
  African continental, regional and sub-regional                    4     B    National Bank of Egypt
  financial     institutions   and    economic                      5     A    Fed. Republic of Nigeria
                                                                    6     C    China Eximbank
  organisations.
                                                                    7     A    African Development Bk
— Class “B” Made up of African national financial                   8     A    Gov’t of Côte D'ivoire

  institutions and African private investors.                       9     B    Banque du Caire
                                                                    10    B    Banque Misr
— Class “C” Comprising of international financial                   11    A    Gov’t of Congo Bzv
  institutions, economic organizations, non-African                 12    A    Bqe Centrale De Tunisie

  financial institutions and non-African private                    13    C    Standard Chartered Bk
                                                                    14    A    Bank of Uganda
  sector firms.
                                                                    15    A    Republique du Cameroun
— Class “D” Open to subscription by any investor,                   16    B    Nigerian Ex-Im Bk

  African or non-African.                                           17    B    SBM (NBFC) Hds Ltd
                                                                    18    A    Government of Kenya
                                                                    19    A    Bank of Ghana
                                                                    20    A    Bc Nacional de Angola

6                           Document Classification: Unclassified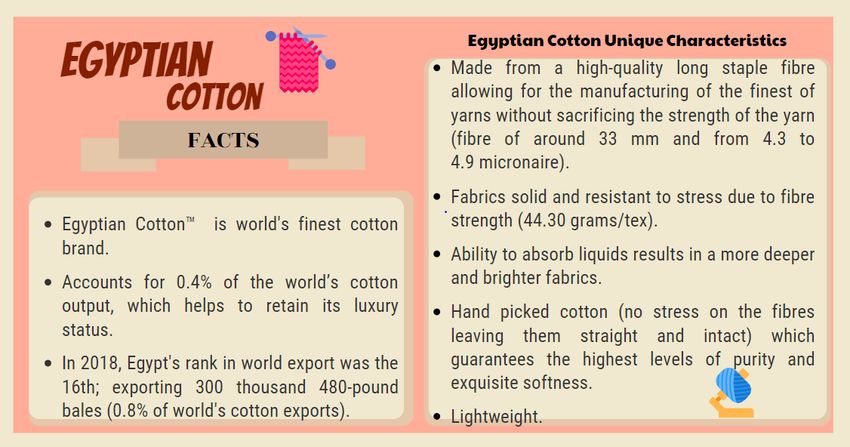
Key facts and figures
Financial snapshot (in USD m)                          Key strengths

                                                            Preferred creditor status

                                                            Investment grade by Moody’s (Baa1 / P-2) /
                                                            Fitch (BBB- / F3) / Global Credit Rating Co
                                                            (GCR) (BBB+ / A2)
                                                            Consistent Profitability Return on Average
                                                            Equity of 11.4%

                                                            Strong capital adequacy ratio of 23%, with
                                                            callable, subscribed capital of USD 568 million

7                   Document Classification: Unclassified
African Presence

— The Bank is headquartered in Cairo,
  Egypt and has three regional offices in
  Abuja, Nigeria; Harare, Zimbabwe and
  Abidjan, Côte d’Ivoire. A fourth regional
  office in East Africa is soon to open,
  with plans to follow this with a central
  African location.

— There are 51 participating member
  countries spread across the continent.

 8

                               Document Classification: Unclassified
Afreximbank’s Medium Term Strategy:
Impact 2021 Africa Transformed
3000
1.4% 10% 1.6% 1% ha
Increase Africa’s share Create 3,000 hectares of
Increase international
Finance 1.4% of Africa’s of global trade by Finance 1% of Africa’s industrial parks and special
finance flows into Africa
total trade annually financing 1.6% of total manufactured exports economic zones across all
by 10% annually
intra-African trade sub regions
Intra-African Trade Industrialization & Export Development Trade Finance Leadership
— Create: Facilitate capacity for expansion of — Catalyse: promote "soft" and "hard" — Strategic focus on financial and non-financial
production and processing capabilities infrastructure developments areas of intervention in the trade and trade
— Connect: Identify key institutions and agents — Produce: finance and support activities that finance market
to “connect the dots” in the intra-trade value improve efficiency and quality in production of — Expand existing trade finance products as well as
chain. goods and services introducing new innovative products and
— Deliver: Deliver efficient and cost effective — Trade: facilitate trading through financing and initiatives
distribution channels within the continent supporting to institutions that provide market — Fill the voids in trade services created by reduced
— Measure: monitoring and measurement access activities of international banks in Africa resulting
mechanisms from high compliance costs and economic
uncertainty
Catalyse
Create 1 2 Connect
Produce
Measure 4 3 Deliver
Trade
9 Document Classification: Unclassified2. Understanding Agricultural Value Chains –
Opportunities and Risks
10 Document Classification: UnclassifiedWhat are Agricultural Value Chains?
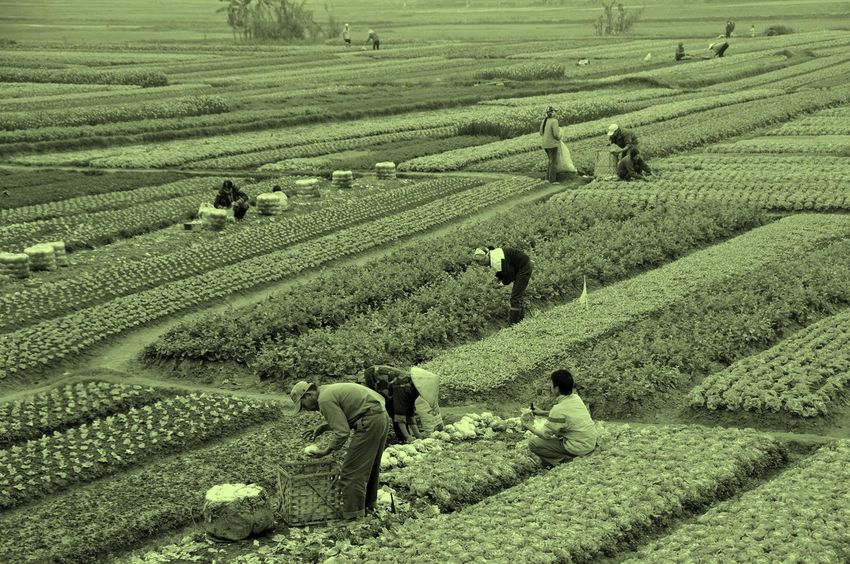
• A ‘value chain’ in agriculture identifies the set of actors and activities that bring a basic
agricultural product from production in the field to final consumption, where at each
stage value is added to the product.
• A value chain can be a vertical linking or a network between various independent
business organizations and can involve processing, packaging, storage, transport and
distribution.
• The terms “value chain” and “supply chain” are often used interchangeably.
• Modern value chains are characterized by vertical coordination, consolidation of the
supply base, agro-industrial processing and use of standards throughout the chain.
• Modern Agricultural Value Chains have become increasingly global in nature, with the
food we eat and the clothing we wear increasingly being delivered by global
production systems that cross many borders.
11 4 September, 2019 Document Classification: UnclassifiedAgricultural Value Chains Contd.
• Wheat produced in Australia and the Ukraine, for example, is processed into flour in
Indonesia and Turkey, and then exported to make noodles in China, and bread in Africa
and the Middle East.
• Participation in value chains is heavily influenced by the nature of products produced
• Products such as fresh vegetables more likely to go relatively directly from producer to
consumer through GVCs, compared to oilseeds, wheat and many fibres such as wool
and cotton, which feed into food and clothing manufacturing processes and which can
cross borders multiple times before reaching the end consumer.
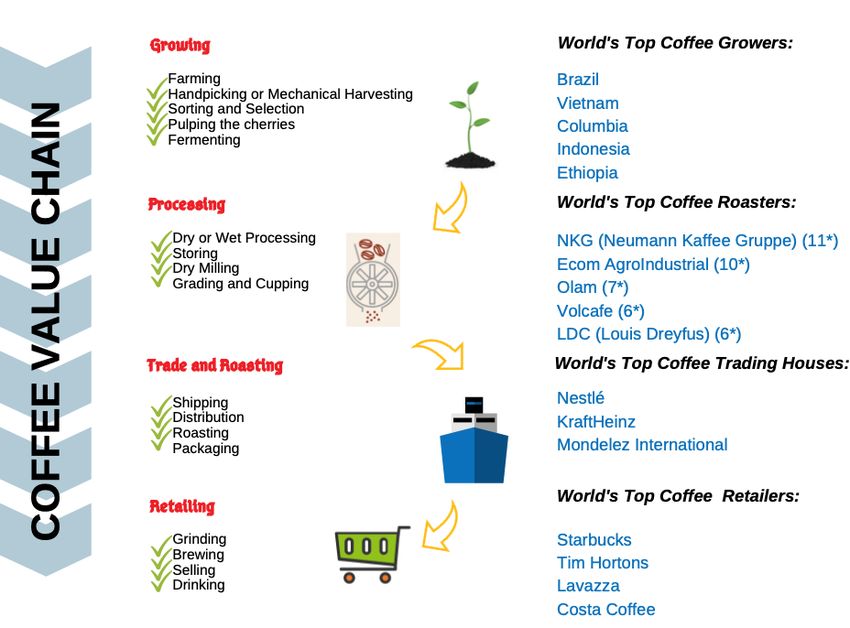
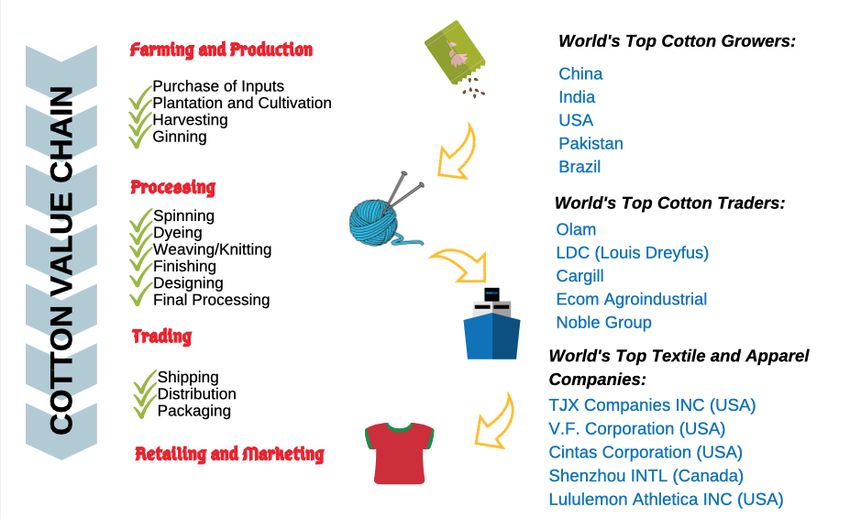
• Let us examine the Cotton and Coffee Value Chains as demonstrative examples
12 4 September, 2019 Document Classification: UnclassifiedGlobal Cotton Market
Cotton prices remain volatile although volatility has waned compared with the period between 2009 to 2011
Cotton Historical and Future Prices Cotton Historical Volatility (10 Days)
20
230
18
Price in USCents per Pound
210
PERCENTAGE (%)
16
190
14
170 Historical price
12
150 Forecast price
10
130
8
110
6
90
4
70
2
50
Cotton is a strategic commodity whose prices are driven by: US production, China’s import policies and dynamics in the global
economy. Over the past decade cotton prices have fluctuated as follows:
2009-2011: Cotton prices leapt to $2.15/lb in March 2011 due to surging demand for textiles following the global financial crisis.
At the same time, India, the world’s second-largest exporter, restricted shipments to help its domestic textiles industry.
2011-2012:. As cotton prices rose, production increased and inventories grew contributing to a collapse in the market. Also, the
drop in cotton prices was mainly driven by falling demand as price rationing in 2011 led some manufacturers to substitute cotton
with synthetic materials.
2012-2013: Saw a marginal increase in cotton prices on account of bullish demand in global markets.
2013-2015: China introduced an income support policy instead of a price support policy leading to a huge stock accumulation in
Chinese State Reserves. This resulted in lower import quotas alongside a decline in demand which led to a drop in cotton prices.
2016- 2019: While cotton demand remains fairly stable, cotton production has been affected by suboptimal weather conditions in
the US which have dried out some harvesting areas.
4 Source: Bloomberg, 2019 Document Classification: UnclassifiedGlobal Cotton Market
Asia is the largest grower of cotton globally while North America leads in the textile and clothing industry
Cotton Textiles Value Chain Average Value Captured at Each Stage of the
Cotton Value Chain per $15 Shirt
3 Sources: USDA, 2019 & Investment Zen, 2019 Document Classification: UnclassifiedGlobal Coffee Market
While Coffee prices have shown volatility owing to cyclical events of overproduction and poor
harvests, the last five years have seen a general lowering of prices
Arabica Coffee Prices
Arabica coffee prices have been following a negative trend
depreciating by 68.2% to hit its all time lowest value of $95.2
cents/lb in January 2019 from $299.35 cents/lb in April 2011.
Similarly, Robusta coffee prices declined by 45.2% to reach
$1,489/tonne in January 2019 from $2,718 per tonne in February
2008.
The key driving factors for this price volatility have been:
2008-2010 The crisis in the global financial markets affected
coffee prices, despite the fact that the commodity’s supply and
demand fundamentals remain unchanged.
2010-2011 Poor harvests of high-grade coffee beans and a growing
taste for gourmet coffee among burgeoning middle classes in
Robusta Coffee China, Brazil, Indonesia and India led to the sharp rise in coffee
Prices prices.
2011-2014 2011 prices encouraged growers to invest in and
expand production resulting in a surplus of production over
consumption.
2014-2015 This rally has been driven by a serious drought in
Brazil during the critical development months of January and
February.
2015-2016 The growing crop base, weakening Brazilian Real and
ongoing trade tensions between the U.S. and China contributed to
the price decline. Also, the decline in prices was driven by
Colombia’s increase in exports in the face of low global prices, to
protect local farmers’ earnings.
2016- 2017 The rally has been driven by the global market’s
supply deficit, along with firming currencies in top growing nations
Historical price and strong demand for coffee.
Source: Bloomberg, 2019 Forecast price 2017-2019 Prices are reflecting the surplus of coffee on the
Document Classification: Unclassified
3
international market.Global Coffee Market
South America is the largest grower of coffee globally while Europe leads in coffee roasting
and processing
Average Value Added in (%) through the
Coffee Value Chain
Average Value Captured at Each Stage of the
Coffee Value Chain for every $100
Value Capture in Each
Coffee Stages
Stage in $/kg
Growing 11
Trading 6
Processing and
52
Branding
Retailing 31
Total 100
* World Market Share in %
Source: UNCTAD, 2018 Source: The Coffee Exports Guide, 2010
Document Classification: Unclassified
22. Opportunities and Risks Facing Agricultural Value
Chains
17 Document Classification: UnclassifiedOpportunities and Risks Facing Agriculture
Value Chains
• I will use 4 case studies to demonstrate the types of opportunities
and risks facing agricultural value chains
• For demonstrating Opportunities I will use
- The Brazilian Coffee Experience
- The Case of Egyptian Cotton
• While to highlight some of the risks, I will use
- The Nigerian Textile and Fashion Industry
- The Burkina Faso Cotton story
18 4 September, 2019 Document Classification: UnclassifiedGlobal Coffee Market: Lessons Learned from Brazil “The coffee Nation”
Brazil has grown domestic consumption from broadened consumers’ base along with the adaption
of technological advancements in the processing phase
Document Classification: Unclassified
4African Cotton Market- Egyptian Case Study
The unique characters that sets Egyptian cotton apart from other natural fibers
11 Source: USDA Foreign Agricultural Service, 2019 &Document
Trademap,Classification:
2019 UnclassifiedAfrican Cotton Market- Nigeria Case Study
Nigerian textile and clothing Industry: A hidden goldmine overshadowed by the oil sector
Nigerian Textile and Clothing Exports Values Nigerian Textile and Clothing Exports Values
1200
1000
800
600
1001
400
200 419 482 Local Employment in Textile Industry
270 200 30 10 220 0 46
0
2018 1995
Area Harvested in Hectares Domestic Consumption in 1000 480 lb. Bales
Yield/Hectare in Pounds per Hectare Exports in Thousand 480-pound bales
Imports in Thousand 480-pound bales
Since the 1970’s, the oil sector dominated the Nigerian Textile and Clothing Industry Share of GDP
economy causing the textile and clothing industry to suffer
dramatically on the run. In 2018, cotton export volumes
increased by 100% and long import volumes dropped by 78%
reflecting the decline in domestic mill use which decreased by
58.6% since 1995. During the same period, cheaper fabrics
from China and India discouraged local cotton farmers leading
to the shut down of 97% of Textile mills along with employment Number of Local Operating Textile Mills
shrinking by 90%.
In fact, the lack of governmental incentives and technological
support resulted in a significant drop in crop collection
efficiency while area harvested expanded by 18.5%.
10 Source: PSD-USDA, 2019 & Trademap, 2019 Document Classification: UnclassifiedAfrican Cotton Market-Burkina Faso Case Study
A failed experience in genetically modified (GM) cotton in West Africa: The quality of the Burkina Faso cotton
remains the country’s primary competitive advantage on the global market
Burkina Faso Cotton Production (2000-2018) Area Harvested by Burkinabe Cotton Growers (2000-2018)
In 2000, top African cotton growers, Burkina Faso, fetched top prices because its high-quality fibre. In
2008, Burkina famers agreed to introduce Genetically Modified (GM) seeds, Monsanto Bollgard II, as pests
and bollworms were threatening the crop.
Following the introduction of the GM in 2008, Burkina Faso cotton production dropped by 24% (645
thousand 480 lb. bales) while area harvested remained approximately the same; at around 410 thousand
hectares. Since 2011, cotton production has recovered to reach 1310 thousand 480 lb. bales (slightly more
than double the output in 2010). This increase is not associated with the use of the GM seeds but rather
with a 47% expansion in harvested area.
In 2016, Burkina Faso abandoned Monsanto seeds, complaining that they resulted in a shorter cotton fibre
which resulted in a loss in competitive advantage and a financial loss of $85 mn for local cotton companies.
9 Source: PSD-USDA, 2019 & Trademap, 2019 Document Classification: UnclassifiedOpportunities and Risk
Opportunities
- Stimulating local demand for value added products can be transformative
- Consistent standards and quality in value added products can lead to growth locally
and internationally
- Responsibilities for both producers and governments
- The African Continental Free Trade Area can be a game changer
Threats/Risks
- An uncompetitive and poor business and investment climate
- Cost of doing business (Transport, Energy, regulatory barriers, multiple taxation,
access to finance etc
- Inconsistent policies can handicap businesses, regardless of the good intentions
- A global trading system that is becoming more complex and protectionist
- tr
-
23 4 September, 2019 Document Classification: UnclassifiedAfreximbank Initiatives to support Agricultural Value
Chains
24 Document Classification: UnclassifiedAFRICOIN In 2012, Afreximbank, launched the Africa Cocoa Initiative (AFRICOIN) to provide an End-to- End solution (upstream, midstream and downstream) to the African cocoa sector. Upstream - Support for productivity improvement: - USD 108 million financing of production and import of farms inputs, including fertilizers, insecticides, herbicides, etc.; and USD 25 million financing the establishment and or refurbishment of warehouses/ storage facilities. Midstream - Expansion of processing capacity: - The Bank has financed expansion of processing capacity through imports of new equipment and refurbishment of existing plants. - Côte d’Ivoire’s processing capacity has been increased by 120,000 tonnes with total financing to local grinders (e.g. CONDICAF, Choco Ivoire, and SUSCO) amounting to about US$100 million. This amongst has catapulted Cote d’Ivoire to become the world’s largest processor during the 2014/15 cocoa season, processing about 558,000 tonnes while the Netherland was in second place for the first time ever with processing of 503,000 tonnes. - The Bank also provided access to trade finance to Ivorian cocoa exporters/grinders directly or through local banks with financing amounting to over US$200 million. Downstream - Financing Consumption Promotion: - The Bank will work with its Partners to finance consumption promotion in origin countries and Asia. - Facilitating market access to African processing companies by fostering creation of JVs between selected companies in Côte d’Ivoire, Ghana and Nigeria with international trading companies, these entities have been able to export processed cocoa into international markets. 25 4 September, 2019 Document Classification: Unclassified
Selected Strategic Initiatives
Supporting the Emergence of Export Trading Companies (1/4)

▪ There are several kinds of intermediary firms
 providing a range of export services including
 Commission      Agents,     Export       Trading
 Companies,     Export   Agents,      Commodity
 Boards, Merchants, or Re-Marketers etc.

▪ The Bank has made the deliberate choice to               ▪ An      Export   Trading    Company      (ETC)    acts   as   an

 support the creation and expansion of ETCs                   independent company that provides support services for

 in Africa to assist in overcoming constraints                firms engaged       in    exports   including   supplying    raw

 faced by small producers and SMEs, by                        materials, warehousing, shipping, insuring and billing on

 integrating them into regional, continental                  behalf of the client.

 and global value chains using Intermediaries/             ▪ ETCs also help suppliers find overseas buyers and
 Aggregators.                                                 provide them with raw material to ensure seamless
                                                              production as well as other pertinent market information.
   26                              Document Classification: Unclassified
Selected Strategic Initiatives
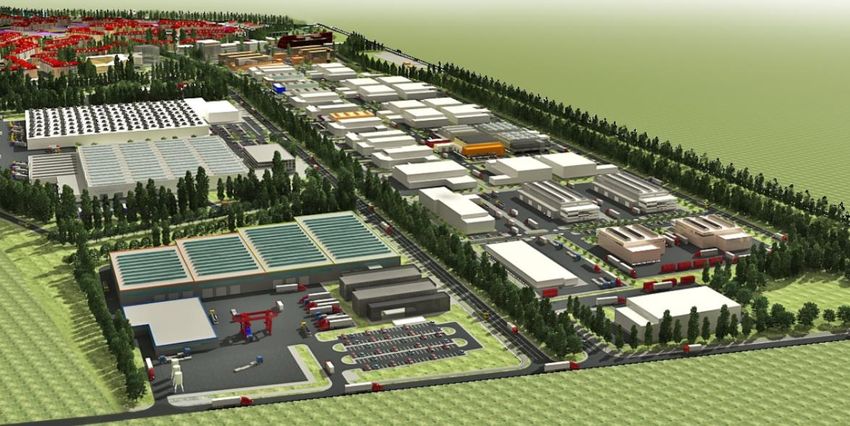
Supporting Industrial and Agro-processing Parks (2/4)
▪ In order to support and facilitate the
industrialization of the continent, the Bank has
designed and is implementing various
interventions under its Industrial and Agro-
Processing Parks Initiative, which is aimed at
providing technical and financial solutions for
the development of Industrial and Agro-
Processing parks in member countries.
▪ Focus for this initiative is Agro-processing
(cocoa, coffee, rubber, fruits and vegetables,
etc.) and Light manufacturing (garments, The initiative will focus on agro-processing and light manufactures
apparels, leather, shoes, plastic products, wood with the aim of assisting African countries to capture jobs that are
processing and wood products, simple metal de-localizing from economies currently undergoing a transition
products, etc.). from labour-intensive to technologically driven industrialisation.
27 Document Classification: UnclassifiedSelected Strategic Initiatives
Supporting Development of Inspection and Certification Centers (3/4)
▪ The Bank is supporting the establishment of cost
effective and easily accessible internationally
accredited Inspection and Certification Centres in
member countries, in order to improve market access
and increase exports of African agricultural and agro-
processed products as well as light manufactures to
other African and international markets, where there
are stringent technical, sanitary and other
requirements.
▪ The Bank will bring together financial and non-
▪ This initiative will support efforts at improving Africa’s financial stakeholders with the appropriate
conformity assessment infrastructure to support capacity and expertise to support the planning,
industrialization and export development strategies development and management of the inspection
of the Bank’s Member countries and certification centers.
28 Document Classification: UnclassifiedConclusion
• In this presentation, I have used the cotton and coffee value chains to
explain agricultural value chains, as well as demonstrate some of the
opportunities and risks that they face.
• I have highlighted case studies as examples of interventions that
have gone right, as well as situations that have proven more
challenging, with regards to taking advantage of opportunities and
mitigating risks associated with value chains
• I have also highlighted a number of Afreximbank initiatives that are
directly designed to address some of the opportunities and risks
facing agricultural value chains
• I will conclude with a number of recommendations and actions that
can be taken in the Nigerian context
29 4 September, 2019 Document Classification: UnclassifiedConclusions
- Agrobusinesses and Governments must look to both stimulate local demand as
well as take advantage of regional and global markets
- Nigeria should look to the Brazil example, and replace coffee with cocoa in the
school feeding program
- There should be a more concerted effort towards developing and enforcing
quality standards, as well as promoting Nigerian brands and packaging towards
maximizing the value added segments of the market
- Efforts must continue to be made towards improving the investment and
business climate
- Trade policy should be more targeted, and linked with export promotion; trade
negotiations with partners should target tariff escalations, as well as Non Tariff
Barriers encountered by Nigerian products
- Financial institutions should explore innovative financing tools to support the
agriculture value chains, including factoring, supply chain financing etc
30 4 September, 2019 Document Classification: UnclassifiedThank You for Your
Attention
Document Classification: UnclassifiedYou can also read