WORKING PAPER 64 - AidData
←
→
Page content transcription
If your browser does not render page correctly, please read the page content below

AIDDATA
              A Research Lab at William & Mary

WORKING PAPER 64
September 2018

Connective Financing: Chinese Infrastructure
Projects and the Diffusion of Economic Activity in
Developing Countries

Richard Bluhm
Institute of Macroeconomics, Leibniz University Hannover

Axel Dreher
Alfred-Weber-Institute for Economics, Heidelberg University
CEPR
CESifo
Georg-August University Goettingen
KOF Swiss Economic Institute

Andreas Fuchs
Helmut Schmidt University Hamburg
Kiel Institute for the World Economy (IfW)

Bradley Parks
AidData, The College of William and Mary

Austin Strange
Department of Government, Harvard University

Michael Tierney
Department of Government, The College of William and Mary
Abstract
How do development projects influence the geographic distribution of economic activity within low-
income and middle-income countries? Existing research focuses on the effects of Western development
projects on inter-personal inequality and inequality across different subnational regions. However, China
has recently become a major financier of economic infrastructure in Africa, Asia, Latin America, the
Middle East, and Central and Eastern Europe, and it is unclear if these investments diffuse or
concentrate economic activity. We introduce an original dataset of geo-located Chinese Government-
financed projects in 138 countries between 2000 and 2014, and analyze the effects of these projects on
the spatial distribution of economic activity within host countries. We find that Chinese development
projects in general, and Chinese transportation projects in particular, reduce economic inequality within
and between subnational localities. Our results suggest that Chinese investments in “connective
infrastructure” produce positive economic spillovers that lead to a more equal distribution of economic
activity in the localities where they are implemented.

Keywords: foreign aid, inequality, China, Official Development Assistance, georeferenced data, spatial
analysis, GINI, aid effectiveness

JEL classifications: F35, P33, R11, R12

Author Information

Richard Bluhm                                           Bradley Parks
Institute of Macroeconomics, Leibniz University         AidData,
Hannover                                                The College of William and Mary
bluhm@mak.uni-hannover.de                               bparks@aiddata.wm.edu

Axel Dreher                                             Austin Strange
Alfred-Weber-Institute for Economics,                   Department of Government, Harvard University
Heidelberg University                                   strange@g.harvard.edu
KOF Swiss Economic Institute
CEPR                                                    Michael Tierney
Georg-August University Goettingen                      Department of Government,
CESifo                                                  The College of William and Mary
mail@axel-dreher.de                                     email: mjtier@wm.edu

Andreas Fuchs
Helmut Schmidt University Hamburg
Kiel Institute for the World Economy (IfW)
mail@andreas-fuchs.net

                                                   1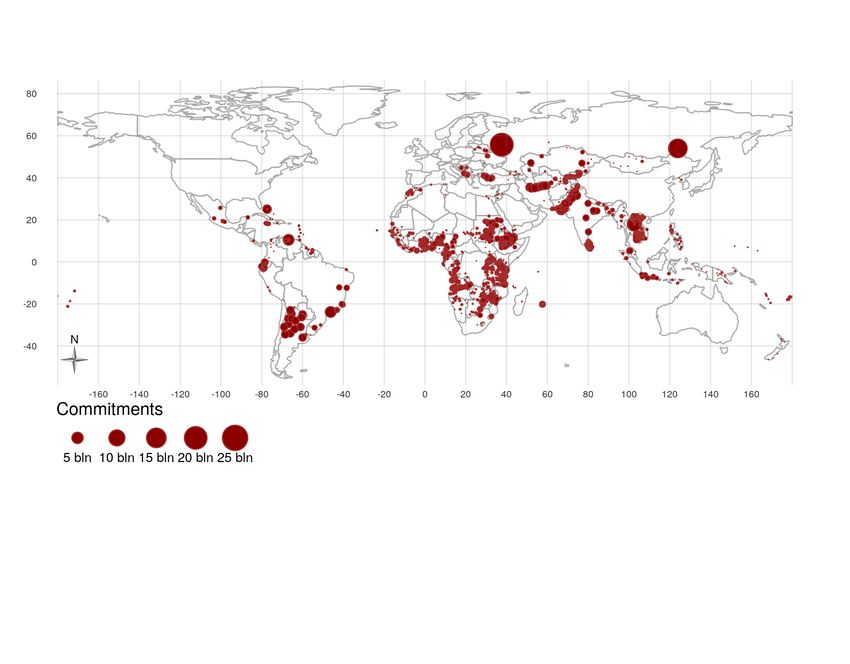
Acknowledgements

We owe a debt of gratitude to the large team of research assistants—including Daniel Lantz, Lauren
Su, Zach Baxter, Xiao Liu, Emily Qiu, Hanyang Xu, Kamran Rahman, David Rice, Joana Zhu, Catherine
Crowley, Melanie Gilbert, Graeme Cranston-Cuebas, Jiaorui Jiang, Junrong Zhu, Ze Fu, Tiffanie
Choi,Rebecca Thorpe, Yaseen Lofti, Weiwei Du, Mengfan Cheng, Echo Zhong, Faith Savaiano, Torey
Jackson, Darice Xue, Jack Nicol, Natalie Santos, Melanie Aguilar-Rojas, Katherine Walsh, Alexandra
Pancake, Karthik Kumarappan, Elizabeth Herrity, Erya Yang, Adriane Lopez, Liliana Besosa. Jade Li,
Ciera Killen, Antonio Tianze Ye, Isabella Kron, Lidia Kovacevic, (Jiacheng) Jason Xi, Miranda Clarke,
Sarah Reso, Emily Walker, Tina Chang, Ian Kirkwood, Yuning Chen, Thompson Hangen, Alex
Chadwick, Emma Cahoon, Caleb Ebert, Dominic Scerbo, Leigh Seitz, Joanna Tan, Aili Espigh, Yale
Waller, Allison Bowers, Weijue Huang, Daniel Hughes, Ashton Ebert, Flynn Madden, Keith Holleran,
Qiuyan Ni, Kate Connors, Collin Henson, Ariel Cadby-Spicer, Jasmine Herndon, Sarah Martin, Jack
Zhang, Caroline Lebegue, Kaitlan Shaub, Jessica Usjanauskas, Sophia Perrotti, Ava Chafin, Marie
Mullins, Emily Koerner, Ellie Bentley, Emmaleah Jones, Xinyi Wang, Carol Peng, Liz Hall, Amar
Kakirde, Bree Cattelino, Claire Etheridge, Mirian Kreykes, Alex DeGala, Hannah Dempsey, Dylan
Kolhoff, Grace Perkins, Yue Zhang, Rohan Desai, Will Nelson, Ryan Septon, Elizabeth Saccoccia,
Rachel Benavides, Dominic Sanzotta, Michael Hathaway, Warren Kirkwood, Connor Kennedy, Laura
Preszler, Andrea Soleta, Sara Gomez, Tom Westover, Ann Rogers, Nate Tanner, Rebecca Schectman,
Matt Westover, Sara Rock, Jordan Fox, Emily Tanner, Rachel Kellogg, Austin Trotta, Isabel Docampo,
Lu Sevier, Joseph Dobbels, Julia Varoutsos, Steven Livingston, Victor Polanco, Emily McLenigan, Bilal
Asad, Qi Jiang, Anna Umstead, Lauren Harrison, James Willard, Robert Francis, Justin DeShazor,
McKay Corbett, Brittany Tennant, Dominick Margiotta, Daniel Overbeck, Alfred Ouyang, Aaron
Groves, Samuel Patecell, Madison Free, Callie Robinson, Siyu Luo, Will Ryu, Ryan Muro, Claire Kartoz,
Juliana Mitchell, Sam Wooley, Grace Grimsley, and Ifechi Ugwu—who helped to assemble and geo-
locate the dataset of Chinese development projects used in this study. We also thank Seth Goodman,
Miranda Lv, and Renee Rotberg for their spatial data quality assurance integration assistance as well
as Gerda Asmus for preparing the project data at the regional level. This study was made possible
with generous financial support from John D. and Catherine T. MacArthur Foundation, Humanity
United, the William and Flora Hewlett Foundation, the Academic Research Fund of Singapore’s
Ministry of Education, the United Nations University World Institute for Development Economics
Research (UNU-WIDER), the German Research Foundation (DFG), and the College of William and
Mary. We also acknowledge that this study was indirectly made possible through a cooperative
agreement (AID-OAA-A-12-00096) between USAID’s Global Development Lab and AidData at the
College of William and Mary under the Higher Education Solutions Network (HESN) Program, as it
supported the creation of a spatial data repository and extraction tool which we used to execute our
data analysis. The views expressed here do not necessarily reflect the views of the John D. and
Catherine T. MacArthur Foundation, Humanity United, the William and Flora Hewlett Foundation,
Singapore’s Ministry of Education, the United Nations University World Institute for Development
Economics Research (UNU-WIDER), the German Research Foundation, the College of William and
Mary, USAID, or the United States Government.

                                                  2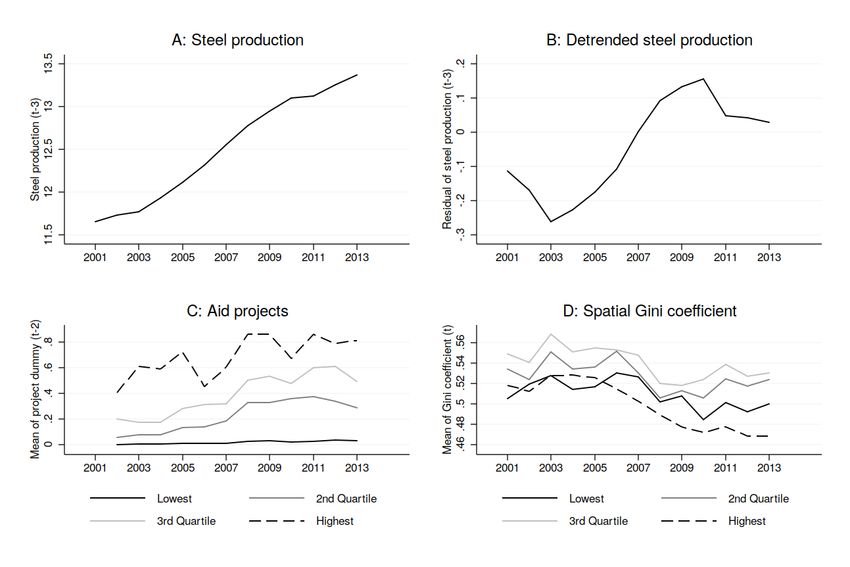
1. Introduction
In the early 1960s, the Government of Tanzania approached foreign donors and lenders with a
proposal to finance an ambitious project: an 1860-kilometer railway connecting copper mines in
landlocked Zambia to the port of Dar es Salaam. Two feasibility studies commissioned by the
World Bank and the United Nations questioned the technical feasibility and economic viability of
the proposal (Monson 2009: 15). Shortly thereafter, the United Kingdom, the United States,
Japan, Canada, France, West Germany, and the Soviet Union signaled that they would not
finance the project (Harden 1987; Song 2015). China, however, agreed to bankroll the US$415
million project—worth approximately US$3 billion in current dollars—in 1967. At the time, the
TAZARA railway represented China’s single largest foreign aid project.1 The project was an
extraordinary engineering challenge. It required blasting through or moving 89 million cubic
meters of earth, and constructing 320 bridges, 2,225 culverts, and 22 tunnels (Harden 1987).
Yet it was completed less than three years after construction activities commenced.2

The newly established corridor had far-reaching and long-lasting effects on the spatial
distribution of economic activity in Tanzania. Monson (2009: 8) notes that “[u]pon its completion,
the TAZARA railway formed the backbone of a new spatial orientation for agrarian production
and rural commerce.” It promoted a large-scale resettlement of rural villages alongside the rail
line, attracted migrants in search of wage labor opportunities to these villages, increased
agricultural intensification near the settlements along the railway corridor, and strengthened ties
between rural and urban markets. Song (2015: 59) elaborates on this point, writing that “[t]he
operation of the [TAZARA] railway facilitated the flourishing development of an agricultural
economy along its route, and local areas changed dramatically after its completion. Wastelands
and jungles were transformed into farms of rice, corn, and bananas. The railway also promoted
the circulation of commodities. Besides effectively solving the problems confronting the export of
copper, the TAZARA railway […] revitalized domestic trade by speeding up the transportation of
light industrial products between different localities and made travel much easier than before for

1
  For ease of exposition, we will use the term “aid” in this paper to refer broadly to any types of official finance from a
donor (or lender) to a recipient (or borrower). In cases when we wish to reference the narrower (OECD-DAC)
definition of aid, we use the term Official Development Assistance (ODA). In cases when we wish to reference
concessional and non-concessional official financing that does not qualify as ODA, we use the term Other Official
Flows (OOF). Finally, when we wish to reference the sum of ODA and OOF, we use the term Official Finance (OF).
2
  The project was initiated in October 1970, and an estimated 30,000-40,000 Chinese workers traveled to the country
by boat to co-labor alongside tens of thousands of Tanzanian workers. Monson (2009: 52) writes that “[s]trenuous
working conditions were made more difficult by the determination of the Chinese authorities to finish the project well
ahead of schedule. The Chinese management was willing to push the workforce night and day to show what could be
achieved—and to build African confidence—at a time when the world was watching.” By the end of 1973, just 27
months after construction began, the railroad was nearly complete on the Tanzanian side of the border.

                                                            3
the local people.” According to Monson (2009: 122), “economic development in the TAZARA
corridor […] radiated outwards into the surrounding regions.”
Mao-era construction of the TAZARA railway foreshadowed Beijing’s rise as a major
international financier of transportation infrastructure. 3 Since 2000, China has assumed an
increasingly dominant role in the construction and rehabilitation of transportation infrastructure
around the globe.4 In Sub-Saharan Africa, it has funded a US$320 million ring road around
Ethiopia’s capital, Addis Ababa; a US$3 billion railroad that runs from Addis Ababa to Djibouti’s
seaside port of Doraleh; a US$4 billion railroad that connects Kenya’s capital with the port city of
Mombasa; a US$600 million road that connects Gabon’s leading seaport (Port-Gentil) with its
capital, Libreville; and a US$500 million road in Cameroon that connects the port city of Douala
with the capital, Yaoundé. In Asia, China’s government has funded a US$7 billion high-speed
railway from Laos’ capital city, Vientiane, to the capital of China’s Yunnan Province (Kunming)
and a US$2 billion highway from Karachi to Lahore in Pakistan, while pouring billions of dollars
into the construction and rehabilitation of roads in Cambodia, Sri Lanka, and Indonesia. In Latin
America, it has provided US$2 billion in support of the rehabilitation of a 1500 km railway in
Argentina, US$350 million for suburban mass transit extensions in Venezuela, and hundreds of
millions of dollars for highways and bridges in Jamaica, Suriname, Ecuador, and Bolivia. In the
Middle East and North Africa, it has invested US$2 billion in the electrification of a 926 km
railway from Mashhad to Tehran and US$250 million in Morocco’s Berchid-Beni Mellal
highway.5
Notwithstanding criticism that it finances politically motivated and economically unsustainable
projects, the Chinese Government has recently doubled down on its leadership role in the global
infrastructure finance market. In his keynote address at the 2017 Belt and Road Forum for
International Cooperation, President Xi Jinping emphasized that “[i]nfrastructure connectivity is
the foundation of development through cooperation. We should promote land, maritime, air and
3
It also provided an early indication of Beijing’s unique interest, possibly rooted in its own development experience, in
building transportation networks that connect inland or otherwise isolated areas with coastal regions and ports
(Bonfatti and Poelhekke 2017).
4
In 1999, China adopted a “Going Out” strategy, which called upon government institutions to more aggressively
encourage Chinese firms to invest and do business in overseas markets. The implementation of this strategy has
fundamentally altered the scale and scope of China’s state-sponsored financial transfers to other countries (Djankov
2016; Dreher et al. 2017). Foreign direct investment, development finance, and export finance from China have
soared since 2000 (Dong and Fan 2017; Morgan and Zheng 2017).
5
In the dataset that we introduce in Section 3, we identify 342 Chinese Government-financed transportation projects
that were underway at 1331 locations in 86 countries around the globe over the 2000-2014 period. The total financial
value of these projects amounts to US$ 69.5 billion. 61% of these projects were fully complete by 2014.
4cyberspace connectivity, concentrate our efforts on key passageways, cities and projects and
connect networks of highways, railways and sea ports ...” (Xi 2017).
The short- and long-run consequences of China’s infrastructure financing activities—including
the US$1 trillion Belt and Road Initiative—are sources of growing speculation and debate (e.g.,
Perlez and Huang 2017). Western politicians and public intellectuals claim that China prioritizes
speed over quality and often funds “white elephant” projects. However, many developing
countries have unmet infrastructure financing needs, and the leaders of these countries are
quick to point out that China is willing and able to finance roads, bridges, railways, and ports at
a time when Western donors and lenders are not (Dollar 2018).6
Existing studies have evaluated the effects that Chinese development projects have on
economic development, literacy, environmental degradation, trade union participation, and
corruption (BenYishay 2016; Dreher et al. 2016, 2017; Brazys et al. 2017; Isaksson and
Kotsadam 2018a, 2018b; Martorano et al. 2018). However, a key question that remains
unanswered is whether and to what extent Chinese development projects widen or narrow
inequalities within low-income and middle-income countries.7 Inequality is one of the defining
issues of our time. Left unattended, it can limit inter-generational mobility, increase political
polarization, undermine social cohesion, erode trust in public institutions, and elevate the risk of
violent unrest (Dreier et al. 2004; Østby et al. 2009; Khwaja 2009; Alesina et al. 2004, 2016;
Cederman et al. 2013; Chetty et al. 2014; Chetty and Hendren 2018a, 2018b; Ahlerup et al.
2016, 2017).
Many international development organizations claim that they are tackling this problem. The
World Bank, for example, has redefined its mission “as ending extreme poverty by 2030 and
boosting prosperity among the poorest 40 percent in low- and middle-income countries.”8 Aid
agencies and development banks also claim that they are making special efforts to address
economic disparities that exist within and across subnational localities (van de Walle and Mu.
6
An important reason for these infrastructure financing gaps follows from the fact that “Western donors have by and
large gotten out of hard infrastructure sectors …and [t]hey [instead] channel their assistance overwhelmingly to social
sectors or to infrastructure sectors such as water supply and sanitation that have direct effects on household health”
(Dollar 2008). Indeed, Western aid agencies and multilateral development banks have become significantly more risk
averse about bankrolling large-scale infrastructure projects because of the environmental, social, and financial risks
that they pose (Nielson and Tierney 2003; Hicks et al. 2008; Buntaine 2016).
7
By contrast, a growing “China shock” literature explores analogous distributional questions in the context of Chinese
economic engagement in the United States and other developed economies (Autor et al. 2016).
8
The U.N. Sustainable Development Goals also identify targets for the growth rate of the bottom 40% of the
population and for the social, economic and political inclusion of ethnicities and different social groups under the
broad goal of “reducing inequalities.”
52007; Chen et al. 2009; Wagstaff 2011). 9 But existing empirical research demonstrates a
yawning gap between donor rhetoric and action in this regard. By various measures and
methods, economists and political scientists have found that international development
organizations do a poor job of targeting economically disadvantaged regions within countries
(Öhler and Nunnenkamp 2014; Öhler et al. 2017).10 In fact, a growing number of studies find
that international development organizations actually site their projects in wealthier areas within
countries (Zhang 2004; Nunnenkamp et al. 2016; Briggs 2017, 2018, forthcoming).11
However, China is a unique source of development finance that merits special attention given its
revealed preference for funding “connective infrastructure” at home and abroad. Economic
theory suggests that these types of investments can increase the mobility of people, goods and
capital, which begs the broader question of whether Chinese Government-financed connective
infrastructure might help developing countries escape inefficient spatial equilibria—that is,
transition away from the status quo of excessive concentration of economic activity in a small
number of cities or regions.
To analyze this question, we introduce an original dataset of geo-located Chinese Government-
financed projects situated in 138 countries between 2000 and 2014, and examine the effects of
these projects on the spatial distribution of economic activity in host countries. We estimate the
overall and sector-specific effects of these projects on spatial inequality within and across
subnational jurisdictions, which we measure using the dispersion in nighttime light intensity (as
in Henderson et al. 2018). We conduct this analysis at the second-order administrative region
(ADM2) level, first-order administrative region (ADM1) level, and country level (ADM0).12 We
also briefly compare the distributional effects of development projects financed by China to
those of the World Bank, a financier of large-scale infrastructure projects that is—at least
9
Spatial inequality is an important component of overall inequality (Elbers et al. 2005; Yemtsov 2005); household
inequality and spatial inequalities within and between regions often move in the same direction (Kim 2008; Lessmann
and Seidel 2017). An unequal distribution of economic activity is not necessarily harmful. It may simply reflect the
comparative advantages of particular regions. However, in many developing countries, it is the result of excessive
concentration of economic activity in primate cities and rural neglect (Ades and Glaeser 1995; Sahn and Stifel 2003).
Also, when spatial inequality coincides with ethnic or other social cleavages, it can fuel violent conflict (Kanbur and
Venables 2005; World Bank 2009; Kuhn and Weidmann 2015; Alesina et al. 2016; Ezcurra and Andrés Rodríguez-
Pose 2017). Cases in point are Kenya’s 2008-election violence or the downfall of the Shah’s regime in Iran.
10
Cross-country research on the impact of aid on inequality is mixed and largely inconclusive (Chong et al.
2009; Bjørnskov 2010; Herzer and Nunnenkamp 2012; Tezanos et al. 2013).
11
One reason why this may be the case is that the poorer regions within countries are often rural and remote and it
tends to be costlier and challenging to deliver aid to such places (Custer et al. 2017). There may also be political
reasons why wealthier regions get more aid (Dreher et al. 2016).
12
Typically, ADM1 regions are provinces, states, or governorates, while ADM2 regions are counties, districts, or
municipalities. For example, Sri Lanka is divided into 9 provinces (ADM1s) and 25 districts (ADM2s).
6rhetorically—committed to the idea that the benefits of economic growth ought to be shared
broadly across society.
To estimate the causal effect of Chinese Government-financed projects on spatial inequality, we
use the instrumental variable (IV) developed in Dreher et al. (2016), who study the effects of
Chinese aid on subnational development in Africa. Our instrument uses an exogenous supply
push variable interacted with a local exposure term: China’s domestic production of potential aid
inputs interacted with each recipient region’s probability of receiving aid. We use China’s annual
production of steel (in thousand tons) to proxy for its capacity to produce physical aid inputs.
The intuition behind this approach is that the Chinese government has long considered steel a
strategic commodity and therefore maintains excess production capacity. This policy results in a
steel surplus, some of which supplies aid projects in developing countries. As a result, aid inputs
are higher about a year after production volumes were high and China’s subsequent provision
of foreign aid is also higher (see Dreher et al. 2016, 2017, for a detailed description). We proxy
for local exposure by the share of years within our study period in which a particular subnational
region received Chinese aid. Regions that frequently receive Chinese-financed projects are
more severely affected by year-to-year fluctuations in the supply of Chinese aid—and thus
overproduction in steel in the prior year—than those regions that infrequently host Chinese-
financed projects. This approach is similar to the identification strategies used in the “China
shock” literature, which analyzes the effects of Chinese import competition on US labor markets
(e.g., Autor et al. 2016) and can be interpreted as a difference-in-difference estimate. We
essentially compare the effects of Chinese aid projects on spatial inequality induced by annual
variations in steel production in China between regions with a high probability of receiving
Chinese aid to those regions with a low level of exposure to Chinese-financed projects. Our
local average treatment effect (LATE) is therefore primarily driven by big infrastructure projects
requiring large amounts of steel and other physical inputs.
Our results strongly suggest that Chinese-financed connective infrastructure reduces spatial
inequalities and accelerates the diffusion of economic activity across geographic space. This
finding is robust to a variety of sensitivity checks and perturbations. The results are strongest for
transportation infrastructure projects financed by China, but also hold for Chinese-financed
development projects more generally. The estimated causal effects using the instrumental
variable regressions are larger than the OLS estimates but both consistently point towards a
negative effect of Chinese-financed projects on spatial inequality. Remarkably, this pattern
holds at all levels of regional aggregation, although the individual significances and effect sizes
7vary. We also test whether Chinese transportation infrastructure projects are more effective in
reducing regional inequality when they are undertaken alongside projects in complementary
sectors, such as health or education, but fail to find robust evidence in favor of co-location
benefits. Moreover, we cannot confirm that World Bank-financed projects also affect the spatial
distribution of economic activity in any systematic manner (but also have to use a different
instrument in this setting).
The remainder of the paper proceeds as follows. In the next section, we develop theoretical
arguments and put forth a testable hypothesis about how aid affects economic inequality within
communities. Section 3 introduces our new subnational dataset of georeferenced Chinese
government-financed projects in 138 countries, and discusses the measurement of spatial
inequality at the subnational level. Section 4 describes our identification strategy. Section 5
presents and discusses our main results, including a battery of robustness checks and
generalizations. Section 6 concludes with a discussion of potential avenues for future research.
2. Theory
2.1 State of the Existing Literature on Aid and Spatial Inequality
Previous research strongly suggests that the way in which aid is distributed across subnational
units worsens regional disparities. Hodler and Raschky (2014), for example, provide evidence
that autocratic leaders are more likely than democratic leaders to funnel resources to their home
regions, thereby widening spatial inequalities, particularly in countries that receive large
amounts of aid. This finding may reflect the logic of political survival; that is, when the
“selectorate” is sufficiently small, the leader may have an incentive to provide private goods to a
small group of individuals rather than public goods that benefit a larger proportion of the
population (Bueno de Mesquita et al. 2003). Dreher et al. (2016) suggest that those donors that
grant high levels of discretion over project site selection to aid-receiving governments are more
vulnerable to this type of domestic political manipulation. Other studies suggest that aid projects
may promote a greater skew in the geographic distribution of economic activity if they are
subject to high levels of elite capture and corruption (Lessmann and Seidel 2017).
However, the existing literature has not seriously considered the possibility that development
projects in different sectors may have heterogeneous effects on the spatial concentration or
diffusion of economic activity. Consider projects that finance the construction or rehabilitation of
“connective infrastructure.” Roads, bridges, railways, and ports increase the mobility of labor,
goods, and capital, and theory suggests several reasons why these types of transportation
8infrastructure investments might disperse rather than concentrate economic activity across
geographic space (Henderson 2002; Kanbur and Venables 2005; Baum-Snow 2007; Kim
2008).13
Nor has the existing literature seriously engaged with the possibility that the heterogeneous
goals and practices of different donors may have distributional implications. China and
traditional donors vary along several dimensions that are potentially consequential: the speed
with which they implement projects, the level of priority that they assign to different types of
connective infrastructure projects, and the degree to which they seek to establish “growth poles”
through the co-location of projects in multiple sectors.
Therefore, in the next section of this paper, we briefly consider why transportation infrastructure
projects in general, and Chinese Government-financed transportation infrastructure projects in
particular, might reduce economic inequalities in the subnational localities where they are
implemented.
2.2 Connective Infrastructure and Spatial Inequality
New economic geography (NEG) theory suggests that investments in connective infrastructure
set in motion “centripetal” forces that concentrate economic activity and “centrifugal” forces that
disperse economic activity (Krugman 1996). Transportation infrastructure investments reduce
the costs of trade and migration, making it easier for firms to reach more distant markets and
individuals to commute or relocate to places of work that are further afield. Indeed, previous
research demonstrates that connective infrastructure can spread economic activity to rural,
remote and economically disadvantaged areas by nurturing the development of local markets
(Mu and Van de Walle 2012), increasing access to larger (urban) markets where (rural) firms
can sell their goods and services (Michaels 2008; Donaldson and Hornbeck 2016), reducing
inter-regional price differences and price volatility (Cirera and Arndt 2008; Le Cotty et al. 2017;
Donaldson 2018), promoting the entry of new firms (Shiferaw et al. 2015; Ghani et al. 2016),
lowering the cost of inputs and consumer goods (Bayes 2007; Parada 2016), increasing land
values and agricultural production (Khandker et al. 2009; Donaldson and Hornbeck 2016),14
13
Also, transportation infrastructure is often highlighted as one of the key policy levers that governments can use to
influence the spatial distribution of economic activity in both classical and New Economic Geography theory (Kim
2008).
14
Jacoby (2000) shows that reductions in transportation costs increase the market value of land in previously
disconnected, poorer areas.
9facilitating knowledge and technology spillovers (Khanna 2016), and enabling commuters to
travel longer distances to places of employment (Baum-Snow 2007).15
On the other hand, there are increasing returns to scale when economic activity is concentrated
in a particular location (Lichtenberg 1960; Henderson 1986; Murphy et al. 1989; Krugman
1991a), so when leading areas are better connected to lagging areas, it is possible that labor
and capital will move from the latter to the former and pattern of circular and cumulative
causation will ensue.16 If firms can achieve lower unit costs and higher profits in large markets,
they will likely relocate there (when it is feasible to do so), and as new firms and workers enter
these large and expanding markets, they will create greater demand for intermediate inputs and
final goods, which will in turn attract more firms and workers and make large markets even
larger (Krugman 1996; World Bank 2009). Indeed, in Krugman’s (1991a) original NEG model,
falling transport costs predict the development of a core-periphery split and hence a high level of
spatial inequality prevailing in equilibrium.17
Spatial inequality outcomes—whether they are defined as inter- or intra-regional differences in
economic outcomes—are the net result of these centrifugal and centripetal forces. Empirical
research suggests that infrastructure investments generally have the net effect of dispersing
rather than concentrating economic activity in developing countries. Baum-Snow et al. (2017)
examine the effect of road and railway infrastructure on the spatial distribution of economic
activity in China. They find that ring road investments displaced 50 percent of industrial GDP
from central cities to outlying areas. They also find that railway investments have similar, but
quantitatively smaller impacts. Bayes (2007) provides evidence that a US$1 billion bridge
investment in Bangladesh, which connected farmers and firms in the underdeveloped,
northwestern division of Rajshahi to the country’s more economically developed eastern
divisions, expended market access, reduced input prices, facilitated diversification into higher-
value crops, and ultimately reduced the level of income inequality within Rajshahi (a first-order
15
There is also evidence that transportation investments expand firm productivity, output growth, and exports (Faber
2014; Ghani et al. 2016; Martincus et al. 2017), and increase household income in geographically proximate areas
(Jacoby 2000; Bayes 2007; Khandker et al. 2009; Jacoby and Minten 2009).
16
Faber (2014) provides evidence that China’s National Trunk Highway System did not diffuse economic activity
away from metropolitan areas to peripheral areas. Instead, the investment in inter-regional transportation
infrastructure actually reduced levels of economic activity in the newly connected peripheral regions relative to non-
connected peripheral regions.
17
In developing countries, labor may initially be immobile so that firms concentrate close to final demand. If this is the
case, then initial investments in infrastructure first permit a greater concentration of economic activity as firms cluster
to exploit agglomeration economies, which is then followed by a diffusion of activity as the productive landscape
becomes more diverse and firms spread out to exploit local price differentials in immobile factors (Puga 1999). In any
case, the presence of increasing returns to scale implies that initial infrastructure investments can be greatly amplified
through the forces they set in motion.
10administrative region).18 Bird and Straub (2015) provide evidence that investments in Brazil’s
road network increased economic agglomeration in the already prosperous population centers
of the South while also facilitating economic agglomeration in less developed areas of the North,
but on balance these investments reduced spatial inequality across the country’s municipalities
(second-order administrative units).
Another important feature of transportation infrastructure projects is that they are public goods.
Roads, bridges, railways, and ports are typically non-rival in consumption and non-excludable,19
meaning that their benefits generally accrue to a wide range of individuals and segments of the
economy.20 Many other types of infrastructure investments (e.g., electricity lines, water pipes,
sewerage connections, schools, hospitals, and public housing) are rival in consumption,
providing benefits from which specific groups can be—and in developing countries often are—
excluded (Burgess et al. 2015; De Luca et al. 2018; Ejdemyr 2018).To the extent that
infrastructure projects can be narrowly targeted towards specific geographic areas, or restricted
for use by specific groups, they may even adversely affect spatial inequalities (Kasara 2007;
Ichino and Nathan 2013).
Connective infrastructure investments are also likely to deliver more immediate and easily
detectable reduction in spatial inequality than other types of development projects. Infrastructure
projects reduce transportation costs for firms in a wide variety of sectors and increase the
relative mobility of firms and households in poorer areas. 21 By contrast, the distributional
impacts of other types of development projects—for example, health and education investments
that promote the accumulation of human capital among poorer segments of society—likely
accrue over longer periods of time (Mayer 2001; Clemens et al. 2012).22
2.3 Chinese Government-Financed Connective Infrastructure and Spatial Inequality
18
Similarly, Khandker et al. (2009) provide evidence that rural road investments in Bangladesh have reduced poverty
and inequality at the village level by reducing agricultural input prices, increasing agricultural output prices, and
expanding agricultural production.
19
Users can only be excluded from connective infrastructure if a toll is imposed, which is rare among the Chinese
Government-financed projects that we analyze. Notwithstanding the existence of some poorly designed projects that
underestimated levels of usage, rivalry in the use of connective infrastructure is also uncommon.
20
Previous research suggests that public works projects and other public capital investments tend to narrow the
connectivity gap between a region’s poor and wealthy, while also reducing the relative production and transaction
costs of the poor (Ferreira 1995; Gannon and Liu 1997).
21
Capital infrastructure projects may also flatten the spatial distribution of economic activity if they create employment
on a large scale in poor areas with high levels of unemployment—in particular, during the construction phase of such
projects.
22
It is also worth mentioning that infrastructure lowers the costs of human and capital mobility and thereby makes
human capital development cheaper for the poor (Brenneman and Kerf 2002; Leipziger et al. 2003).
11There are also several theoretical reasons to believe that China might be more effective than
traditional financiers of connective infrastructure at diffusing economic activity across
geographic space: its willingness and ability to implement transportation infrastructure projects
on an expedited schedule, the extent to which its investments challenge rather than reinforce
preexisting spatial distributions of economic activity, and the degree to which it co-locates
projects in different sectors to promote agglomeration economies.
First, China might be more efficient than traditional donors and lenders in implementing
transportation infrastructure projects. In 2008, the then-President of Senegal Abdoulaye Wade
publicly criticized traditional donors and lenders in the Financial Times for their disapproval of
China’s rapidly expanding overseas development program, noting that “China has helped
African nations build infrastructure projects in record time… a contract that would take five years
to discuss, negotiate and sign with the World Bank takes three months when we have dealt with
the Chinese authorities.” Similarly, Swedlund (2017: 128-129) reports that “[it] is clearly a
dominant perception among many recipient-government officials that the Chinese are much
faster than traditional donors at getting things done. One donor official recounted … having it
explained to him that, if a traditional donor wants to build a road in 2012, the process needs to
start in 2007. If the Chinese are going to build the same road, they start in 2011, and it is
23
finished in 2012” (Swedlund 2017: 128-129). Therefore, inasmuch as transportation
infrastructure projects are effective at reducing spatial inequality and China executes these
projects more efficiently than others, one would expect Chinese-financed transportation
infrastructure projects to have stronger and faster inequality-reducing effects than transportation
infrastructure projects backed by traditional donors and lenders.
Second, China might be more willing than traditional donors to fund the types of transportation
investments that can help host countries escape inefficient spatial equilibria—e.g., situations in
which most economic activity is concentrated in one or few primate cities and there is little
economic activity in rural towns and villages. Colonial-era investments were highly localized in
many developing countries, setting in motion powerful forces of economic agglomeration and
creating spatial inequalities that have persisted over long periods of time (Bonfatti and
23
These anecdotal accounts are broadly consistent with the empirical evidence presented in Bunte et al. (2018).
They find large nighttime light impacts from Chinese investment projects and no impacts from U.S. investment
projects in Liberia. They also report that the central authorities were particularly motivated to work with the Chinese
because of their reputation for expeditious implementation of projects, including large-scale transport infrastructure
projects.
12Poelhekke. 2017; Roessler et al. 2018). 24 In other cases, the geographical distribution of
economic activity has become highly skewed due to ethnic in-group and out-group dynamics or
historical accidents (Krugman 1991a; Posner 2004; Padró i Miquel 2007; Cederman et al. 2010;
Wucherpfennig et al. 2011; Alesina et al. 2016; Ezcurra and Rodrıguez-Pose 2017; De Luca et
al. 2018; Bommer et al. 2018).25
One way to escape such traps is to invest in projects that challenge rather than reinforce
preexisting distributions of economic activity—for example, by connecting inland and coastal
communities. Bonfatti and Poelhekke (2017) point out that the traditional bilateral and
multilateral donors prefer to invest in overland (interior-to-interior) transportation networks
between countries, while China prefers to invest in interior-to-coast transportation networks.26
This preference may reflect China’s own experience with spatial inequality (Ravallion 2009: 309;
Li et al. 2013: 307). When it opened up its economy to foreign investment during the 1980s,
China not only experienced rapid economic growth, but also sharp increases in spatial
inequality (Kanbur and Zhang 2005; Fleisher et al. 2010). The government responded with a set
of spatial inclusion policies and programs—the “Develop the West Campaign” ( )—
that redirected private and public investment to less economically developed areas in the central
and western parts of the country.27 Several studies suggest that the development of interior-to-
coast transportation networks helped reverse a trend of growing inequality within and across the
country’s subnational localities (Lessmann 2013; Mao 2011; Huang and Wei 2016; Wu et al.
24
In Ghana, for example, the British invested heavily in two railroad lines in the early 1900s: a Western line that
connected the mines of Tarkwa and Obuasi to the coast and an Eastern line that connected Accra with gold mines
and cocoa-growing areas in the rural hinterlands. Over time, villages, towns, and economic activity clustered
alongside these transportation corridors, and this spatial equilibrium has proven to be remarkably stable because
colonial investments created local increasing returns to scale and served as anchors for future rounds of public
investment during the post-colonial era, thereby centralizing rather than decentralizing economic activity (Jedwab and
Moradi 2016).
25
Ethiopia—where some ethnic groups (the Tigray, Oromo, Amhara) have significant representation in the central
government, and others (Somalis and Afars) face high levels of political discrimination—provides a good example of
the former. Public resources and economic activity are concentrated in the geographical areas dominated by the
Tigray, Oromo, and Amhara and not in the ethnic homelands of the Somalis and Afars (Argaw 2017). Krugman
(1991b) points to the highly concentrated carpet industry in Dalton, Georgia as an example of the latter. A young
woman from this town, named Catherine Evans, made a tufted bedspread in 1895 as wedding gift. Tufted
bedspreads, in turn, became popular in that geographical area and led to the development of tufting skills and the
emergence of a cottage industry, which then led to large-scale manufacturing of tufted carpets in northwestern
Georgia after World War II.
26
Bonfatti and Poelhekke (2017: 105) note that investments in interior-to-interior transportation networks tend to
increase trade with neighboring countries, and investments in interior-to-coast transportation networks tend to
increase trade with overseas countries, but it is not clear which of these investments most effectively reduce skew in
the geographical distribution of economic activity.
27
China’s Ninth Five-Year Plan (1996–2000) identified the country’s central and western regions as public investment
priorities. Also, under the auspices of the 2000 Western Region Development Strategy and the 2004 Rise of Central
China Plan, the central government launched an ambitious effort to lure foreign investors to the country’s western and
central regions (Huang and Wei 2016).
132018).28 Therefore, if China has a unique and coherent way of making domestic investments in
connective infrastructure, it is possible that the transportation infrastructure projects China
finances abroad more effectively diffuse economic activity than similar projects funded by
traditional donors.
Third, China places special emphasis on making complementary social sector and productive
sector investments in or near the geographical areas where it is implementing transportation
projects (Li et al. 2013: 306-307). This is a potentially consequential source of variation between
China and traditional donors, as previous research suggests that these types of coordinated
public investment strategies are particularly effective at diffusing economic activity across
geographic space (Isserman and Rephann 1995; Meng 2013).29 Coordinated public investment
strategies trace their intellectual origins to “growth pole” theory—the idea that the concentration
and co-location of a complementary set of investments in specific geographic areas will create
clusters of interconnected firms, nurture the development of local markets, set in motion
economic agglomeration processes, and reduce local unemployment (Perroux 1950, 1955;
Myrdal 1957; Hirschman 1958; Boudeville 1966; Speakman and Koivisto 2014).
In light of these considerations, the core hypothesis that we seek to test is whether Chinese
development projects—in particular, transportation infrastructure projects—reduce spatial
inequalities within and between subnational jurisdictions. We also explore two auxiliary
hypotheses: (a) whether Chinese connective infrastructure financing is more effective at
diffusing economic activity in subnational localities where it co-locates these investments with
other social sector and productive sector investments, and (b) whether these effects are any
different for a “traditional” donor (the World Bank).
3. Data
3.1 A New Geocoded Dataset of Chinese Government-Financed Projects
The Chinese government considers the details of its overseas development program to be a
“state secret” (Bräutigam 2009: 2). It does not publish a country-by-country breakdown of its
28
A recent study demonstrates that China invested roughly ten times more than India did in its own highway system,
and that India could increase economic growth and lower regional income disparities if it invested in a Chinese-style
highway grid that penetrates previously isolated poor regions (Alder 2017).
29
A quasi-experimental evaluation of the U.S. Government’s regional development program in Appalachia has
demonstrated that it was effective in reducing spatial inequality: between 1965 and 1991, per capita income
increased 17 percentage points faster in the Appalachian counties that benefited from the targeted investment
package than a matched set of U.S. counties with otherwise similar baseline economic characteristics (Isserman and
Rephann 1995). China observed a similar reduction in spatial inequality under its so-called “8-7” plan, which sought
to bring 80 million people in 593 economically disadvantaged counties out of poverty within seven years (1994-2000)
through a geographically targeted package of infrastructure, health, education, and public employment interventions
(Meng 2013).
14expenditures or activities.30 Nor does it systematically publish project-level data on its less
concessional and more commercially-oriented financial expenditures and activities in developing
countries. In order to overcome this challenge, we collaborated with AidData, a research lab at
the College of William & Mary, to build a first-of-its-kind dataset of the subnational locations
where Chinese Government-financed projects took place around the globe between 2000 and
2014.31 This dataset captures all official committed projects that entered implementation or
reached completion between 2000 and 2014 in five regions of the world (Africa, the Middle East,
Asia and the Pacific, Latin America and the Caribbean, and Central and Eastern Europe) and
were supported by Chinese official financing—i.e., foreign aid and other forms of concessional
and non-concessional financing from Chinese government institutions.32
In total, the dataset captures 3,485 projects (worth US$273.6 billion in constant 2014 dollars) in
6,184 discrete locations across 138 countries. Figure 1 shows the locations of Chinese
Government-financed projects over the 2000-2014 period. Figure 2 weights each project by its
financial size in constant 2014 US dollars. Figure 1 illustrates the global reach of Chinese official
finance in the 21st century. Consistent with earlier periods of Chinese aid giving (Dreher and
Fuchs 2015), Chinese projects are densely concentrated in African and Asian countries. Figures
1 and 2 also call attention to the fact that many Chinese Government-financed projects are
situated in coastal regions, including some of the highest-value projects financed by Beijing.
The underlying project-level data is from Dreher et al. (2017), who use a publicly available
method called Tracking Underreported Financial Flows (TUFF) to facilitate the collection of
detailed and comprehensive financial, operational, and locational information about Chinese
30
The Chinese government publishes some data on its foreign aid activities, but they are insufficiently detailed for
use in social science research. The State Council has published two “White Papers” on the country’s foreign aid
program—one in 2011 and another in 2014—that provide summary statistics on the total amount of aid provided to
five regions of the world (Information Office of the State Council 2011, 2014). The Ministry of Finance also publishes
data on the country’s total foreign aid expenditure through its website and a publication called the Finance Yearbook
of China. However, neither of these official sources provides country-level or project-level data, let alone
georeferenced data.
31
We build on earlier georeferenced datasets that cover Africa, the Tropical Andes, and the Mekong Delta for fewer
years only (BenYishay et al. 2016; Dreher et al. 2016). Note that we exclude all suspended and cancelled programs
as well as projects that reached the (non-binding) pledge stage or (binding) official commitment stage but never
reached implementation or completion during the period of study (2000-2014).
32
More precisely, the dataset codes all Chinese Government-financed projects as ODA-like, OOF-like, or Vague
Official Finance. Chinese ODA-like projects refer to projects financed by Chinese Government institutions that have
development intent and a minimum level of concessionality (a 25 percent or higher grant element). Chinese OOF-
projects refer to projects financed by Chinese Government institutions that have commercial or representational intent
and/or lack a grant element of 25% or more. Projects assigned to the Vague Official Finance category are Chinese
Government-financed projects where there is insufficient information in the public domain about concessionality
and/or intent to make a clear determination as to whether the flows are more akin to ODA or OOF. Total Chinese
Official Finance (OF) is therefore the sum of all projects coded as ODA-like, OOF-like, or Vague (Official Finance).
For more detailed discussion of the distinction between these types of Chinese development finance see Dreher et.
al. 2018a.
15government-financed projects. The TUFF method triangulates information from four types of
open sources—English, Chinese and local-language news reports; official statements from
Chinese ministries, embassies, and economic and commercial counselor offices; the aid and
debt information management systems of finance and planning ministries in counterpart
countries; and case study and field research undertaken by scholars and non-governmental
organizations (NGOs)—in order to minimize the impact of incomplete or inaccurate
information.33 Economists, political scientists, and computational geographers have used this
dataset and earlier versions of it—capturing fewer countries and years—to explain the nature,
allocation and effects of Chinese Government-financed projects (BenYishay et al. 2016; Kilama
2016; Hernandez 2017; Strange et al. 2017b; Brazys et al. 2017; Isaksson and Kotsadam
2018a, 2018b; Martorano et al. 2018; Bonfatti and Poelhekke 2017).
We limited the scope of our geocoding effort to Chinese Government-financed projects that
were completed or in implementation during this period of study. All of these projects were
subjected to a double-blind geocoding process (Strandow et al. 2011), in which two trained
experts independently employ a defined hierarchy of geographic terms and independently
assign uniform latitude and longitude coordinates and standardized place names to each
location where the project in questions was active. Coders also specify a precision code for
each location where a given project was active. Precision code 1 corresponds to an exact
location; precision code 2 corresponds to locations within 25 kilometers of the exact project site;
precision code 3 corresponds to a second-order administrative (ADM2) region; and precision
code 4 corresponds to a first-order administrative (ADM1) region.34 These two sets of codes
(latitude and longitude coordinates and geographic precision codes) are then checked against
each other. If they are identical, they become the final set of codes. If they are not identical, the
project in question is assigned to a senior “arbitrator” who identifies the underlying source of the
discrepancy or discrepancies and assigns a master set of geocodes for all of the intervention
sites described in the project documentation. The purpose of this double-blind coding process is
to minimize the risk of missed or incorrect locations.
In order to merge these geocoded project data with our outcome measures of nighttime light
inequality within subnational localities, we aggregate all projects with precision codes 1-4 to
33
The method is organized in three stages: two stages of primary data collection (project identification and source
triangulation) and a third stage to review and revise individual project records (quality assurance). The TUFF data
collection and quality assurance procedures are described at length in Dreher et al. (2017) and Strange et al.
(2017a).
34
We exclude all projects with precision codes between 5 and 9. Such projects (e.g., country-wide projects) were not
able to be geocoded with a sufficient level of spatial precision to be included in our ADM1-level dataset or ADM2-level
dataset.
16ADM1s and all projects with precision codes 1-3 to ADM2 regions. The resulting subsample
includes 2,142 Chinese government-financed projects at 4,432 discrete locations (collectively
worth US$ 193 billion) that were completed or being implemented in 883 ADM1 regions and
1,319 ADM2 regions within 129 countries between 2000 and 2014. These data can be
disaggregated by financial flow type (ODA-like, OOF-like, Vague Official Finance) or sector. For
the purposes of the latter, we use the OECD’s three-digit sector classification scheme, which
categorizes projects according to their primary objectives.35 43% of the projects in our sample
supported economic infrastructure and services, including roads, railways, bridges, seaports,
airports, power grids, power lines, cell phone towers, and fiber optic cable lines.36 42% of the
projects in our sample focused on the provision of social infrastructure and services, such as
hospitals, schools, piped water, and sewerage. Projects in the production sectors (e.g., mining,
industry, trade, tourism, agriculture, forestry, and fishing) represent only 7% of our sample.
3.2 Measuring Inequality Within and Across Subnational Jurisdictions
Reliably measuring local economic activity across the globe with official data is incredibly
difficult. Few countries collect and report comprehensive data at the individual or establishment
level at regular intervals and subnational GDP data are generally only available in highly
developed countries. 37 To circumvent this problem, we follow a recent literature that uses
nighttime light intensity as a proxy for local economic activity (Henderson et al. 2012;
Michalopoulos and Papaioannou 2014; Hodler and Raschky 2014; Pinkovskiy and Sala-i-Martin
2016; Dreher et al. 2016). While night lights were initially proposed as a proxy for GDP in
countries with weak statistical capacity, they were quickly adopted as a measure of regional
economic activity (Michalopoulos and Papaioannou 2014; Hodler and Raschky 2014).
Subsequent studies have demonstrated that changes in light emissions correlate strongly with
35
There are 24 of these OECD sector codes: education (110), health (120), population policies/programs and
reproductive health (130), water supply and sanitation (140), government and civil society (150), other social
infrastructure and services (160), transport and storage (210), communications (220), energy generation and supply
(230), banking and financial services (240), business and other services (250), agriculture, forestry and fishing (310),
industry, mining, and construction (320), trade and tourism (330), general environmental protection (410), women in
development (420), other multisector (430), general budget support (510), developmental food aid/food security
assistance (520), non-food commodity assistance (530), action relating to debt (600), emergency response (700),
support to NGOs and government organizations (920), and unallocated/unspecified (998).
36
27.4% of the projects in our sample were assigned to the “Transport and Storage” sector, and the vast majority of
these projects focused on building transportation infrastructure, such as roads, railways, bridges, seaports, and
airports.
37
Nevertheless, there have been many attempts to create and compile such data. For example, the G-Econ
database reports a gross cell product for one degree by one degree cells in 1990, 1995, 2000, and 2005, while
Gennaioli et al. (2014) compile a heavily unbalanced dataset of regional GDPs for 83 countries from the early 1950s
until 2010.
17You can also read