Air health trends Canadian Environmental Sustainability Indicators - Government of Canada
←
→
Page content transcription
If your browser does not render page correctly, please read the page content below
Canadian Environmental
 Sustainability Indicators
Air health trends
Suggested citation for this document: Environment and Climate Change Canada (2018) Canadian
Environmental Sustainability Indicators: Air health trends. Consulted on Month day, year.
Available at: www.canada.ca/en/environment-climate-change/services/environmental-indicators/air-
health-trends.html.

Cat. No.: En4-144/85-2018E-PDF
ISBN: 978-0-660-27805-6

Unless otherwise specified, you may not reproduce materials in this publication, in whole or in part,
for the purposes of commercial redistribution without prior written permission from Environment and
Climate Change Canada's copyright administrator. To obtain permission to reproduce Government of
Canada materials for commercial purposes, apply for Crown Copyright Clearance by contacting:

Environment and Climate Change Canada
Public Inquiries Centre
12th floor, Fontaine Building
200 Sacré-Coeur boul.
Gatineau, QC K1A 0H3
Telephone: 1-800-668-6767 (in Canada only) or 819-938-3860
Fax: 819-938-3318
Email: ec.enviroinfo.ec@canada.ca

Photos: © Thinkstockphotos.ca; © Environment and Climate Change Canada

© Her Majesty the Queen in Right of Canada, represented by the Minister of Environment and
Climate Change, 2018

Aussi disponible en français

Air health trends                                                                   Page 2 of 20
Canadian Environmental
                                                          Sustainability Indicators
                                                        Air health trends
                                                                                                                 September 2018

Table of Contents
Air health trends ................................................................................................................................... 5
       Key results ...................................................................................................................................... 5
   Regional air health trends................................................................................................................... 6
       Key results ...................................................................................................................................... 6
   Air health trends by age and sex ........................................................................................................ 7
       Key results ...................................................................................................................................... 7
   About the indicators ............................................................................................................................ 9
       What the indicators measure .......................................................................................................... 9
       Why these indicators are important ................................................................................................ 9
       Related indicators ........................................................................................................................... 9
   Data sources and methods............................................................................................................... 10
       Data sources ................................................................................................................................ 10
       Methods ........................................................................................................................................ 11
       Recent changes............................................................................................................................ 14
       Caveats and limitations ................................................................................................................ 14
   Resources......................................................................................................................................... 15
       References ................................................................................................................................... 15

Annex ................................................................................................................................................... 16
   Annex A. Data tables for the figures presented in this document .................................................... 16

Canadian Environmental Sustainability Indicators                                                                                 Page 3 of 20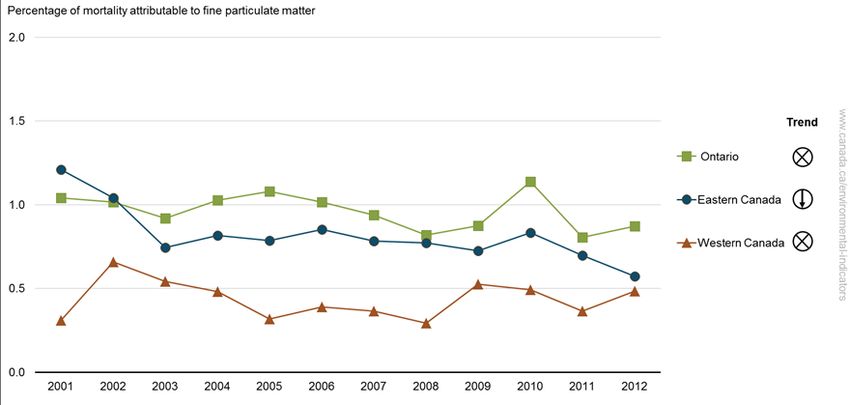
List of Figures
   Figure 1. Mortality attributable to ground-level ozone (1984 to 2012) and fine particulate matter
   (2001 to 2012), Canada ..................................................................................................................... 5
   Figure 2. Mortality attributable to ground-level ozone by region, Canada, 1984 to 2012 ................. 6
   Figure 3. Mortality attributable to fine particulate matter by region, Canada, 2001 to 2012 ............. 7
   Figure 4. Mortality attributable to ground-level ozone by age and sex, Canada, 1984 to 2012 ........ 8
   Figure 5. Mortality attributable to fine particulate matter by age and sex, Canada, 2001 to 2012.... 8

List of Tables
   Table 1. Canadian urban areas used for the Air health trends indicators ....................................... 13
   Table A.1. Data for Figure 1. Mortality attributable to ground-level ozone (1984 to 2012) and
   fine particulate matter (2001 to 2012), Canada ............................................................................... 16
   Table A.2. Data for Figure 2. Mortality attributable to ground-level ozone by region, Canada,
   1984 to 2012 .................................................................................................................................... 17
   Table A.3. Data for Figure 3. Mortality attributable to fine particulate matter by region, Canada,
   2001 to 2012 .................................................................................................................................... 18
   Table A.4. Data for Figure 4. Mortality attributable to ground-level ozone by age and sex,
   Canada, 1984 to 2012 ..................................................................................................................... 18
   Table A.5. Data for Figure 5. Mortality attributable to fine particulate matter by age and sex,
   Canada, 2001 to 2012 ..................................................................................................................... 19

Air health trends                                                                                                            Page 4 of 20
Air health trends
Canadians are regularly exposed to air pollution from buildings, vehicles and industries. This can
affect our health and lead to work absences, hospital visits and death. The Air health trends indicators
measure the proportion of deaths that can be attributed to 2 major air pollutants: ground-level ozone
1
(O3) and fine particulate matter (PM2.5).
Key results
Although substantial efforts have been made to improve air quality in Canada over the last few
decades, the indicators suggest that outdoor air pollution continues to be an important public health
issue in Canada.
On average, for those years for which estimates can be made, approximately 2% of deaths,
excluding deaths from injuries, can be attributed to O3 exposure and 0.8% to PM2.5 exposure
The proportion of deaths that can be attributed to O3 shows an increasing trend
Figure 1. Mortality attributable to ground-level ozone (1984 to 2012) and fine particulate matter
(2001 to 2012), Canada
Data for Figure 1
Note: Mortalities attributable to exposure to ground-level ozone or fine particulate matter are estimates of the proportion of
deaths attributable to these pollutants.
Source: Health Canada (2017) Environmental Health Science and Research Bureau, Population Studies Division.
1
The Air health trends indicators are different from the Air Quality Health Index. The Air health trends indicators are national
annual indicators, while the Air Quality Health Index is location-specific and updated many times a day. For more information
on the AQHI, visit the Environment and Climate Change Canada Air Quality Health Index website.
Canadian Environmental Sustainability Indicators Page 5 of 20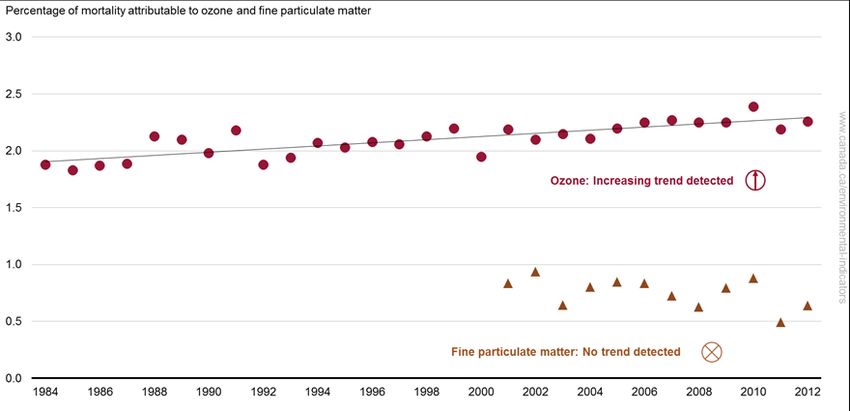
The estimates of deaths due to O3 exposure were about 2% overall, increasing slightly from 1984 to
2012. This is despite the fact that in the Air quality indicators we see a slight decline in peak level O3
and no trend in average levels from 2002 to 2016. The discrepancy occurs because mortality due to
pollution is estimated using daily results rather than an annual average or peak. Therefore, the results
are sensitive to multiple high levels that may occur over a given year.
The estimates of deaths attributable to PM2.5 exposure are available for a shorter period (2001 to
2012). They are quite variable (a high of 0.9% in 2002 and a low of 0.5% in 2011), and no trend can
be detected.
The national Air health trends indicators provide a view of the public health impacts attributable to
short-term exposure to outdoor air pollution in the form of O3 and PM2.5. The current indicators relate
mortality to the air pollution concentrations on the same day only; they do not include the health
impacts of long-term exposure to these air pollutants.
Deaths from all causes except injuries are the result of a variety of risk factors. Aside from pollution
exposure, other risk factors include age, sex, race, obesity, smoking history, education, marital status,
diet, medicine usage, alcohol consumption, occupational exposures, and pre-existing health
conditions. The indicators estimate deaths related solely to the risk from short-term exposure to air
pollution.
Regional air health trends
Key results
Deaths attributable to O3 shows upward trends for all the regions between 1984 and 2012
No trend was detected for PM2.5 between 2001 and 2012, except in Eastern Canada where it
shows a downward trend
Ontario shows lower deaths attributable to O3, whereas Western Canada shows lower deaths
attributable to PM2.5
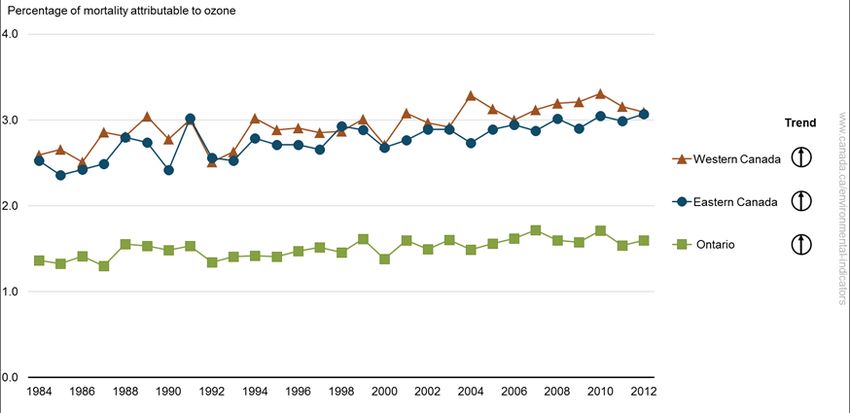
Figure 2. Mortality attributable to ground-level ozone by region, Canada, 1984 to 2012
Data for Figure 2
Air health trends Page 6 of 20Figure 3. Mortality attributable to fine particulate matter by region, Canada, 2001 to 2012
Data for Figure 3
Note: The Eastern Canada region is composed of 5 urban areas; Ontario has 13 urban areas and Western Canada has
6 urban areas. For more information, please consult the Methods section. An up arrow means an increasing trend; a down
arrow means a decreasing trend; an "X" means no trend. Mortality attributable to ground-level ozone or fine particulate matter
exposure are estimates of the proportion of deaths attributable to these pollutants.
Source: Health Canada (2017) Environmental Health Science and Research Bureau, Population Studies Division.
The regional indicators show some disparities among the 3 regions of the country. While all 3 regions
show upward trends in deaths attributable to O3, Eastern Canada is the only region that displays a
downward trend in deaths attributable to PM2.5. Compared with the other regions, Ontario shows
relatively fewer deaths attributable to O3, but more deaths attributable to PM2.5. Western Canada
shows fewer deaths attributable to PM2.5.
Over the 29 years between 1984 and 2012, in Eastern Canada and Western Canada approximately
2
3% of deaths can be attributed to ground-level ozone, and in Ontario, 2%.
Between 2001 and 2012, on average, 0.8% of deaths can be attributed to fine particulate matter
exposure in Eastern Canada, 1.0% in Ontario and 0.4% in Western Canada.
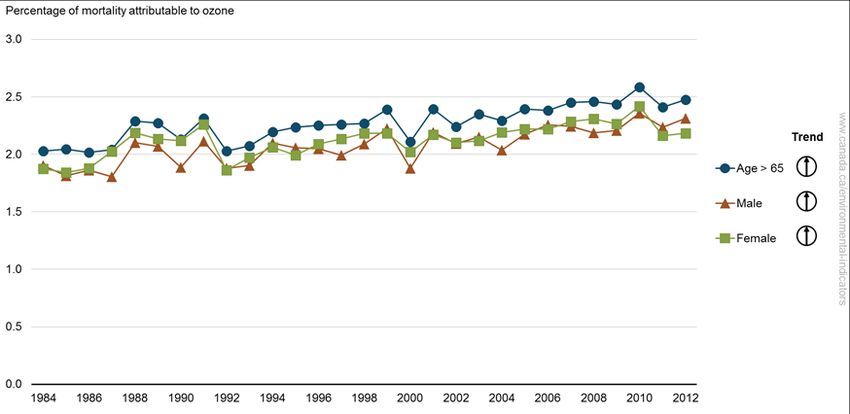
Air health trends by age and sex
Key results
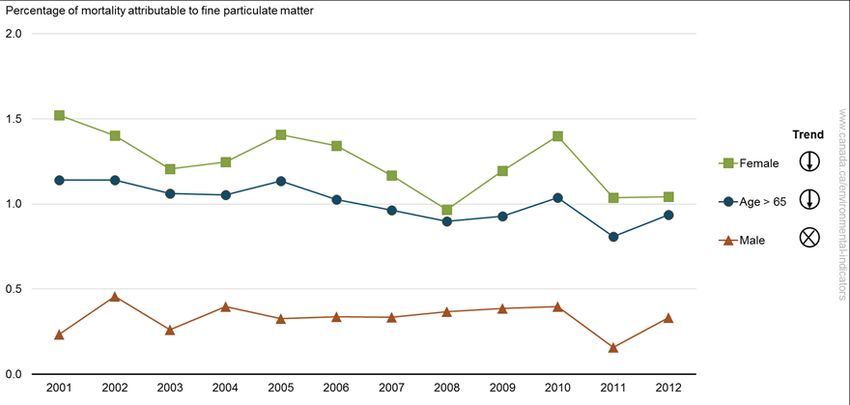
People aged 65 years and older show an upward trend in deaths attributable to O 3 and a
downward trend for PM2.5
Both males and females show increasing trends in deaths attributable to O 3, while females
show a decreasing trend for PM2.5
2
Excluding deaths from injuries.
Canadian Environmental Sustainability Indicators Page 7 of 20Figure 4. Mortality attributable to ground-level ozone by age and sex, Canada, 1984 to 2012
Data for Figure 4
Figure 5. Mortality attributable to fine particulate matter by age and sex, Canada, 2001 to 2012
Data for Figure 5
Note: An up arrow means an increasing trend; a down arrow means a decreasing trend; an ""X"" means no trend. Mortality
attributable to ground-level ozone or fine particulate matter exposure are estimates of the proportion of deaths attributable to
these pollutants.
Source: Health Canada (2017) Environmental Health Science and Research Bureau, Population Studies Division.
Air health trends Page 8 of 20The indicators for O3 and PM2.5 do not show substantial differences in mortality attributable to air
pollutants for people aged 65 years or older when compared with the general population.
Approximately 2% and 1% of deaths can be attributed to O3 and PM2.5, respectively, for people aged
65 years or older.
Approximately 2% of deaths can be attributed to O3 for both males and females. On the other hand,
for males and females, 0.3% and 1.2% of deaths, respectively, could be attributed to fine particulate
matter. There is no known explanation for sex differences in deaths due to air pollution.
About the indicators
What the indicators measure
The Air health trends indicators were developed as a tool to monitor trends in public health impacts in
Canada attributable to short-term exposure to 2 important outdoor air pollutants: O3 and PM2.5.
Specifically, the indicators estimate and track the percentage of all deaths, excluding those from
injuries, that can be attributed to exposure to O3 (monitored in 24 cities) and PM2.5 (monitored in
22 cities).
Why these indicators are important
Exposure to air pollution can lead to chronic lung disease, heart attacks, strokes and mortality. These
adverse health effects contribute to economic costs through lost productivity and additional visits to
doctors’ offices and hospitals. They also influence overall well-being when individuals and families
must deal with illness and death.
Related indicators
The Air quality indicators track ambient concentrations of PM2.5, O3, sulphur dioxide (SO2), nitrogen
dioxide (NO2), and volatile organic compounds (VOCs) at the national and regional levels and at local
monitoring stations.
Canada's Air pollutant emissions indicators track emissions from human-related sources of 6 key air
pollutants: sulphur oxides (SO X), nitrogen oxides (NOX), VOCs, ammonia (NH3), carbon
monoxide (CO), and PM2.5.
Safe and healthy communities
These indicators support the measurement of progress towards the following 2016–2019 Federal
Sustainable Development Strategy long-term goal: All Canadians live in clean, sustainable
communities that contribute to their health and well-being.
Canadian Environmental Sustainability Indicators Page 9 of 20Data sources and methods
Data sources
The number of deaths, excluding deaths from injuries, were based on the daily non-accidental
mortality data obtained from the national Vital Statistics - Death Database (CVSD) maintained by
Statistics Canada.
The daily O3 and PM2.5 concentration data were obtained from the National Air Pollution Surveillance
Program operated by Environment and Climate Change Canada.
Daily mean temperature data were obtained from the National Climate Data and Information Archive
of Environment and Climate Change Canada.
More information
To estimate the mortality attributable to air pollution, 2 main datasets were used: daily
mortality and air pollution concentrations. Additional data were also used to adjust the
mortality estimates to account for confounding factors that could influence the relationship
between air pollution exposure and mortality:
calendar time, to account for seasonal and long-term variations in mortality rates
daily temperature, to take into consideration the short-term effect of weather on daily
mortality rates
days of the week, to account for mortality that varies day by day according to our
daily life structure
Data covered a 29-year period (1984 to 2012) for O3 and a 12-year period (2001 to 2012) for
PM2.5.
Selection of urban areas
The geographical extent of urban areas was defined using census divisions. Urban areas
were selected based on data availability and completeness. To be selected, the urban area
required mortality and air pollution concentrations data available for at least 50% of the days
(more than 182 days) in each year. The indicators include 24 urban areas for O3 and
22 urban areas for PM2.5.
Mortality data
Statistics Canada extracted the mortality data from the Death Database for the specified
urban areas. Data were included only when the census division of residence was the same
as the census division of death occurrence, and the deaths were from internal causes (that is,
3
excluding external causes such as injuries).
Air pollution concentrations
The air pollutants of interest are O3 and PM2.5, which are strongly linked to adverse health
4
effects in Canada, including mortality. The same metrics as those used by the Canadian
Council of Ministers of the Environment were applied to ozone (daily 8-hour maximum) and
PM2.5 (daily 24-hour average) on an annual basis. For each monitoring station, the daily
average concentration was calculated only if at least 18 out of 24 hourly concentrations (75%)
for that day were available. Otherwise, it was recorded as missing. For each urban area, daily
average concentrations were in turn averaged over monitoring stations if there were 2 or
more stations located in that census division.
3
International Classification of Diseases - ICD-9 codes < 800 and ICD-10 codes A00-R00.
4
Health Canada (2017) Health impacts of air pollution in Canada.
Air health trends Page 10 of 20Methods
Results are expressed as the proportion of mortality attributable to exposure to the air pollutants. This
is estimated by multiplying the annual air pollutant concentrations by the factor "annual mortality risk"
multiplied by 100.
The annual mortality risk factor is a rate giving the likely increase in daily mortality associated with a
unit increase in that air pollutant concentration for a given year. For each year, the annual mortality
risks of O3 (1984 to 2012) and of PM2.5 (2001 to 2012) were calculated for each urban area and
adjusted for seasonal variation, weather and day of the week. A national annual mortality risk was
then calculated by combining the annual mortality risks from each of the urban areas using a
hierarchical model.
More information
The annual mortality risks at national and regional levels are estimated using statistical
models. Change over time can be detected by the differences in those annual mortality risks.
It is assumed for each year that there is a single distribution of true risks for all urban areas
across Canada and that this distribution can be characterized by a single risk model with
national mean and variance among urban areas. Urban areas in the same region share the
same risk distribution.
Statistical modelling for urban area-specific risk
The annual mortality risk from O3 and PM2.5 exposure for each urban area was estimated
using a generalized Poisson model. Daily counts of mortality were assumed to depend on:
air pollution and the day of the week in a linear manner
time and temperature in a non-linear manner
For urban area-specific risk estimates, ˆij with urban area location i and calendar year j, a
generalized additive over-dispersed Poisson regression model was applied to the daily
mortality counts, Yij . For this model we assumed that:
Equation 1.
where:
t is the calendar time indicating day 1, 2,…, N
Yij (t ) , temp0 (t ) , and dow(t ) denote, on the day t, the daily mortality counts, the
temperature, and the day of the week, respectively
f1ij and f 2ij are non-linear smoothing functions
g lij is a linear function for l=1,2,…,6 indicating the intraweek daily interval
xij(t) represents the concentrations of O3 or PM2.5 on the day t
ij is the parameter of interest to be estimated indicating the adverse health effect of O 3 or
PM2.5 on mortality
Canadian Environmental Sustainability Indicators Page 11 of 20Aggregating to a national model
For each year j, the national annual mortality risk is estimated by pooling the annual mortality
risks by urban area in Equation 1. A random effects model was applied using a Bayesian
approach, due to the small number of urban areas available (24 for O 3 and 22 for PM2.5). To
enable tracking of not only spatial variations but also temporal variations, a 2-stage Bayesian
hierarchical approach was adopted to model national risk.
The estimated risks in Equation 1 were modelled as follows:
Equation 2.
where:
ˆij is the estimated urban area risk obtained by Equation 1
v̂ij is the estimated conditional sampling variance, var(ˆij | ij )
The unknown true risks for urban area ( ij ) were modelled as a normal distribution, with the
mean as the annual pooled national risk ( j ), and variance (
2
j ) indicating the variation
among the urban areas.
Equation 3.
Both the national annual mortality risk and variance among urban areas vary over time. The
sampling uncertainty in the estimated annual mortality risk depends on the sample size of
mortality risks by urban area, but the variance of the unknown true annual mortality risks is
independent of this sample size.
for the true mean annual mortality risk ( j ), a normal
5
For the prior distribution
distribution N 0, 10000 with large variance was chosen for the purpose of objectivity,
meaning not favouring one value over another. Also, the normal distribution is conjugated
and so offers some computational advantages over other potential prior distributions.
Trends
To detect trends in the annual mortality risk factors, a SEN's linear trend test and a Mann-
Kendall test were applied. If no trend was detected, a random effects model was applied to
the annual mortality risk factors to remove unnecessary random variations, which returns
adjusted annual mortality risk factors. Following the tests for trends, the estimated mortality
attributable to air pollution was calculated as follows:
5
A prior distribution is a probability distribution representing uncertain quantity before some evidence is taken into account.
Air health trends Page 12 of 20Equation 4.
estimated mortality attributable to air pollution = c * r * 100
where:
c = annual air pollutant concentrations
r = annual mortality risk
Urban areas considered
The total population of the 24 urban areas has increased slightly from 49% to 52% of the total
Canadian population during the 29-year study period (for ozone) between 1984 and 2012;
their total mortality counts are consistently 47% to 48% of that for the rest of the Canadian
population.
Table 1. Canadian urban areas used for the Air health trends indicators
Ground- Fine
Urban areas level particulate
ozone matter
Halifax X X
Saint John X X
Quebec city X X
Montreal X X
Ottawa X X
Durham X X
York X X
Toronto X X
Peel X X
Halton X X
Hamilton X X
Niagara X X
Waterloo X X
Windsor X X
Sarnia X X
London X X
Sudbury X n/a
Sault Ste. Marie X X
Winnipeg X X
Regina X X
Saskatoon X n/a
Calgary X X
Edmonton X X
Vancouver X X
Note: n/a = not available.
Canadian Environmental Sustainability Indicators Page 13 of 20Regional
The indicators' urban areas are classified into 3 regions based on geographical location:
Eastern Canada (Halifax, Saint John, Quebec City, Montreal and Ottawa)
Ontario (Durham, York, Toronto, Peel, Halton, Hamilton, Niagara, Waterloo, Windsor,
Sarnia, London, Sudbury, and Sault Ste. Marie)
Western Canada (Winnipeg, Regina, Saskatoon, Calgary, Edmonton, and
Vancouver)
While the Eastern and Western Canada regions each consist of multiple provinces, the
Ontario region covers a single province. Due to the unbalanced number of urban areas
included, not all regions have comparable statistical reliability.
Recent changes
The study period has changed from 1990-2010 to 1984-2012 for ozone and from 2001-2010 to 2001-
2012 for fine particulate matter. This extended study period provides more statistical power of
detection of trends in annual mortality risk.
The health outcome of interest has changed from heart- and lung-related causes of death to non-
accidental causes, which includes the heart and lung causes. This broader health outcome provides
for a more general impact of air pollutants on the human body (that is, not limited to heart or lung).
The study period of interest has changed from "warm season," that is, between April and September,
to year-round (from January to December). This extended period provides for a more general impact
of air pollutants, not limited to a specific 6-month period. With climate change, the warm season in
Canada varies over time in terms of temperature, and thus investigation over the whole year is more
reliable for the detection of annual trends, which is the main goal of the indicators.
Caveats and limitations
The Air health trends indicators are undergoing continued development. The indicators are assessed
in communities for which the required data were available. The indicators do not include assessments
of the potential reasons behind changes in mortality attributable to air pollutant exposure.
More information
Short-term versus long-term exposure
The current indicators relate mortality to the air pollution concentrations on the same day
only, and thus they do not reflect the total impact associated with these pollutants'
concentrations over multiple days. While the indicators estimate acute risk from short-term
exposure to air pollution, there is also risk from long-term exposure.
The Air health trends indicators model estimates adverse health effects of exposure on a
single day. However, the adverse effect manifests over a period that differs from one member
of the population to another, due to different health status and thus different timing of reaction
to exposure. Some people become sick immediately, whereas it may take days or even
weeks for other people to feel the effects.
Typical models assume that the time delay between exposure and health effect will not be
longer than 2 to 3 months: it is too far removed for the exposure to have any reasonable
connection to mortality. For the model used here, it was established that even 2 to 3 months
strains plausibility, therefore we isolated the association down to a 0-day-to-14-day period
following exposure and eliminated the rest from consideration.
Air health trends Page 14 of 20Trends
To help detect a trend, the indicators are based on a dynamic model (rather than a static
model), which shows more annual variations mainly due to the smaller number of days used
for the indicators. A static model returns just one risk factor for all years combined, and thus
no trend can be detected. A dynamic model, on the other hand, uses annual data (365 or
366 days) and thus can detect annual changes or trends. Unless a trend in the annual
mortality risk factors is identified based on statistical test methods such as the parametric
regression model and the non-parametric SEN's test, those annual risks can be interpreted
as having the same value over the time period. For example, for ozone there are 29 annual
mortality risks calculated for each year in the time series. If no significant trend is found, then
no difference is assumed – meaning that the risk is the same over all years considered.
Weather effects
To account for weather effects, it might have been useful to add information on relative
humidity and dew point temperature to the mean temperature data. However, among the
24 urban areas, 8 had no appropriate relative humidity or dew point temperature data for
10 to 21 years within the study period. In addition, when tested, no significant effects of
relative humidity and dew point temperature were evident using only those urban areas that
had data available for both of these variables. Therefore, it was decided not to include relative
humidity and dew point temperature as covariates in the model.
Resources
References
Allen G (2010) Evaluation of Transformation Methods for Adjustment of Historical TEOM® Data in the
NAPS Network. Environment Canada.
Dann T (2013) Comparison of CESI PM2.5 Air Indicators with Transformed Data (FEM Basis).
Prepared for Environment Canada.
Environment and Climate Change Canada (2018) National Air Pollution Surveillance Program.
Huang Y et al. (2005) Bayesian hierarchical distributed lag models for summer ozone exposure and
cardio-respiratory mortality. Environmetrics 16:547-562.
Shin HH et al. (2008) A Temporal, Multi-City Model to Estimate the Effects of Short-Term Exposure to
Ambient Air Pollution on Health. Environmental Health Perspectives 116(9):1147-1153.
Shin HH et al. (2009) Measuring Public Health Accountability of Air Quality Management. Air Quality,
Atmosphere, and Health 2:11-20.
Shin HH et al. (2012) Tracking National and Regional Spatial-Temporal Mortality Risk Associated with
NO2 Concentrations in Canada: A Bayesian Hierarchical 2-level Cluster Model. Risk Analysis
32(3):513-30.
Canadian Environmental Sustainability Indicators Page 15 of 20Annex
Annex A. Data tables for the figures presented in this document
Table A.1. Data for Figure 1. Mortality attributable to ground-level ozone (1984 to 2012) and
fine particulate matter (2001 to 2012), Canada
Mortality
Mortality
attributable to
Year attributable to
fine particulate
ozone
(percentage) matter
(percentage)
1984 1.88 n/a
1985 1.83 n/a
1986 1.87 n/a
1987 1.89 n/a
1988 2.13 n/a
1989 2.10 n/a
1990 1.98 n/a
1991 2.18 n/a
1992 1.88 n/a
1993 1.94 n/a
1994 2.07 n/a
1995 2.03 n/a
1996 2.08 n/a
1997 2.06 n/a
1998 2.13 n/a
1999 2.20 n/a
2000 1.95 n/a
2001 2.19 0.84
2002 2.10 0.94
2003 2.15 0.64
2004 2.11 0.80
2005 2.20 0.85
2006 2.25 0.84
2007 2.27 0.73
2008 2.25 0.63
2009 2.25 0.79
2010 2.39 0.88
2011 2.19 0.49
2012 2.26 0.64
Note: n/a = not available. Mortalities attributable to exposure to ground-level ozone or fine particulate matter are estimates of
the proportion of deaths attributable to these pollutants.
Source: Health Canada (2017) Environmental Health Science and Research Bureau, Population Studies Division.
Air health trends Page 16 of 20Table A.2. Data for Figure 2. Mortality attributable to ground-level ozone by region, Canada,
1984 to 2012
Eastern Western
Year Ontario
Canada (percentage) Canada
(percentage) (percentage)
1984 2.52 1.36 2.59
1985 2.36 1.33 2.66
1986 2.43 1.41 2.51
1987 2.49 1.30 2.86
1988 2.80 1.56 2.81
1989 2.74 1.53 3.04
1990 2.42 1.48 2.78
1991 3.02 1.53 3.00
1992 2.56 1.34 2.51
1993 2.53 1.41 2.63
1994 2.78 1.42 3.02
1995 2.71 1.41 2.88
1996 2.71 1.47 2.91
1997 2.66 1.52 2.85
1998 2.93 1.46 2.87
1999 2.89 1.62 3.01
2000 2.68 1.38 2.71
2001 2.77 1.60 3.08
2002 2.89 1.50 2.96
2003 2.89 1.61 2.92
2004 2.73 1.49 3.28
2005 2.89 1.56 3.13
2006 2.95 1.62 3.00
2007 2.87 1.71 3.12
2008 3.02 1.60 3.19
2009 2.90 1.57 3.21
2010 3.05 1.71 3.31
2011 2.99 1.54 3.16
2012 3.07 1.60 3.09
Note: The Eastern Canada region is composed of 5 urban areas; Ontario has 13 urban areas and Western Canada has
6 urban areas. For more information, please consult the Methods section. Mortality attributable to ground-level ozone exposure
is an estimate of the proportion of deaths attributable to the pollutant.
Source: Health Canada (2017) Environmental Health Science and Research Bureau, Population Studies Division.
Canadian Environmental Sustainability Indicators Page 17 of 20Table A.3. Data for Figure 3. Mortality attributable to fine particulate matter by region, Canada,
2001 to 2012
Eastern Western
Year Ontario
Canada (percentage) Canada
(percentage) (percentage)
2001 1.21 1.04 0.31
2002 1.04 1.02 0.66
2003 0.75 0.92 0.54
2004 0.82 1.03 0.48
2005 0.79 1.08 0.32
2006 0.85 1.02 0.39
2007 0.78 0.94 0.37
2008 0.77 0.82 0.29
2009 0.72 0.87 0.52
2010 0.83 1.14 0.49
2011 0.70 0.80 0.37
2012 0.57 0.87 0.49
Note: The Eastern Canada region is composed of 5 urban areas; Ontario has 13 urban areas and Western Canada has
6 urban areas. For more information, please consult the Methods section. Mortality attributable to fine particulate matter
exposure is an estimate of the proportion of deaths attributable to the pollutant.
Source: Health Canada (2017) Environmental Health Science and Research Bureau, Population Studies Division.
Table A.4. Data for Figure 4. Mortality attributable to ground-level ozone by age and sex,
Canada, 1984 to 2012
Year Age > 65 Female Male
(percentage) (percentage) (percentage)
1984 2.03 1.87 1.90
1985 2.05 1.84 1.81
1986 2.02 1.88 1.86
1987 2.04 2.02 1.81
1988 2.29 2.19 2.10
1989 2.27 2.13 2.07
1990 2.13 2.12 1.89
1991 2.31 2.26 2.11
1992 2.03 1.86 1.88
1993 2.07 1.97 1.90
1994 2.20 2.06 2.10
1995 2.24 1.99 2.06
1996 2.25 2.09 2.05
1997 2.26 2.13 1.99
1998 2.27 2.19 2.09
1999 2.39 2.18 2.23
2000 2.11 2.02 1.88
Air health trends Page 18 of 20Year Age > 65 Female Male
(percentage) (percentage) (percentage)
2001 2.39 2.17 2.19
2002 2.24 2.10 2.09
2003 2.35 2.12 2.15
2004 2.29 2.19 2.04
2005 2.39 2.22 2.18
2006 2.38 2.22 2.25
2007 2.45 2.28 2.24
2008 2.46 2.31 2.19
2009 2.44 2.27 2.21
2010 2.58 2.42 2.36
2011 2.41 2.17 2.24
2012 2.48 2.18 2.31
Note: Mortality attributable to ground-level ozone exposure is an estimate of the proportion of deaths attributable to the
pollutant.
Source: Health Canada (2017) Environmental Health Science and Research Bureau, Population Studies Division.
Table A.5. Data for Figure 5. Mortality attributable to fine particulate matter by age and sex,
Canada, 2001 to 2012
Year Age > 65 Female Male
(percentage) (percentage) (percentage)
2001 1.14 1.52 0.23
2002 1.14 1.40 0.46
2003 1.06 1.21 0.26
2004 1.05 1.25 0.40
2005 1.13 1.41 0.33
2006 1.03 1.34 0.34
2007 0.96 1.17 0.33
2008 0.90 0.97 0.37
2009 0.93 1.19 0.39
2010 1.04 1.40 0.40
2011 0.81 1.04 0.16
2012 0.94 1.04 0.33
Note: Mortality attributable to fine particulate matter exposure is an estimate of the proportion of deaths attributable to the
pollutant.
Source: Health Canada (2017) Environmental Health Science and Research Bureau, Population Studies Division.
Canadian Environmental Sustainability Indicators Page 19 of 20Additional information can be obtained at:
Environment and Climate Change Canada
Public Inquiries Centre
12th Floor, Fontaine Building
200 Sacré-Coeur boul.
Gatineau, QC K1A 0H3
Telephone: 1-800-668-6767 (in Canada only) or 819-938-3860
Fax: 819-938-3318
Email: ec.enviroinfo.ec@canada.ca
Air health trends Page 20 of 20You can also read