Air Pollution in China: Mapping of Concentrations and Sources
←
→
Page content transcription
If your browser does not render page correctly, please read the page content below
Air Pollution in China: Mapping of Concentrations and Sources

                               Robert A. Rohde1, Richard A. Muller2

Abstract

         China has recently made available hourly air pollution data from over 1500 sites,
including airborne particulate matter (PM), SO2, NO2, and O3. We apply Kriging interpolation to
four months of data to derive pollution maps for eastern China. Consistent with prior findings,
the greatest pollution occurs in the east, but significant levels are widespread across northern and
central China and are not limited to major cities or geologic basins. Sources of pollution are
widespread, but are particularly intense in a northeast corridor that extends from near Shanghai
to north of Beijing. During our analysis period, 92% of the population of China experienced
>120 hours of unhealthy air (US EPA standard), and 38% experienced average concentrations
that were unhealthy. China’s population-weighted average exposure to PM2.5 was 52 µg/m3.
The observed air pollution is calculated to contribute to 1.6 million deaths/year in China [0.7–2.2
million deaths/year at 95% confidence], roughly 17% of all deaths in China.

Introduction

         Air pollution is a problem for much of the developing world and is believed to kill more
people worldwide than AIDS, malaria, breast cancer, or tuberculosis (1-4). Airborne particulate
matter (PM) is especially detrimental to health (5-8), and has previously been estimated to cause
between 3 and 7 million deaths every year, primarily by creating or worsening cardiorespiratory
disease (2-4,6,7). Particulate sources include electric power plants, industrial facilities,
automobiles, biomass burning, and fossil fuels used in homes and factories for heating. In
China, air pollution was previously estimated to contribute to 1.2 to 2 million deaths annually (2-
4).
         In 2012, China adopted the Ambient Air Quality Standard (9), and began development of
a national Air Reporting System that now includes 945 sites in 190 cities. These automated
1
    Berkeley Earth. Email at robert@berkeleyearth.org
2
    Berkeley Earth and Dept of Physics, U. Calif. Berkeley. Email rich@berkeleyearth.org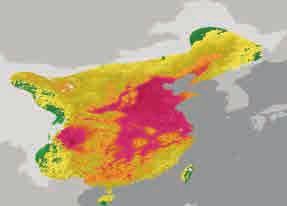
stations report hourly via the internet, and focus on six pollutants: particulate matter < 2.5
microns (PM2.5), particulate matter < 10 microns (PM10), sulfur dioxide (SO2), nitrogen dioxide
(NO2), ozone (O3), and carbon monoxide (CO). Provincial governments perform air quality
monitoring at 600 additional locations that are not yet integrated into the national system.
Previous studies of regional scale air pollution have generally relied on satellite data (10,11) or
modeling (12,13), but the high density of hourly data in China now allows regional patterns to be
constructed directly from ground observations.

Materials and Methods

       Though China deserves praise for its monitoring system and transparent communication,
most archived observations are not publicly available. To compensate, real-time data was
downloaded every hour during a four month interval from April 5, 2014 to August 5, 2014. Due
to download restrictions on the official Chinese air quality reporting system, two different third-
party sources were used: PM25.in and AQICN.org. PM25.in is a direct mirror of data from the
945 stations in China’s national network, while AQICN.org is the world’s largest aggregator of
real-time air quality data and included many additional sites in China and surrounding areas.
Nearly all of the additional data from within China originates from stations operated by
provincial environmental agencies that have not yet been incorporated in China’s national
network.
       Consistency, quality control, and validation checks were applied to the raw data prior to
further analysis in order to reduce the impact of outliers, badly calibrated instruments, and other
problems. The most common quality problem was associated with stuck instruments that
implausibly reported the same concentration continuously for many hours. A regional
consistency check was also applied to verify that each station was reporting data similar to its
neighboring stations. Approximately 8% of the data was removed as a result of the quality
control review. Further details are described in the supplemental material (Text S1).
       As little monitoring is conducted in western China (Figure 1); we will focus on China
east of 95° E, which includes 97% of the population. After removing stations with a high
percentage of missing values or with other quality control problems, this study used 880 national
network sites, 640 other sites in China and Taiwan, and 236 sites in other countries within 500
km of China (mostly South Korea). The air quality network is skewed towards urban areas,

                                                                                                      2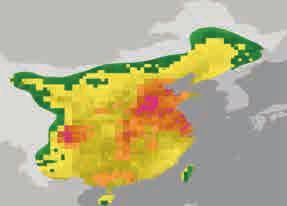
often with several sites per city and fewer, if any, in rural areas. For the n-th site, we use pn ( t )

to denote the pollutant concentration time series and pn to denote the mean pollutant
concentration.
                                                                                         Hohhot         Zhangjiakou

                                                                                                      Beijing                    Qinhuangdao

                                                                                                                    Tianjin
                                                                                               Baoding                           Dalian
                                                                  Harbin
                                                                                                                   Cangzhou
                                                                                       Shijiazhuang
           Urumqi                                          Changchun
                                                          Shenyang
                                                                                           Handan         Jinan                Weifang
                                                Beijing      Tangshan
                                        Shijiazhuang                                                                      Qingdao
                                                                                                       Jining
                              Lanzhou                                                                             Linyi
                                                 Jining       Linyi                               Zhengzhou
                                            Zhoukou                                                                 Xuzhou
                                                                   Shanghai                Zhoukou                 Huai’an
                                             Wuhan
                 Lhasa          Chongqing                                                    Nanyang        Fuyang
                                                        Wenzhou
     Chinese National                                                                                      Hefei              Nanjing
     Real−time Air Quality                  Ganzhou
                             Kunming                          Quanzhou                                                     Suzhou
     Network (N = 880)                                                                                                                    Shanghai
                                        Guangzhou                 Kaohsiung                Wuhan
     Other Real−time Air                                                                                             Hangzhou
     Quality Stations                                                                                                                     Ningbo
     (N = 640 in China)                                                       500 km

Figure 1. Map of real-time air pollution monitoring stations. Map shows the locations of air
quality monitoring sites in China and surrounding areas with sufficient hourly data to be included
in this study. Selection criteria and data sources are described in Supplemental Text S1.

         For each pollutant, a correlation vs. distance function was estimated by computing all
possible pairwise correlations between different stations and fitting the resulting correlations to a
two part exponential decay as a function of distance. The resulting functional forms are stated in
the supplemental Table S1 and shown in Figure S2 and Figure S3. The correlation functions are
used to construct correlation matrices that in turn are used to compute Kriging coefficients (14,
           !
15), K n ( x ) .
                                              !
        The interpolated pollutant field, P ( x,t ) , is then estimated in two parts.
           !           !       !
         P(x, t ) = S (x ) + A(x, t )
             ! ⎛             !
                                (         ! ⎞
                                               )        !
         S ( x ) = ⎜ ∑ K n ( x ) pn − G ( x n ) ⎟ + G ( x )
                   ⎝ n                          ⎠
             !                !
                                    (
         A(x, t ) = ∑ K n* (x, t ) pn (t ) − pn     )
                         n

                                                                                                                                                   3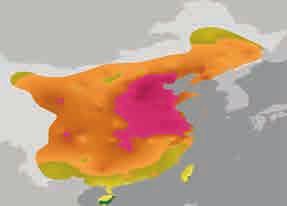
!
         The stationary part, S ( x ) , is derived by applying Kriging interpolation to the mean
                                                     !
pollutant concentrations and a global predictor, G ( xn ) , that depends on latitude and longitude

and contains free parameters that are adjusted to fit the observed means. The time-dependent
                  !
anomaly part, A ( x,t ) , depends only on the fluctuations at each station relative to the local mean,
                                     !
and its Kriging coefficients, K n* ( xn ,t ) , are computed with restriction to stations that are active at

time t. This two-step process reduces errors associated with stations that have intermittently
missing data. This method is similar to that used by Berkeley Earth for its historical earth
temperature analysis (16). Since the correlation vs. distance function has been constructed with
the correlation at zero distance obtaining a value less than one, the resulting interpolated fields
will be smoother than the original data. This design was chosen for its ability to compensate for
noise in the underlying station measurements. Additional details of the interpolation process are
provided in the supplement methods (Text S1).
         For mapping and computation, this continuous field was sampled with an approximately
6 km resolution, though in practice, the characteristic size of resolvable features is often larger
(e.g. 30 km) and varies with station density and noise.
                                                   !
        A simple estimate of pollutant fluxes, F ( x,t ) , was computed by comparing observed
changes in the hourly pollutant concentration to the concentrations expected due to short-term
                ! !
wind transport v ( x,t ) and an exponential decay with lifetime τ . Differences from the simple

transport and decay model are assumed to represent source fluxes.
                       ! ! !                                   !         !                    ! ! !
           !         P(x + v (x, t ) Δt, t + Δt ) − e − Δt τ P(x , t ) P(x , t ) − e − Δt τ P(x − v (x, t ) Δt, t − Δt )
        F (x , t ) =                                                  +
                                         2 Δt                                                 2Δt
         The near-surface (80 m) wind field from the Global Forecast System (17) was used for
this calculation, and the effective pollutant lifetime was estimated as described in supplemental
Text S1 and reported in Table S4. Flux averages were computed by time-averaging the resulting
field after excluding outlying values and cells affected by rain events as determined from
Tropical Rainfall Measuring Mission data (18, 19).
         The change in mortality due to PM2.5 air pollution was calculated by adopting the
integrated exposure response function approach (20) which considers relative risk of death for
five disease classes (stroke, ischemic heart disease, lung cancer, chronic obstructive pulmonary
disease, and lower respiratory infection) and which was adopted by World Health Organization

                                                                                                                           4
(WHO) for the Global Burden of Disease study (21). The model incorporates non-linear
response versus concentration and provides an estimate of uncertainty. Relative risk was
calculated at the prefecture level using local average PM2.5 concentration. The data for different
diseases and prefectures was then combined to construct national average mortality estimates.
       Additional details of these calculations and associated background information is
provided in the supplemental methods document (Text S1).

Results

       Figure 2 shows a time series of PM2.5 concentration at Beijing and interpolated maps at
three time points separated by 6 hours each. This shows the volatile nature of air pollution and
the role of weather patterns in redistributing pollution on short timescales. Our approach creates
a smooth field that approximates the data at each station, but allows a degree of difference
attributable to noise. The pollution is extensive and rapidly evolves in response to winds and
other atmospheric conditions. In the Figure, fresh air from the North displaces a period of heavy
pollution. Hourly data allows us to capture this evolution and ultimately estimate source fluxes.
Supplemental Movie S3 shows the time evolution of PM2.5 across the entire country.
       Figure 3 presents averages of the interpolated data for PM2.5, PM10, and O3 across the
study duration. The maps are color-coded based on US EPA health categories for 24-hour
exposure (22). Maps for SO2 and NO2 are included in the supplemental materials and show
“good” levels nearly everywhere (Figure S11, S13).
       Air pollution is extensive in China, with the highest particulate concentrations observed
south of Beijing (e.g. Xingtai / Handan), but significant levels extend throughout the interior,
which is consistent with previous satellite and modeling estimates (11-13). Extensive pollution
is not surprising since particulate matter can remain airborne for days to weeks and travel
thousands of kilometers. The corridor south of Beijing contains the highest pollution
concentrations and, as discussed below, many of the largest sources. During this study, the
southern coastal area experienced somewhat better air quality, possibly linked to greater rainfall
(Figure S5).

                                                                                                     5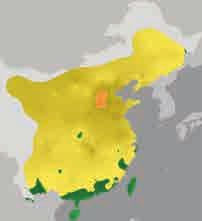
300
 (µ g/m )
                250
       3

                                                                                                                                           300
                200
         2.5

                150
   Beijing PM

                100                                                                                                                        250

                                                                                                                                                 Concentration (µ g/m3)
                 50

                  0                                                                                                                        200
                      April 1                   May 1                      June 1             July 1                          August 1

                20 km            May 19, 14:00 UTC                        May 19, 20:00 UTC                      May 20, 02:00 UTC
                                                                                                                                           150

                                                                                                                                                                  2.5
                                                                                                                                                      PM
                                                                                                                                           100

                       Beijing                                  Beijing                                Beijing

                         Langfang                                 Langfang                               Langfang                          50

                                    Tianjin                                  Tianjin                                Tianjin

                 Baoding                                  Baoding                               Baoding                                    0

                                                                          Unhealthy for                                Very
     Health Category:                    Good        Moderate                                 Unhealthy                                  Hazardous
                                                                          Sensitive Groups                             Unhealthy

Figure 2. Time evolution of PM2.5 pollution in the vicinity of Beijing. (Top) Time series of
PM2.5 concentration at Beijing extracted from the interpolated field. Red circles indicate times
shown in bottom row. (Bottom) Maps of interpolated PM2.5 concentration during a period of
high pollution. Pollution concentrations were computed as described in the text from hourly data
and maps were rendered in MATLAB. Concentrations are shown using color gradients and
contour lines, where color tones (green, yellow, etc.) correspond to health impact categories
defined by the US EPA. Bold circles show station locations with the observed value at each
station indicated by the color within the circle.

                                                                                                                                                                          6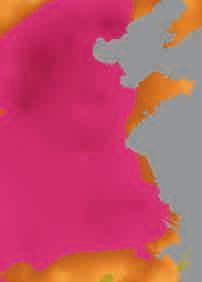
Harbin                                                  Harbin                                                      Harbin

                                             Shenyang                                                Shenyang                                                    Shenyang
                      Beijing                                                Beijing                                                      Beijing
                                           Dalian                                                  Dalian                                                    Dalian

 Lanzhou            Handan                               Lanzhou           Handan                                    Lanzhou            Handan
                                     Linyi                                                   Linyi                                                       Linyi
                  Zhoukou                                                Zhoukou                                                      Zhoukou

                          Yichang          Shanghai                              Yichang           Shanghai                                   Yichang        Shanghai
  Chongqing                                               Chongqing                                                   Chongqing
                           Wenzhou                                                 Wenzhou                                                     Wenzhou
       Guiyang                                                Guiyang                                                      Guiyang
                                     Quanzhou                                                Quanzhou                                                    Quanzhou
           Guangzhou                                               Guangzhou                                                   Guangzhou

          Beijing     Qinhuangdao                                Beijing     Qinhuangdao                                      Beijing     Qinhuangdao

                          Tianjin                                                Tianjin                                                      Tianjin
  Baoding                                    Dalian       Baoding                                    Dalian           Baoding                                    Dalian

         Shijiazhuang                                           Shijiazhuang                                                 Shijiazhuang

         Handan           Weifang                               Handan           Weifang                                     Handan           Weifang

                                               Qingdao                                                 Qingdao                                                     Qingdao

                          Linyi                                                  Linyi                                                        Linyi
      Zhengzhou                                              Zhengzhou                                                    Zhengzhou
                          Xuzhou                                                 Xuzhou                                                       Xuzhou
          Zhoukou          Huai’an                               Zhoukou           Huai’an                                    Zhoukou          Huai’an
       Fuyang                                                 Fuyang                                                       Fuyang

                                     Nanjing                                                 Nanjing                                                     Nanjing
                  Hefei                                                  Hefei                                                        Hefei

                                       Shanghai                                                Shanghai                                                    Shanghai
        Wuhan                                                  Wuhan                                                        Wuhan
                               Hangzhou                                              Hangzhou                                                     Hangzhou

  0                       50                    100      0          50           100           150            200     0        20          40     60                80
                                       3                                                       3                                          O (ppb)
                  PM         (µg / m )                                   PM        (µg / m )                                                  3
                       2.5                                                    10

                                                                                                                    Unhealthy for
  Health Category:                           Good                          Moderate                                                                         Unhealthy
                                                                                                                    Sensitive Groups

       Figure 3. Average air pollution maps. Maps of average pollutant concentration for
PM2.5, PM10, and O3 for eastern China (top row) and the Beijing to Shanghai corridor (bottom
row). Concentrations are shown using color gradients and contour lines; the colors (green,
yellow, etc.) represent US EPA qualitative health impacts. Pollution concentrations were
computed as described in the text using hourly data and then the hourly concentration fields were
averaged over the four month study duration.

           For PM2.5, portions of China encompassing roughly 38% of the population are classified
as “unhealthy” on average (>55 µg/m3, red) with an additional 45% of the population averaging
“unhealthy for sensitive groups” (>35 µg/m3, orange). Almost none of the study area averaged

                                                                                                                                                                             7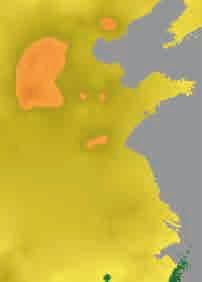
below the US EPA’s 12 µg/m3 standard for annual average PM2.5 exposure (green). The area-
weighted average was 46 µg/m3 and the population-weighted average exposure to PM2.5 was 52
µg/m3. 92% of China’s population experienced unhealthy PM2.5 for at least 120 hours during the
study period. 46% of China’s population experienced PM2.5 above the highest EPA threshold
(“hazardous”, >250 µg/m3), during at least one hour in the observation period.
Patterns for PM10 are similar but less severe, with average PM10 levels “moderate” for
most of China. Ozone concentrations are modest across most of China, though higher levels
occur in the Northwest desert area, and in a small number of Northeastern cities. Though the
average levels of PM10 and O3 are “moderate” or “good” for much of China, intermittently high
levels of these pollutants can occur in some areas.
Source Regions for Air Pollution in China
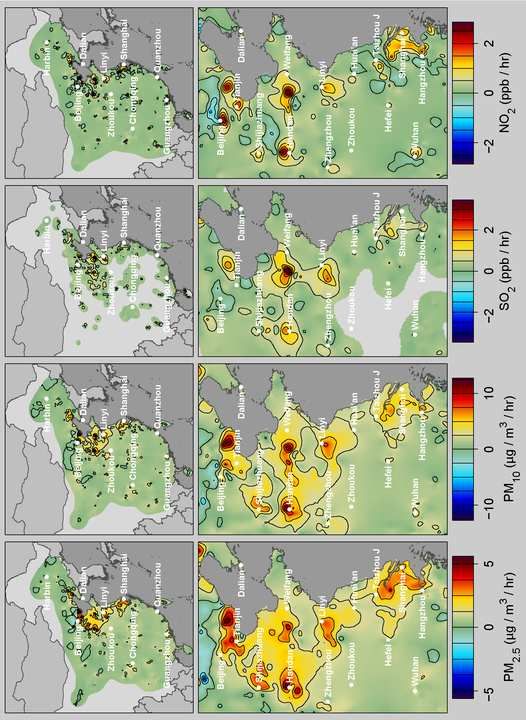
Figure 4 shows estimated pollutant fluxes for PM2.5, PM10, SO2, and NO2. Pollution
emission is often localized, especially in the Beijing to Shanghai corridor where many of the
highest PM concentrations also occur (Figure 3). Most of the largest emissions appear in or near
urban areas (e.g. Handan, Shijazhuang, Zibo, Tangshan, Linyi, Hangshou), though not all major
cities have high pollution fluxes (e.g. Chongqing, Chengdu, Wuhan). The source map
presumably reflects patterns of industrial activity, though detailed differences will not be
explored here.
NO2 and SO2 emissions help suggest the pollution source. Nitrogen oxides, including
nitric oxide (NO) and NO2 are created when air is heated, and on average have been attributed to
transportation fuels (15-25%), fossil fuel burning in power plants (30-50%), and to industrial
facilities (25-35%) (23,24). It is expected that NO dominates at the combustion source, but in
the presence of sunlight NO and NO2 will equilibrate within a few minutes (as well as reacting
with O3), implying that NO2 measurements reflect a combination of NO and NO2 emissions.
SO2 emissions have been previously associated with coal (~90%) in power plants and industrial
facilities (25). Beijing has negligible SO2 flux, despite a large NO2 signal, possibly a result of
policies that limit coal burning in the immediate vicinity of Beijing and more extensively apply
mitigation technologies.
8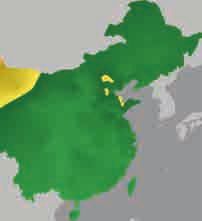
Figure 4
Click here to download high resolution image

        Figure 4. Air pollution source maps. Maps of average pollutant flux for PM2.5, PM10, SO2,
       and NO2 for eastern China (top row) and the Beijing to Shanghai corridor (bottom row).
       Pollutant fluxes were computed as described in the text from changes in the interpolated hourly
       pollution fields along with contemporaneous wind and weather data. Due to sparse sampling and
       secondary transformations of pollutants in the atmosphere, apparent source fluxes are likely to
       appear more diffuse than the true emissions source.

                   Many of the SO2 and NO2 sources are also sources of PM pollution. This is not
       surprising since fossil fuel burning is also a major source of PM2.5 and PM10. However, the PM
       sources appear more diffuse than either the SO2 or NO2 sources. In part, this is caused by
       secondary particulate matter formed within the atmosphere from other pollutants, such as SO2 or
       NO2 (26). Secondary particulate formation may cause PM fluxes to appear more widely
       distributed than the underlying emitters. Nonetheless, many strong PM sources are identified
       through this analysis. Within the study region, 10% of the area is responsible for 34% of the
       PM2.5 emissions, and 5% of the area is responsible for 22% of emissions. However, small and

                                                                                                        9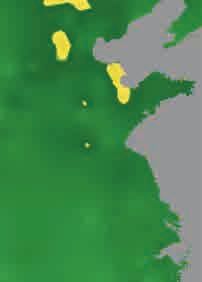
moderate sources are also important. Approximately 37% of the study region had PM2.5 fluxes
>0.5 µg/m3/hr, sufficient to exceed US EPA standards after only 3 days of stagnant air.

Discussion
       We have presented a technique for mapping air pollution concentrations and sources
using data from monitoring stations. As has been known from satellite and modeling studies,
particulate pollution is an extensive problem affecting nearly all of China’s population, but the
observed heterogeneity of source locations could help develop strategies to reduce pollution.
       We examined a four month interval as long-term station data were not available for most
of China. Previous studies of both in situ and satellite data have indicated that winter and early
spring months in China have somewhat higher PM concentrations due to increased use of fossil
fuels for seasonal heating, weather patterns that concentrate pollution at low altitudes, and
increased desert dust fluxes (12, 27). In contrast, the air in China is typically cleanest from late
summer to early fall. The April 5 to August 5 study period is somewhat intermediate. A review
of hourly PM2.5 station data from Beijing (2009-2014), Shanghai (2012-2014), Guangzhou
(2012-2014), Chengdu (2013-2014), and Shenyang (2014) indicates that the months studied in
this paper averaged 91%, 84%, 89%, 72%, and 73% respectively of the annual averages (U.S.
Air Quality Monitoring Program, http://www.stateair.net/web/mission/1/). Monthly-resolved
PM2.5 satellite data for the whole study region was not immediately available, but a monthly
satellite history for Beijing reported that April-July averaged 99% of the annual mean during
2000 to 2012 (28). Hence, particulate pollution estimates drawn from the current short study
period will likely be similar to or somewhat lower than long-term averages. Future work could
explore seasonal variations and long-term trends.
       During the four months studied, the population-weighted and area-weighted PM2.5
averages were 52 and 46 µg/m3 respectively. Satellite pollution datasets generally focus on
annual or multi-year averages, which limits the ability to make direct comparisons. However,
the available satellite estimates tend to be similar to or somewhat lower than the ground
observations. An analysis of the larger East Asia region estimated a population-weighted PM2.5
exposure of 50 µg/m3 for 2001 to 2010 (28). A version of the same dataset masked to the current
study region had an area-weighted average of 40 µg/m3 from 2010 to 2012 (28, 29). A different
satellite estimate using similar observations but different calibrations and modeling gave 25

                                                                                                       10
µg/m3 for the 2008 to 2010 average over the present study region (30, 31). Both of these datasets
show similar spatial patterns to what we observe (Figure 5), though the magnitudes in van
Donkelaar et al.’s work (28) are clearly more consistent with our ground data estimates. As
noted in previous satellite to in situ comparisons, satellite data may be more likely to
underestimate pollution concentrations during the most extreme pollution events (28, 32).
The conversion of pollution concentrations to mortality is complicated. We adopt the
framework (20) developed for the WHO Global Burden of Disease study (21) that considers
PM2.5 mortality due to impacts on five distinct diseases and accounts for nonlinearities as a
function of concentration. Using prefecture level population and pollution data along with
national average death rates for the five modeled diseases, we calculate that 1.6 million deaths /
year can be attributed to PM2.5 air pollution under the WHO model [95% confidence: 0.7 to 2.2
million deaths/year]. This is equivalent to 4 thousand deaths / day or 17% of all deaths in China.
Additional details appear in the supplemental Text S1 and Table S2. For perspective, the
categories of mortality events considered by the WHO model, e.g. cardiorespiratory deaths,
account for roughly 55% of all Chinese deaths (21). This compares to only 42% of mortality in
the United States in the same cardiorespiratory categories, despite much higher incidence of
obesity in the United States (21). The calculated mortality is somewhat higher than the 1.2
million deaths/year previously estimated from the Huai River study using Chinese air pollution
measurements and mortality data (3,4,33).
Though most of China is subject to potentially harmful levels of PM2.5, some large
population centers (Chongqing, Wuhan, Chengdu) emit less than half the PM2.5 of others. Among
northeastern cities, Beijing has relatively low emissions except for NO2. Low SO2 fluxes may
indicate cities that benefit from lower coal usage or better smokestack pollution controls.
Compared to natural gas, coal produces 150 to 400 times more PM for the same energy delivered
(34,35). China has plans for new coal plants in the next decade that could effectively double
their coal consumption (36), potentially exacerbating the problem of air pollution. A table of
pollution concentrations and fluxes by province and prefecture is included in the supplemental
material (Table S2).
The methods of this study should be applicable to air quality monitoring in other regions
of the world. However, these techniques require an extensive air-quality monitoring network
with frequent updates (e.g. hourly), and such networks presently exist in only a few places. We
11hope that other countries will follow China’s lead and provide both extensive and transparent
real-time air quality monitoring.
Figure 5
Click here to download Figure: Fig5.eps Figure 5. Comparison of PM2.5 observations
This study, Ground Data, April−August 2014 to satellite data. Maps of average PM2.5
concentration from this study (top) and two
satellite-derived datasets restricted to the same
region. The average over the 2008 to 2010 time
interval was chosen for the satellite data due to
the limitations of the available satellite data.
Both the concentrations reported by van
Donkelaar (28) (middle) and those reported by
de Sherbinin (30) (bottom) rely on similar
satellite observations of aerosol optical depth
(obtained by NASA),, but interpret those
observations differently when determining
van Donkelaar et al., Satellite, 2008−2010
pollutant concentration. The satellite-derived
data was imported from concentration data files
provided by their respected sources and rendered
via MATLAB to use the same US EPA health
category color scheme applied in Figure 2 and 3.
de Sherbinin et al., Satellite, 2008−2010
0 50 100
PM Concentration (µ g / m3)
2.5
12Acknowledgments
We thank Elizabeth Muller for suggesting this study, Steve Mosher and Zeke Hausfather
for discussion and feedback, and John Li and Xinyu Zhang for help with Chinese materials.
References
1. World Health Organization (2014) WHO methods and data sources for global causes of
death 2000-2012. Global Health Estimates Technical Paper WHO/HIS/HSI/GHE/2014.7.
Available: http://www.who.int/entity/healthinfo/global_burden_disease/
GlobalCOD_method_2000_2012.pdf
2. World Health Organization (2012) Burden of disease from the joint effects of Household and
Ambient Air Pollution for 2012. WHO Technical Report. Available:
http://www.who.int/phe/health_topics/outdoorair/databases/AP_jointeffect_BoD_results_Ma
rch2014.pdf
3. O’Keefe B (2013) Recent Trends in Air Quality Standards in Europe and Asia: What’s next?
HEI Annual Conference 2012. Available: www.healtheffects.org/Slides/AnnConf2013/
OKeefe-Sun.pdf
4. Yang G, Wang Y, Zeng Y, Gao GF, Liang X, et al. (2013) Rapid health transition in China,
1990–2010: findings from the Global Burden of Disease Study 2010. Lancet 381: 1987–
2015.
5. Dockery DW, Pope CA, Xu X, Spengler JD, Ware JH et al. (1993) An association between
air pollution and mortality in six U.S. cities. N Engl J Med 329(24), 1753–1759.
6. Pope CA, Burnett RT, Thun MJ, Calle EE, Krewski D, et al. (2002) Lung cancer,
cardiopulmonary mortality, and long-term exposure to fine particulate air pollution. JAMA
287(9): 1132–1141. doi:10.1001/jama.287.9.1132. PMID 11879110.
7. Hoek G, Krishnan RM, Beelen R, Peters A, Ostro B, Brunekreef B, Kaufman JD (2013)
Long-term air pollution exposure and cardiorespiratory mortality: a review. Env. Health.
12:43.
8. Beelen R, Raaschou-Nielsen O, Stafoggia M, Andersen ZJ, Weinmayr G (2013) Effects of
long-term exposure to air pollution on natural-cause mortality: an analysis of 22 European
cohorts within the multicentre ESCAPE project. Lancet 383(9919): 785-795.
9. Government of China. (2012) Ambient Air Quality Standards (in Chinese). GB 3095-2012.
Available: http://kjs.mep.gov.cn/hjbhbz/bzwb/dqhjbh/dqhjzlbz/201203/
W020120410330232398521.pdf
10. Zhang Q, Geng GN, Wang SW, Richter A, He KB. (2012) Satellite remote sensing of
changes in NOx emissions over China during 1996–2010. Chinese Sci. Bull. 57(22): 2857-
2864. DOI:10.1007/s11434-012-5015-4.
11. Wang J, Xua X, Spurr R, Wang Y, Drury E. (2010) Improved algorithm for MODIS satellite
retrievals of aerosol optical thickness over land in dusty atmosphere: Implications for air
quality monitoring in China. Remote Sensing Env. 114: 2575–2583.
1312. Liu X-H, Zhang Y, Cheng S-H, Xing J, Zhang Q, et al. (2010) Understanding of regional air
pollution over China using CMAQ, part I: performance evaluation and seasonal variation.
Atmos. Env. 44(20): 2415-2426.
13. Lei Y, Zhang Q, He K, Streets D. (2011) Primary anthropogenic aerosol emission trends for
China, 1990–2005. Atmos. Chem. Phys. 11, 931–954.
14. Schabenberger O, Gotway CA. (2004) Statistical Methods for Spatial Data Analysis. CRC
Press. ISBN 020349198X.
15. Krige DG. (1951) A statistical approach to some basic mine valuation problems on the
Witwatersrand. J Chem Metall Min Soc S Afr. December: 119-159.
16. Rohde RA, Muller RA, Jacobsen R, Perlmutter S, Rosenfeld A, et al. (2013) Berkeley Earth
Temperature Averaging Process. Geoinfor Geostat: An Overview 1(2)
doi:10.4172/gigs.1000103.
17. NOAA/NCEP. Global Forecast System (GFS) Atmospheric Model. (2012;
www.ncdc.noaa.gov/data-access/model-data/model-datasets/global-forcast-system-gfs)
18. Huffman GJ, Bolvin DT, Nelkin EJ, Wolff DB, Adler RF, et al. (2007) The TRMM Multi-
satellite Precipitation Analysis: Quasi-global, multi-year, combined-sensor precipitation
estimates at fine scale. J. Hydrometeor. 8(1), 38-55.
19. Huffman GJ, Bolvin DT. (2011) Real-Time TRMM Multi-Satellite Precipitation Analysis
Data Set Documentation. NASA/GSFC Laboratory for Atmospheres, 43 pp. Available:
ftp://meso.gsfc.nasa.gov/pub/trmmdocs/rt/3B4XRT_doc.pdf.
20. Burnett RT, Pope CA III, Ezzati M, Olives C, Lim SS, Mehta S, Shin HH, Singh G, Hubbell
B, Brauer M, Anderson HR, Smith KR, Balmes JR, Bruce NG, Kan H, Laden F, Prüss-Ustün
A, Turner MC, Gapstur SM, Diver WR, Cohen A. (2014) An integrated risk function for
estimating the global burden of disease attributable to ambient fine particulate matter
exposure. Environ Health Perspect 122:397–403; http://dx.doi.org/10.1289/ehp.1307049
21. Naghavi M, Wang H, Lozano R, Davis A, Liang X, Zhou M, et al. (2015) Global, regional,
and national age–sex specific all-cause and cause-specific mortality for 240 causes of death,
1990–2013: a systematic analysis for the Global Burden of Disease Study 2013. The Lancet
385 (9963): 117–171.
22. US EPA. Air Quality Index: A Guide to Air Quality and Your Health. U.S. EPA Report
EPA-456/F-14-002. Available: http://www.epa.gov/airnow/aqi_brochure_02_14.pdf
23. Emission Database for Global Atmospheric Research (EDGAR), release 4.2. Available:
http://edgar.jrc.ec.europe.eu
24. Shi Y, Xia Y, Lu B, Liu N, Zhang L, et al. (2014) Emission inventory and trends of NOx for
China, 2000–2020. J. Zhejiang Univ.-SCIENCE A 15(6):454-464.
25. Lu Z, Zhang Q, Streets D (2011) Sulfur dioxide and primary carbonaceous aerosol emissions
in China and India, 1996–2010. Atmos. Chem. Phys. 11, 9839–9864.
26. Davidson C, Phalen R, Solomon P. (2005) Airborne particular matter and human health: a
review. Aerosol Sci. Technol. 39, 737-749.
27. Zhang W-J, Sun Y-L, Zhuang G-S, Xu D-Q. 2006. Characteristics and Seasonal Variations
of PM2.5, PM10, and TSP Aerosol in Beijing. Biomedical and Environmental Sciences 19:
461-468.
1428. van Donkelaar A, Martin RV, Brauer M, Boys BL (2015) Global fine particulate matter
concentrations from satellite for long-term exposure assessment, Environmental Health
Perspectives, DOI:10.1289/ehp.1408646.
29. Boys BL, Martin, RV, van Donkelaar A, MacDonell R., Hsu NC, Cooper MJ, Yantosca RM,
Lu Z, Streets DG, Zhang Q, Wang S, Fifteen-year global time series of satellite-derived fine
particulate matter, Environ. Sci. Technol, 10.1021/es502113p, 2014.
30. de Sherbinin A, Levy M, Zell E, Weber S, Jaiteh M. 2014. Using Satellite Data to Develop
Environmental Indicators. Environmental Research Letters 9 (8): 084013.
http://dx.doi.org/10.1088/1748-9326/9/8/084013.
31. Battelle Memorial Institute, and Center for International Earth Science Information Network
- CIESIN - Columbia University. 2013. Global Annual Average PM2.5 Grids from MODIS
and MISR Aerosol Optical Depth (AOD). Palisades, NY: NASA Socioeconomic Data and
Applications Center (SEDAC). http://dx.doi.org/10.7927/H4H41PB4.
32. Song W, Jia H, Huang J, Zhang Y. 2014. A satellite-based geographically weighted
regression model for regional PM2.5 estimation over the Pearl River Delta region in China.
Remote Sensing of Env. 154: 1-7.
33. Chen Y, Ebenstein A, Greenstone M, Lie H. (2013) Evidence on the impact of sustained
exposure to air pollution on life expectancy from China’s Huai River policy, Proc US NAS
110(32): 12936–12941.
34. Cai H, Wang M, Elgowainy A, Han J. (2012) Updated Greenhouse Gas and Criteria Air
Pollutant Emission Factors and Their Probability Distribution Functions for Electric
Generating Units. Argonne National Laboratory ANL/ESD/12-2.
35. US Energy Information Agency (1998) Natural Gas 1998, Issues and Trends. US EIA
Report DOE/EIA-0560(98). Available:
http://www.eia.doe.gov/oil_gas/natural_gas/analysis_publications/
natural_gas_1998_issues_and_trends/it98.html.
36. Yang A, Cui Y. (2012) Global Coal Risk Assessment: Data Analysis and Market Research.
World Resources Institute Working Paper. Available:
http://pdf.wri.org/global_coal_risk_assessment.pdf.
15You can also read