Air Quality Action Plan - Oxford City Council Building a world-class city for everyone
←
→
Page content transcription
If your browser does not render page correctly, please read the page content below
Oxford City Council
Air Quality Action Plan
2021-2025
In fulfilment of Part IV of the Environment Act 1995 Local Air Quality Management
January 2021

Building a world-class city for everyone
Foreword
                 Striving for 30 by 25
                 We all have a right to breathe clean air. However, harmful levels of air pollution are harming
                      people’s health, damaging our quality of life, and cutting lives short. The poorer and more
                          disadvantaged people in our country are disproportionately affected, facing shortened
                            lives and lifelong health problems. Air pollution is, at its heart, a social justice issue.

                                 With our measures we have reduced the main pollutant of concern by 26% over the
                                 last seven years. We need to go further and faster to clean air.

                                   Oxford City Council is setting a new Air Quality Action Plan (AQAP) which, for the
                                  first time, sets a target for the reduction of air pollution. We believe that it is the
                                 first time any UK local authority has set a city-wide air pollution reduction target
                               through its AQAP. By setting a strict target through the preparation of our AQAP (that
                             is, by discharging our statutory duty) we make the case for clean air, public health, and
                           social justice.

                 37 of Britain’s 43 air quality zones are exceeding the legal limits for the main harmful pollutant of
                 concern. Our action plan moves Oxford beyond the focus upon achieving local compliance, which
                 is an issue for so many action plans for many authorities. We are choosing to set a target which is
                 significantly stricter than the legal target.

                 We have been calling on Government to meet their legal responsibilities and, instead of simply
                 highlighting problems, we have proposed ten solutions in the development of Oxford’s Charter
                 for Cleaner Air—the first formal cooperation of its kind between a local authority, Greenpeace UK
                 and Friends of the Earth. We have called on the Government to tighten the legal target; now we are
                 setting our own tighter target.

                 By 2025 Oxford will have met legal compliance in the four historic air pollution hotspots that
                 remain today. We will have achieved legal levels across the whole city and met our nitrogen oxide
                 target of “30 by 25”.

                 The founding document of the modern social security state made suggestions aimed at eradicating
                 the five “giant evils”. One evil identified by the report was “disease”, yet today air pollution blights
                 our neighbourhoods just as it did when Clement Attlee’s government enacted the recommendations
                 of Sir William Beveridge. We need to bring air pollution to the lowest and safest possible levels and
                 that means even bigger interventions from the level of government nearest to our communities.

                 Cllr Tom Hayes
                 Deputy Leader and Cabinet Member for Green Transport and Zero Carbon Oxford

II   Oxford City Council   Air Quality Action Plan        2021-2025
Executive Summary
This Air Quality Action Plan (AQAP) has been produced as part of our statutory duties required
by the Local Air Quality Management framework. It outlines the actions we will take to improve
air quality in Oxford City from 2021 to 2025. It also fits within and furthers our wider ambitions to
improve air quality, health, and climate.

The key objective of this AQAP is to bring NO2 emissions into legal compliance as soon as possible.
However, we also want to reach beyond legal compliance for the whole city. Oxford City Council is
committing to becoming the first UK Local Authority to set a local annual mean NO2 target in a city-
wide AQAP. The overall objective of this AQAP for the whole of the Oxford City areai is to:

               Achieve a local annual mean NO2 target of 30 µg/m3 by 2025
                                                   “30 by 25”
The legal annual mean limit value for NO2 is 40 ug/m3. Research now shows that this legal limit is
not a safe limit. Several health studies show that harmful effects of air pollution are seen at levels
below air quality legal standards that were previously considered to be safe. We take the health
of our residents and visitors very seriously and the decision to set a new low target for NO2 is
evidence of our commitment to improve health outcomes for all.

According to the Committee on the Medical Effects of Air Pollutants (COMEAP), a 1 µg/m3 reduction
in NO2, could lead to about 420,000 to 903,000 life years saved in the UK over the next 106 years,
associated with an increase in life expectancy (at birth) of around 2 to 5 days. It is therefore
expected that a 10 µg/m3 reduction in NO2 will lead to a significant improvement in the health
outcomes for Oxford residents.

We want to achieve the lowest possible air pollution levels which means Oxford City Council will go
beyond the legal limit. This commitment is consistent with Oxford’s record of leading by example
and the ambition of implementing innovations aimed at reducing air pollution levels in the cityii.

The 30ug/m3 target is determined by our analysis of several air quality modelling projections. It
is intended to be stretching but within the boundaries of possibility. Without the delivery of key
schemes such as the Oxford Zero Emission Zone and Connecting Oxford, we are unlikely to meet the
local target. While the City Council is setting this target for the whole city, in no way can we achieve
it on our own. To be able to meet this target, we have developed a set of 30 actions and measures
that we will deliver together with our partners and which sit within four priority areas of intervention:

A.     Developing partnerships and public education;
B.     Support for the uptake of Low and Zero emission vehicles;
C.     Reducing emissions from domestic heating, industry and services;
D.     Reduce the need to travel, explore opportunities for mode shift and increase the uptake of
       sustainable transport.

  i     The new local NO2 target will apply to all locations in Oxford (hence to be compliant all areas of Oxford must
        meet the target – it is not a mean value), and will be assessed annually through Oxford City Council’s extensive
        air quality monitoring network, using diffusion tubes and automatic monitoring. The monitoring network will
        prioritise locations in the city where there is relevant human exposure to air pollution.
  ii    Oxford was the first city in the UK to implement Park & Ride schemes (1973), the first city in the UK (outside
        London) to implement a Low Emission Zone (LEZ) for buses (2014), and the first city in the UK to develop plans to
        implement a Zero Emission Zone (2017).

                                                                                                                            1
The complete list of the 30 actions is available in Table 5. Oxford City Council’s main priorities
                for the period 2021-2025 are focused on the delivery of two major schemes which have been
                developed to tackle road traffic emissions and the dominance of the car on our roads: Oxford’s
                Zero Emission Zone (ZEZ) and Connecting Oxford. The new AQAP will principally seek to build upon
                these proposals and identify new measures to complement and link them together. It is felt that
                by supporting and building on ambitious proposals, tangible improvements in air quality can be
                achieved more quickly and at greater scale. The ZEZ and Connecting Oxford are being delivered in
                partnership with Oxfordshire County Council.

                Emissions are about more than nitrogen oxides (NOx), we are also concerned about particulate
                matter (PM). While the city of Oxford is exceeding legal limits for NO2, it is currently fully compliant
                with legal limits, as well as World Health Organisation (WHO) advisory limits for PM10 and PM2.5.
                Historical analysis of our air quality data shows that we have seen an overall decline in air
                pollution, with a reduction of 26% in NO2, 31% in Particulate Matter (PM10) and 36% in Particulate
                Matter (PM2.5) at sites where air quality monitoring has been in place since 2013. However, new
                and emerging studies are indicating that there is no safe level for air pollution. Critically, there is
                now clear evidence that particulate matter has an impact on human health, including premature
                mortality, allergic reactions, and cardiovascular diseases. Oxford City Council considers that the
                actions outlined in this AQAP will also contribute to reducing levels of particulate matter.

                The case for clean air
                This is the right moment to set out a new action plan. We have an opportunity to achieve cleaner
                air as we recover from the COVID-19 crisis. Action on air pollution has never been more important
                because, in addition to the annual burden of disease and deaths caused by air pollution, it also
                looks to be making us more vulnerable to the impacts of COVID-19.

                Long-term exposure to air pollution is associated with increased morbidity and chronic diseases,
                some of which have been identified as increasing the risk of severe COVID-19 symptoms. Given this,
                it would not be surprising if there was a link between exposure to air pollution and the occurrence
                or severity of COVID-19 infection, but as off writing there is no clear evidenceiii of this or of the
                magnitude of any effect.

                Air pollution also strongly impacts global economy. Recent researchiv clearly shows that cleaner air
                could annually boost the economy by £1.6 billion. Cleaner air would save 17,000 premature deaths
                and prevent the loss of 3 million working days for businesses, with workers currently becoming ill
                or having to take time off to care for sick children because of air pollution.

                Air pollution particularly affects the most vulnerable: children and older people, and those with
                heart and lung conditions. Over 40,000 people die prematurely each year because of poor air
                quality in the UK. Air quality has significant impacts on health and is linked to several serious

                  iii The Air Quality Expert Group (AQEG) issued a rapid review in June 2020 on the estimation of changes in air pollution
                      emissions, concentrations and exposure during the COVID-19 outbreak in the UK. The document acknowledges
                      that there is some evidence to suggest that nitrogen dioxide (NO2), particulate matter (PM) and ozone (O3) may
                      increase susceptibility to respiratory infections or worsen disease prognosis, although it recognises that there
                      are still insufficient studies or mixed evidence for specific combinations of endpoints, infection types, age groups
                      or pollutants . Studies of the associations of COVID-19 disease with both past and contemporary air pollution
                      exposure are also limited by an, as yet, incomplete understanding of the factors controlling the transmission and
                      progression of the disease, and especially individual risk factors.
                  iv   “Breathing Life into the UK economy” is a report from CBI Economics, commissioned by the Clean Air fund, which
                       quantifies the economic benefit to the UK of meeting WHO Air Quality guidelines.

2   Oxford City Council   Air Quality Action Plan                2021-2025
health conditions such as cancer, strokes, and heart disease. The impact of early exposure to poor
air quality has lifetime effects, such as high rates of obesity, asthma, and low lung function. Air
pollution harms our health, our economy, and our quality of life.

There is an increased salience as people have realised that clean air is possible and want it to stay.
During the COVID-19 lockdown, levels of NO2 air pollution dropped by 20-30% across the UKiii –
primarily from a significant reduction in private car use. During the first couple of months of the
lockdown, Oxford saw significant reductions of air pollution in the city; up to a 60%v reduction in
Nitrogen Dioxide (NO2), with levels at the lowest ever recorded in the city since monitoring began.
People have noticed and appreciated the cleaner air and safer streets.

A recent survey of Oxford residents showed clear support for action to reduce motorised traffic to
make the city more cycle and walking friendly. During lockdown millions of people have changed
their routines in ways that reduced air pollution by working from home and walking and cycling
more. Many are willing to continue to do so. It is easier to maintain a habit than foster a new one,
so we want to build on this unique moment to create lasting change.

There is a positive shift in priorities nationally when it comes to our environment and air quality.
Across the country we are seeing a reallocation of road space to more active modes of travel with
more people walking and cycling. Harmful emissions from homes and industry are also being tackled
through schemes to improve energy efficiency. We are experiencing a significant shift towards active
travel, not least in response to the impacts of the COVID19 pandemic, which has seen more people
than ever enjoying our streets with lower levels of motorised traffic – and hence air pollution.

Most of the measures in this action plan that were developed to improve local air quality will
also contribute to the Council’s plans to address the climate emergency that this Council formally
recognised in January 2019.

The role of transport in Oxford’s poor air quality
The city of Oxford, as with many urban areas throughout the United Kingdom, is subject to poor
air quality, particularly in areas with high levels of road traffic. According to our latest Source
Apportionment Study, the transport sector in Oxford continues to be by far the largest contributor
(68%) to total NOx emissions, followed by Domestic Combustion (19%), Combustion from Industry
and Services (12%) and Others: waste, agriculture, solvents, nature (

monitoring campaign (2019) shows that we have exceedances of the NO2 annual mean limit value
at six of the 71 monitored locations in the city: St. Clements Street/The Plain, St Clements Street
East, George Street, St Aldates, High Street and Long Wall Street.
In this AQAP we outline plans to effectively tackle air quality issues that are within our control. The
AQAP recognises that the City Council can only achieve so much. We will continue to engage and
work with a wide set of stakeholders, institutions and citizens, so that everyone can play their part.
The work the Council is doing is wide-ranging, and engagement with our communities and partners
is key. Air pollution results from activities we all contribute to, it is a shared problem and therefore
requires shared solutions.
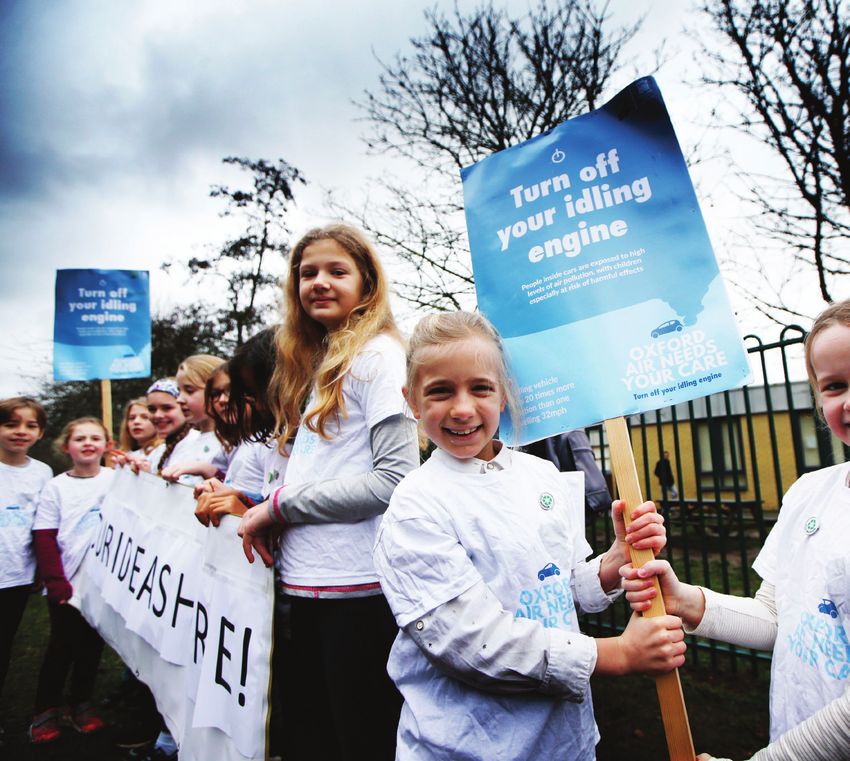
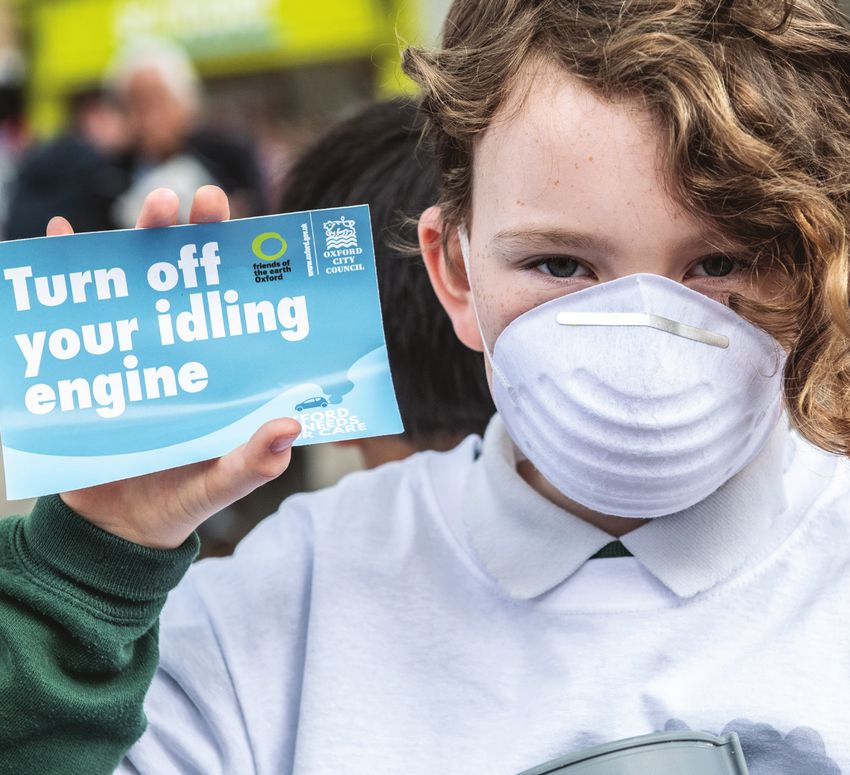
The 30 actions that will be delivered in this AQAP build on several successful and award-winning
programmes. This includes extending engagement programmes to raise awareness about air
pollution in local schools that we have successfully partnered with Friends of the Earth to deliver.
We will also promote active travel, as well as the electrification of the Oxford bus fleet and the roll
out of EV charging infrastructure. There are several air quality policy areas that sit outside of our
direct influence (such as vehicle emissions standards). However, our evidence and experience are
important, and so we will continue to work with central government and key partners to develop
the best measures, powers and funding needed to deliver clean air.
Consultation
A draft version of this AQAP was approved for public consultation by Oxford City Council’s Cabinet
on 9th September 2020. An online survey was launched seeking views and feedback on the
draft, which ran from the 10th September to the 1st November 2020. Consultees were invited to
participate via the City Council website, emails, social and printed media.
In total, 224 people took part in the consultation. Responses have feed into this final version of the
action plan. More detailed information about the public consultation can be found on Chapter 5
and a full consultation report is available on the Council’s website.
4 Oxford City Council Air Quality Action Plan 2021-2025
Table of Contents
Foreword

Executive Summary

Introduction

National Context

Air Quality and Public Health
   1.1     Health Impacts of air pollution
   1.2     Health impacts at local level
   1.3     Economic impacts of air pollution

Air Quality in Oxford
   2.1     Historical background
   2.2     Current air quality status

Sources of Air Pollution in Oxford
   3.1     Emission sources by activity sector
   3.1.1 Changes since 2013
   3.2     Vehicle fleet composition and emissions
   3.2.1 Changes since 2013
   3.3     Required reduction in emissions

Vision and aims of the AQAP
   4.1     Oxford NO2 target
   4.1.1 Why are we proposing a new NO2 target?
   4.1.2 Why are we setting a new local NO2 target fixed at 30 µg/m3?
   4.1.3 The current annual mean limit value for NO2
   4.2     Zero Emission Zone and Connecting Oxford
   4.3     Priorities and actions
   4.4     AQAP measures
   4.5     Policy integration

Development and Implementation of Oxford’s AQAP
   5.1     Consultation and stakeholder engagement
   5.2     Consultation results
   5.3     Steering group

Appendix A: Oxford’s air pollution hotspots

Appendix B: Oxford’s city-wide Air Quality Management Area for NO2

Glossary of Terms

                                                                        5
List of Tables
                   Table 1     Air Quality Objectives for NO2 and PM in England
                   Table 2     Historic comparison of the contribution of each sector to total NOx
                               emission in Oxford.
                   Table 3     Historic comparison of the contribution of each vehicle type to total NOx
                               emission in Oxford.
                   Table 4     Road NOx reductions required to achieve compliance with the NO2 legal annual
                               mean limit value as well as with Oxford’s NO2 annual mean local target at Oxford’s
                               four air pollution hotspots.
                   Table 5     Air Quality Action Plan measures
                   Table 6     Air Quality Action Plan: List of measures by category and classification
                   Table 7     Vehicle restrictions on George Street
                   Table 8     Vehicle restrictions on High Street

                List of Figures
                   Figure 1    Air pollution: Health impacts of throughout lifetime
                   Figure 2    Long term trends of annual mean NO2 (μg/m3) at Oxford’s continuous
                               monitoring stations, 2004-2019.
                   Figure 3    Sources of total NOx emissions in Oxford
                   Figure 4    Sources of total PM10 emissions in Oxford
                   Figure 5    Sources of total PM2.5 emissions in Oxford
                   Figure 6    Total road NOx emissions in Oxford, per vehicle type.
                   Figure 7    Total road PM10 emissions in Oxford, per vehicle type.
                   Figure 8    Total road PM2.5 emissions in Oxford, per vehicle type.
                   Figure 9    Modelled and monitored total NO2 concentrations (2018) at St Clement’s
                   Figure 10   Modelled and monitored total NO2 concentrations (2018) at
                               George Street and surrounding area.
                   Figure 11   Modelled and monitored total NO2 concentrations (2018) on High Street
                   Figure 12   Modelled and monitored total NO2 concentrations (2018) at Cutteslowe
                   Figure 13   Oxford’s current city-wide AQMA for NO2

6   Oxford City Council   Air Quality Action Plan      2021-2025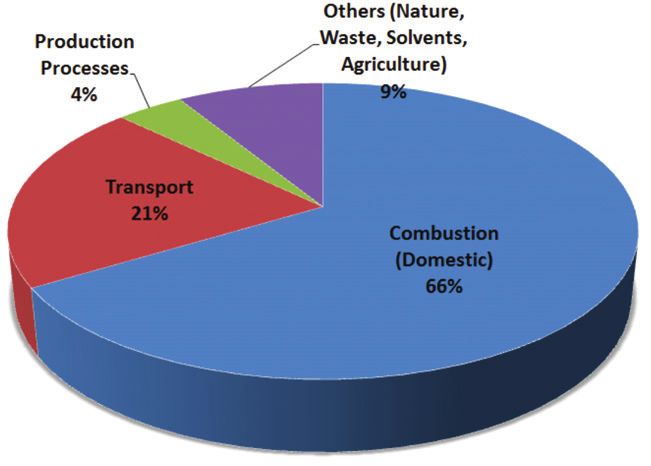
Introduction
This action plan outlines the actions that Oxford City Council and its partners will deliver between
2021 and 2025 in order to reduce concentrations of air pollutants and exposure to air pollution;
thereby positively impacting on the health and quality of the life of residents and visitors to the
city of Oxford.

It has been developed in recognition of the legal requirement on the local authority to work
towards the Air Quality Strategy (AQS) objectives under Part IV of the Environment Act 1995 and
relevant regulations made under that part and to meet the requirements of the Local Air Quality
Management (LAQM) statutory process.

Our action plan moves beyond a focus upon achievement of legal compliance. Our plan seeks to
achieve the lowest levels of air pollution possible over the next five years and sets an ambitious
target to drive action as quickly and effectively as possible.

Transparency is key to the delivery of this AQAP. This document will be subject to an annual review.
Progress each year will be reported in the Annual Status Reports (ASRs) produced by Oxford City
Council as part of our statutory Local Air Quality Management duties.

The following sections set out the scale of the air quality problem in Oxford and its causes. They
outline the priority areas that we consider are crucial to be focusing on to reduce emissions
and improve air quality in the city. This action plan contains a complete list of air quality actions
and measures that we aim to deliver, under each one of those priority areas, in order to achieve
compliance with the local annual mean air quality target for NO2 that we commit to in this AQAP.

                                                                                                        7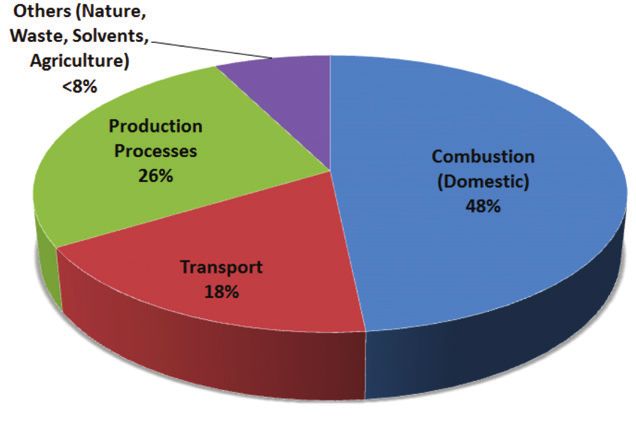
National Context
                Part IV of the Environment Act 1995 requires the Secretary of State to publish a national Air Quality
                Strategy and gave Local Authorities statutory duties to implement the system of Local Air Quality
                Management (LAQM), which commenced in 1997.

                The 2008 Ambient Air Quality Directive (ED/2008/50/EC) sets legally binding limits for
                concentrations in outdoor air for major air pollutants that impact public health such as particulate
                matter (PM10 and PM2.5) and nitrogen dioxide (NO2), to be met before 2010. The limit values were
                established in 2008 and are now over 10 years old. Most UK cities failed to meet the objective by
                2010 as required by the Directive.

                A summary of the air quality objectives for pollutants of most concern: Nitrogen Dioxide (NO2), and
                Particulate Matter (PM), is shown in Table 1 below:

                Table 1 – Air Quality Objectives for NO2 and PM in England
                 Pollutant                                              Air Quality Objective
                                     Concentration                                                      Measured as
                 NO2                 200 µg/m not to be exceeded more than 18 times a year
                                                   3
                                                                                                       1-hour mean
                                     40 µg/m3                                                          Annual mean
                 PM10                50 µg/m , not to be exceeded more than 35 times a year
                                               3
                                                                                                       24-hour mean
                                     40 µg/m3                                                          Annual mean
                 PM2.5vii            25 µg/m3                                                          Annual Mean

                The LAQM process places an obligation on all local authorities to regularly review and assess
                air quality in their areas, and to determine whether the air quality objectives are likely to be
                achieved. Where an exceedance is considered likely the local authority must declare an Air Quality
                Management Area (AQMA) and prepare an Air Quality Action Plan (AQAP) setting out the measures
                it intends to put in place in pursuit of the objectives.

                The UK currently has a total of 605 AQMAs that have been declared based on failure to meet the
                air quality objectives for NO2. Air quality is a significant issue in the UK, with 37 of Britain’s 43 air
                quality zones still exceeding legal limits for nitrogen dioxide, with London being the worst European
                capital for the pollutant.

                In response to the UK leaving the EU, the UK Government introduced a new Environmental Bill to
                Parliament in October 2019. Along with the commitment to set targets on air quality for the UK, the
                new Bill also promises the creation of a new independent Office for Environmental Protection to
                scrutinise environmental policy and law, investigate complaints, take enforcement action against
                public authorities and, if necessary, uphold current and future environmental standards.

                 vii   Non-mandatory target value, to be achieved by 2020

8   Oxford City Council   Air Quality Action Plan             2021-2025
1. Air Quality and Public Health
Air Quality and Public Health
                 1.1            Health impacts of air pollution
                 Air pollution can cause, complicate, or exacerbate many adverse health conditions. It usually
                 manifests as respiratory or cardiac symptoms and can lead to chronic health issues. Recent studies
                 show that poor air quality can affect every organ in the bodyviii and even cause damage to cognitive
                 performanceix. Exposure to poor air quality is directly related to diseases such as cancer, asthma,
                 stroke, heart disease, diabetes, obesity, and dementiax.

                 According to the World Health Organisation (WHO), air pollution kills an estimated 8 million people
                 worldwide every year, of which 4.2 million are attributed to exposure to outdoor air pollution and
                 3.8 million to indoor air pollution. Currently nine out of 10 people in the world breathe air containing
                 health impacting levels of air pollutants.

                 Figure 1- Air pollution: Health impacts of throughout lifetimexi

                 Although air pollution affects people from all regions, ages, and social groups, it is likely to have
                 greater impacts on those who experience heavy exposure and those who have greater susceptibilityxii.
                 The most vulnerable are children, the elderly, or those with pre-existing medical conditions. Harmful
                 effects of air pollution are seen at levels below air quality standards previously considered to be safe.

                 We are now also seeing several research studies linking the severity of COVID19 to air pollution.
                 Several of these studies suggest that air pollution worsens the health impacts of the virus, makes
                 people more susceptible to COVID-19 and contributes towards its transmission. This adds to the
                 now mounting evidence of the negative impacts of air pollution on health.

                  viii Air Pollution and Non communicable Diseases (A Review by the Forum of International Respiratory Societies’
                       Environmental Committee, Part 1: The Damaging Effects of Air Pollution).
                  ix    The impact of exposure to air pollution on cognitive performance
                  x     Even low levels of air pollution linked with serious changes in the heart, according to new UK research
                  xi    This figure forms part of the Guidance “Health Matters: air pollution”, which was published by Public England on
                        their website on 14th November 2018.
                  xii   Air Pollution linked with foetal brain development problems

10   Oxford City Council   Air Quality Action Plan                2021-2025
The World Health Organisation (WHO) has set guidelinexiii values for key air pollutants based on
evidence of their health impacts. The recommended WHO guideline values are significantly lower
for PM10 and PM2.5 than the current UK limit values. The WHO guideline values for NO2 currently
corresponds to the UK limit value of 40μg/m3 (annual mean) and 200 μg/m3 (hourly mean).
However, both short and long-term studies have found adverse health impacts at concentrations
that were at or below the current UK limit values. Some studies even suggest that there are in fact
no ‘safe’ levels of air pollution, and that governments should therefore be aiming for the lowest
possible air pollution levels. A revised version of the air pollution WHO Guidelines is expected to
be published in 2020/2021.
Several studies are also showing a strong correlation between poor air quality and inequality
issues. A 2019 research study, led by academics at the Air Quality Management Resource Centre
(AQMRC) at the University of the West of England, Bristol, found that social inequalities in traffic-
related pollution exposure are ‘clearer and stronger’ than ever before. The study, which updates
a 2003 analysis of environmental justice in the UK, found that while young children, young adults
and households in povertyxiv have the highest levels of exposure to air pollution, it is the richer
households who are more responsible for it.
A recent study from the Office for National Statistics (ONS)xv also shows a strong positive correlation
between the proportion of population in the UK that falls into the Black, Asian and Minority Ethnicity
(BAME) category and the exposure of NO2 measured over a period of 10 years across several areas
in England.
Nevertheless, and while nationally levels of air pollution are often highest in areas of deprivation,
this same pattern is not seen in Oxford, mainly due to the majority of these areas being located
away from high levels of traffic, such as estates. However, there are high levels of air pollution on
routes used by children and in areas with high levels of young people, such as the city centre which
has a large student population. Despite the pattern of areas with high deprivation experiencing
high levels of pollution not being seen in Oxford, this does not mean that air pollution does not
disproportionately impact those from minority backgrounds, the young, old and poor in the city.
1.2 Health impacts at local level
There have been several studies produced over the years that have tried to estimate the true health
impacts of air pollution in Oxford.
In April 2014, a report issued by Public Health England presented estimates of local mortality
burdens associated with particulate air pollution. The report shows that long term exposure to
anthropogenic particulate air pollution in Oxford could be responsible for 6% of all deaths of
people aged 25 and over.
xiii WHO sets recommended limits for health-harmful concentrations of key air pollutants both outdoors and inside
buildings and homes, based on global synthesis of scientific evidence. WHO guidelines cover annual and daily
concentrations of fine particulates, nitrogen dioxide, sulphur dioxide, carbon monoxide and ozone (WHO, 2005)
xiv Research also shows that information about air pollution and health risks focuses on individual risk behaviours
but is very often disseminated using channels that are unlikely to reach the most vulnerable populations, and this
aspect also translates into an inequality.
xv The ONS acknowledges air pollution is one of many factors that may be driving disproportionate outcomes for
black, Asian and minority ethnic (BAME) people – Ethnicity is strongly correlated with pollution exposure in
England, with ethnic minorities more likely to live in polluted areas.
11More recently, in November 2019, a scientific study conducted by Kings College London provided a
series of statements about the potential risks to the public in Oxford and several other cities in the
UK and Poland, from exposure to air pollutants.
Finally, in January 2020, a study from Centre for Cities showed that the estimated absolute number
of attributable deaths caused by PM2.5 alone in Oxford in 2017 was 55.
1.3 Economic impacts of air pollution
Air pollution affects the global economy in several ways: it costs human lives, it reduces people’s
ability to work, it affects vital products like food, it damages cultural and historical monuments,
it reduces the ability of ecosystems to perform functions societies need and it costs money in
remediation or restoration. This is of particular importance given the current situation caused by
the coronavirus pandemic, which has shown the important link between human health and the
health of our economy.
Businesses cannot exist without the work of a healthy workforce to produce the goods and services
on which we all rely, nor can they exist without a vibrant consumer market to generate the demand
to fuel their firm’s income. With better air quality, businesses will benefit from a healthier workforce
and more productive capital assets which in turn can lead to a more prosperous economy with
greater resilience to economic shocks.
In September 2020, CBI Economics, commissioned by the Clean Air fund, issued “Breathing Life
into the UK Economy”, a report that quantifies the economic benefit to the UK of meeting WHO
Air Quality guidelines. The report is believed to be the first analysis of the economic benefits of
reducing pollution levels to below current air pollution legal limit values.
Their research found that if the UK met the World Health Organization (WHO) guidelines for air
pollution, the UK’s economy would have an annual benefit of £1.6bn, via the reduction in premature
deaths, sickness absence and lower productivity at work. This would be on top of savings to
NHS and social care budgets from treating fewer patients with health conditions associated with
pollution.
The study also found that 17,000 premature deaths of people of working age can be saved each
year and it identified those people to be dying nearly 12 years earlier than expected on average.
Meeting WHO guidelines would also save the loss of 3 million working days per annum from workers
currently becoming ill or having to take time off to care for sick children because of air pollution.
12 Oxford City Council Air Quality Action Plan 2021-20252. Air Quality in Oxford
Air Quality in Oxford
                 2.1          Historical background
                 The process of review and assessment of air quality in Oxford has been taking place since 1999. At
                 the time, the air quality objectives for nitrogen dioxide, both annual mean and hourly mean were
                 exceeded in areas dominated by traffic.

                 The City Council declared an Air Quality Management Area (AQMA) for NO2 in central Oxford in
                 2003, which was expanded in 2005. In relation to this AQMA the Council produced and published
                 its first AQAP in 2006 seeking to address pollution in central Oxford, by focussing on emissions
                 from buses which were identified as the main source.

                 Despite good progress being made with the 2006 AQAP, significant breaches of the national
                 objectives for NO2 still existed and additional hotspots were identified. Therefore, following further
                 detailed assessments of air quality, a city-wide AQMA was declared in September 2010. A new
                 Air Quality Action Plan (AQAP) was adopted by the Council in 2013, with a new set of measures
                 targeted at improving air quality levels in the city for the period 2013-2020. Details of Oxford’s
                 current city-wide AQMA for NO2 can be found in appendix B.

                 Historical analysis of air quality data (see Figure 2 below) shows that since that period, NO2 levels
                 have significantly improved in the city of Oxford. In 2003 we saw NO2 of over 70 μg/m3, while in
                 2019 levels were around 40 μg/m3.

                 Since 2013, we have seen an overall decline of 26% in NO2, 31% in Particulate Matter (PM10) and
                 36% in Particulate Matter (PM2.5) in the places where air quality is being monitored.

                 The majority of the reductions observed over the period are related to significant changes in traffic
                 emissions. The introduction of a Low Emission Zone (LEZ) for buses in the city in 2014 and the
                 retrofit of several buses to cleaner Euro VI engines (which achieve an estimated 99.5% reduction in
                 NOx emissions compared to Euro V) have contributed to these improvements.

                 However, air quality monitoring results from the most recent years have shown that the rate of
                 these reductions is now slowing down. In many cases, air quality levels seem to have plateaued in
                 the city, suggesting that more robust action to tackle air quality in the city is now required.

14   Oxford City Council   Air Quality Action Plan       2021-2025
Figure 2- Long term trends of Annual Mean NO2 (μg/m3) at Oxford’s continuous
monitoring stations, 2004-2019.
2.2 Current air quality status
At the time of writing, data from our most recent air quality monitoring campaign (2019) shows that
we still experience exceedances of the NO2 annual mean limit value at six locations across in the
city. Those locations are St. Clements Street/The Plain, St Clements Street East, George Street, St
Aldates, High Street and Long Wall Street.
The 2019 monitoring results also showed a positive result in that there are no exceedances of the
UK limit values or the WHO recommended guidelines for particulate matter (PM2.5 and PM10) in
Oxford, in all the locations where these pollutants are measured.
Air quality is monitored annually across the city. To see full details of where we monitor, why we
monitor in those locations, and the latest data on air quality, you can visit our website. The current
status of air quality levels in Oxford can be found in our latest official Annual Status Report which
can be also downloaded from our website. All our current monitoring locations and the latest
monitoring data can also be viewed using this interactive map.
1516 Oxford City Council Air Quality Action Plan 2021-2025
3. Sources of Air
   Pollution in Oxford
Sources of
                 Air Pollution in Oxford
                 The AQAP measures presented in this report are targeted towards the predominant sources of
                 emissions within Oxford.

                 In December 2019 Oxford City Council commissioned Ricardo Energy & Environment to conduct a
                 source apportionment study (SAS) to assess:

                 •   the contribution of each activity sector to total emissions of NOx, PM10 and PM2.5 in Oxford.
                 •   within the road transport sector, the contribution of each vehicle type to total road emissions
                     of NOx, PM10 and PM2.5 in Oxford.

                 The complete source apportionment study, which was undertaken to the required LAQM TG (16)
                 standards, was published by Oxford City Council on the 26th June 2020 and is available for review
                 on Oxford City Council’s website.

                 3.1          Emission sources by activity sector
                 The contribution of each activity sector to the total emissions of NOx, PM10 and PM2.5 in Oxford is
                 shown on Figures 3 to 5 below.

                 Figure 3 - Sources of total NOX emissions in Oxford
                                                                                      Prive Hire
                                                                                      Prive Hire
                                                                                                 0.2%
                                                                                      Hackneys 0.2%
                                                                                    & Hackneys
                                                                                    &
                                                                                      Petrol car
                                                                                      Petrol car 4.1%
                                                                                                 4.1%
                              Transport
                              Transport
                                 68%
                                 68%                                                  Diesel car
                                                                                             car                              32.7%
                                                                                      Diesel                                  32.7%
                                                          Others (nature,
                                                          Others (nature, waste,
                                                                          waste,
                                                          solvents &
                                                                   & agriculture)
                                                                     agriculture)   Motorcycles 0.2%
                                                                                    Motorcycles 0.2%
                                                          solvents
& Hackneys
Transport 48.4%
Combustion Car
18%
(domestic)
48% Motorcycles 0.5%
Others (nature, waste,
solvents & agriculture) LGVs 17.1%3.2 Vehicle fleet composition and emissions
The contribution of each vehicle type to the total road emissionsxvi of NOx, PM10 and PM2.5 in
Oxford is shown on Figures 6 to 8 below.
Prive Hire
0.2%
& Hackneys
Figure 6 - Total roadPrive
NOHire
x emissions in Oxford, per vehicle type
Petrol car 0.2%
& Hackneys 4.1%
Prive Hire
t 0.2%
& Petrol
Hackneys
car 4.1%
Diesel car 32.7%
Petrol car 4.1%
Others (nature, waste, Diesel car 32.7%
solvents & agriculture) Motorcycles 0.2%
Others3.2.1 Changes since 2013 The results showed in Table 3 represent a big shift in the contribution of each vehicle type to total emissions of NOx in the city if we compare them with data from 2013. Table 3 - Historic comparison of the contribution of each vehicle type to total NOx emission in Oxford Vehicle type 2013 2019 Comparison (2013 vs 2019) Private Hire & Hackneys 3%
Table 4 – Road NOX reductions required to achieve compliance with the NO2 legal
                 annual mean limit value as well as with Oxford’s NO2 annual mean local target at
                 Oxford’s 4 air pollution hotspots
                  Diffusion Tube Code                                DT55          DT48         DT56      DT26
                  Location                                           St Clement’s George St High St Cutteslowe

                  NO2 measured in 2018, ug/m3                          46            42         44           41
                  NOx background, ug/m    3
                                                                       21.1          26.4       24.9         17
                  (A) Roadside NOx from NO2 calculator, ug/m3          66.03         50.09      56.65        58.39
                  (B) Roadside NOx to achieve compliance with          51.3          45.3       47           55.9
                      current limit value, ug/m3
                  (C) Roadside NOx to achieve compliance with          28.6          22.9       24.6         33.0
                      local target, ug/m3
                  Road NOx reduction required to achieve limit         14.7           4.8         9.6         2.4
                  value ug/m3 (A-B)
                  Road NOx reduction required to achieve local         37.4          27.1       32.1         25.4
                  target ug/m3 (A-C)
                  Road NOx reduction required for Limit Value (%)      22.3%          9.5%       17.0%        4.2%
                  Road NOx reduction required for Local Target (%)     56.7%         54.3%      56.6%        43.5%

                 Table 4 shows that the required reduction in emissions for St Clement’s Street / The Plain to achieve
                 compliance with the NO2 annual mean Limit Value is 14.7 μg/m3 or 22.3%. For George Street, High
                 Street and Cutteslowe the necessary road NOx reductions are of 4.8 ug/m3, 9.6 ug/m3, 2.4 ug/m3
                 or 9.5%, 17%, and 4.2% respectively.

                 Calculations also show that there needs to be road NOx reductions of above 50% for most sites to
                 achieve compliance with Oxford’s new local target for NO2. At St Clement’s, George St, High St and
                 Cutteslowe, NOx reductions of 56.7%, 54.3%, and 56.6% are required to achieve compliance with
                 the new target. At Cutteslowe, the level of road NOx reduction required is slightly lower at 43.5%.

22   Oxford City Council   Air Quality Action Plan       2021-2025
4. Vision and Aims of the AQAP
Vision and Aims of the AQAP
                 The scope of this AQAP is to set out a range of actions to reduce air pollutants from different
                 sectors of activity in response to the declaration of an AQMA for exceedances of the annual mean
                 objective for NO2.

                 4.1          Oxford NO2 target
                 The key objective of this AQAP is to bring NO2 emissions across the city into legal compliance as
                 soon as possible, however importantly we want to reach beyond legal compliance for the whole
                 city. Oxford City Council is committing to becoming the first UK Local Authority to set a local annual
                 mean NO2 target in a city-wide AQAP.

                 The overall objective of this AQAP for the whole of the Oxford City area is to:

                              Achieve a local annual mean NO2 target of 30 µg/m3 by 2025
                                                           “30 by 25”

                 The legal annual mean limit value for NO2 is 40 µg/m3. Research now shows that this legal limit
                 is not a safe limit. Several health studies show that harmful effects of air pollution are seen at
                 levels below air quality legal standards previously considered to be safe. We take the health of our
                 residents and visitors very seriously and the decision to set a new low target for NO2 is evidence of
                 our commitment to improve health outcomes for all.

                 According to the Committee on the Medical Effects of Air Pollutants (COMEAP), a 1 µg/m3 reduction
                 in NO2, could lead to about 420,000 to 903,000 life years saved in the UK over the next 106 years,
                 with an increase in life expectancy (at birth) of around 2 to 5 days. It is therefore expected that a
                 10 µg/m3 reduction in NO2 can lead to a significant improvement in the health outcomes for Oxford
                 residents.

                 4.1.1 Why are we proposing a new NO2 target?
                 A significant amount of research has been completed since the air quality directive was established
                 and since the WHO published guidelines on outdoor air pollution. This now suggests that there are
                 in fact no ‘safe’ levels of air pollution and that governments should, therefore, be aiming for the
                 lowest possible air pollution levels. Our setting of a lower target is a key step towards reducing
                 air pollution to the lowest possible level, thereby protecting the largest number of people’s health
                 and lives.

                 Recent studies show that there is strong evidence of a relationship between long-term exposure to
                 NO2 and respiratory effects, particularly the development of asthma in children. Results suggest
                 that both short and long-term exposure to NO2 may be associated with cardiovascular and related
                 metabolic effects, as well as premature mortality. Further to that, long-term exposure may be
                 associated with poorer birth outcomes and cancer.

                 Oxford City Council has pioneered measures to reduce air pollution levels and address climate
                 breakdown, including:

24   Oxford City Council   Air Quality Action Plan       2021-2025
• Oxford pioneered the first enduring UK Park and Ride bus scheme (1973) and provided a model
for other cities, notably Nottingham, York, Leicester, Norwich, and Cambridge.
• Oxford was the first UK city to follow London in the implementation of a Low Emission Zone
(LEZ) for buses (2014).
• Oxford launched plans (2017) for the UK’s first Zero Emission Zone in Oxford City.
• Oxford became the first UK city to host a Citizens’ Assembly on Climate breakdown (2019),
which addressed measures to reduce air pollution.
• Supported by the City Council, Oxford is home to the £41m project Energy Super-hub Oxford,
which includes the world’s largest hybrid battery system and supports the roll out of electric
and zero emitting vehicle charging capacity and fleets. In 2021, Oxford will be home to the UK’s
largest EV charging hub.
• Supported by the City Council, Oxfordshire is trialling a £40m industry-first local energy system,
called Project LEO (Local Energy Oxfordshire). This smart local energy system explores how
growth in local renewables, electric vehicles, battery storage, and vehicle-to-grid technology
can be supported by a local, flexible and responsive electricity grid, which will enable zero
emission mobility.
• Supported by Oxford City Council, trialling ‘OxPops’, the world’s first residential ‘pop up’ on-
street electric vehicle charging point to enable the shift towards zero emission mobility.
Setting a stretching target and increasing our ambition is also helping to secure additional
investments in innovative areas where the city has strengths and a strong record of success. The
City Council seeks to support large investment into the city which will enable us to clean Oxford’s
air as much as we can and as quickly as possible, thereby improving public health, reducing early
deaths and addressing climate breakdown, whilst also supporting local businesses, jobs and
inclusive economic growth. The rapid expansion of the Green Economy is especially important as
Oxford seeks to recover from the Coronavirus pandemic.
4.1.2 Why are we setting a new local NO2 target
fixed at 30 µg/m3?
The decision to choose the target of 30ug/m3 was based on the 2018 analysis of the results of
several air quality modelling projections and studies, the analysis of our city centre historic air
quality monitoring data for the period 2002 - 2018, and taking into account the expected air quality
impacts of the complete set of air quality measures that are being put forward in this AQAP. In
short, the target-setting is evidence-led.
The air quality models and resources used for this analysis were:
• Air Quality Modelling for ZEZ Feasibility Study
• DEFRA’s Roadside Projection Factors
• JAQU’s modelling work for targeted feasibility study
• Oxford City Council’s historical diffusion tube data (2003-2018)
• Review of Air Quality impact of measures set out in the new AQAP
A comparative analysis across these sources showed that a target NO2 value of 30 µg/m3 would be
both stretching and realistically achievable in the specified time period.
It is important to set clear and realistic targets so that we inspire the confidence of citizens and
partners in our plans, and they can understand their potential role in our shared efforts. This local
authority will seek out opportunities to make a greater contribution and a larger reduction than our
headline target wherever possible.
254.1.3 The current annual mean limit value for NO2
Oxford is currently in breach of the annual mean limit value for NO2 in six locations of the city (out
of the 71 locations where air quality is being monitored). It is therefore also a commitment of this
Air Quality Action Plan to:
Achieve compliance with the legal annual mean
limit value of 40 µg/m3
The current annual mean limit value for NO2 is set out in the European air quality directive (2008/
EC/50) for the protection of human health, which says that NO2 annual mean value should not
exceed 40 micrograms per cubic metre (µg/m3). This and other air pollutant limit values have been
all transposed into UK law through the Air Quality Standards Regulations 2010. They are referred
to as “UK Air Quality Objectives” and all came into force on 11th June 2010.
The local air quality management (LAQM) regime requires every district and unitary authority to
annually review and assess air quality in their area. Air quality monitoring is utilised to identify
whether the relevant limit values have been achieved at relevant locations.
4.2 Zero Emission Zone and Connecting Oxford
The new AQAP is anchored in two transport and air pollution management schemes that the City
and County Councils are in the process of delivering: the Zero Emission Zone and Connecting
Oxford. We believe these will be the main drivers and contributors to the reduction of air pollution
levels in the city. It is felt that by supporting and building upon these existing proposals, tangible
improvements in air quality can be achieved more quickly.
Oxfordshire County Council’s Local Transport Plan 4, published in 2015, set out proposals to
introduce a Zero Emission Zone (ZEZ) in Oxford starting in 2020. Since then, proposals have been
developed by Oxford City Council, in partnership with the County Council, for a ZEZ in Oxford to
be rolled out in phases starting in 2020. The overall aim of this journey to zero is to eliminate
transport ‘tailpipe’ emissions in Oxford city centre by 2035. Transitioning businesses and residents
to ultra-low and zero emission vehicles is a critical building block of this zero-emission ambition.
The councils consulted on initial proposals for a ZEZ in 2017. After 15 months of listening to
businesses, residents, transport operators and health experts in Oxfordshire, updated proposals
were published in January 2019 for emissions requirements to be implemented in Oxford city centre
in a phased approach to allow for learning from 2021 to 2035. On the 20th November 2020, a final
consultation for the city centre ZEZ was launched. Under the final proposals, a ZEZ pilot road user
charging scheme is proposed to start in August 2021 in a few city centre streets. After the trial,
the expectation is for a ZEZ covering the entire city centre to begin from spring 2022. Detailed
information about the current and future ZEZ plans can be found on Oxford City Council’s website.
In January 2020, Oxfordshire County and Oxford City Councils’ cabinets approved the development
of proposals for the delivery of Connecting Oxford. This is a traffic management scheme that is
designed to increase connectivity, reduce congestion, and tackle air pollution and climate change.
The plans include the delivery of a set of bus gates and the implementation of a workplace parking
levy in parts of the city. Detailed information about the Connecting Oxford proposals can be found
at Oxfordshire County Council’s website.
26 Oxford City Council Air Quality Action Plan 2021-2025Several of the actions in the AQAP are linked to these two schemes and facilitate a significant
modal shift towards active travel, as well as the transition to zero emission transport. This includes
the installation of electric vehicle charging points in the city, as well as the introduction of electric
car clubs to allow residents to take up zero emission vehicles.
4.3 Priorities and actions
This AQAP provides a framework for continuing current activity in the city to reduce NO2 emissions
whilst also developing new actions to complete our journey to legal emissions and go beyond the
council’s new NO2 local target.
The results of our source apportionment clearly highlight the importance of domestic combustion
to total NOx emissions in the city. It also shows that the relative contributions to total road NOx
emissions have shifted away from buses in recent years, and towards smaller vehicles (cars and
LGVs), as bus fleets have been upgraded. However, cars and buses are still the vehicle types that
contribute the most to road transport emissions in Oxford.
The next pages show a detailed breakdown of all the measures, interventions and key priorities,
which have been prepared and developed considering the results of our source apportionment study.
These actions will be delivered by a range of partners including Oxfordshire County Council who, as
local transport authority, are responsible for many of the actions related to transport modal shift.
Priority A - Developing partnerships and public education
Encouraging behavioural change to clean up the air in our cities through public education and
effective communication can play a significant role in the reduction of air pollution. By raising
awareness, we can see that we all have a role to play and we are all part of the solution; our
everyday decisions can have an impact on the air we breathe.
The set of measures that will be delivered within this priority area are aimed at developing
a solid foundation of environmental education in our community. They build upon the
successful delivery of behavioural change and air quality communication programmes, such
as the Award winning STOP, WOW, Anti-Idling Campaign or OxAir.
Core actions will be to:
• Work with schools, children, vulnerable groups and hard to reach communities to raise
awareness of air pollution, discourage idling and promote active travel;
• Support city wide events that aim to accelerate the uptake of sustainable transport;
• Support projects that increase Oxford’s Air Quality/AQ & Health evidence base such as OxAir;
• Develop partnership work with the NHS, the third-sector, as well as public health
commissioners and providers to increase awareness of air pollution amongst patients and
reduce their personal exposure to air pollution;
• Improve air quality communication on our website and associated websites to assist the
public in accessing reliable information about air pollution;
• Explore opportunities to use green infrastructure to reduce exposure to poor air quality levels;
• Deliver a city-wide campaign on how to implement DEFRA’s best practice on the of use
open fires and wood burning stoves, and on how to reduce burning of inappropriate fuel;
• Work with the District and County Councils on a co-ordinated approach to raise public
awareness and improve education.
27Priority B - Support for the uptake of Low and Zero emission vehicles
This priority area is aimed at the delivery of air quality measures that support the city’s
plans for the implementation of a Zero Emission Zone. It is expected that the delivery of the
measures under this key priority area will substantially contribute to the reduction of transport
emissions in the city. According to our source apportionment, transport is responsible for
68% of total NOx emissions in Oxford.
The main measures to be delivered under this area include the introduction of a new Euro
VI Low Emission Zone (LEZ) for buses in Oxford, a road user charge scheme for all non-zero
emission vehicles in Oxford city centre, the delivery of EV charging infrastructure, plans for
the electrification of the City Council’s own fleet, opportunities for the complete electrification
of Oxford’s bus fleet, as well as the commitment to incentivise zero-emission vehicles or to
place restrictions on other vehicles in Oxford.
Core actions will be to:
• Introduce a Euro VI LEZ for buses in Oxford and work with bus operators and external
funders to secure funding for a cleaner and zero-emission bus fleet;
• Continue to introduce tighter Ultra Low emission standards for Hackney Carriage Vehicles;
• Deliver the Zero Emission Zone to accelerate the transition to zero emission vehicles in
Oxford;
• Increase the amount of EV charging infrastructure in the City;
• Expand the City Council’s EV Fleet (electrification of 25% of vehicle fleet by 2023);
• Develop an EV Strategy for Oxfordshire;
• Deliver Oxford’s Energy Super Hub including the installation of more than 20 ultra-rapid +
30 fast vehicle EV chargers for the public use + the provision of ground source heat pumps
for more than 300 homes, and the provision of the UK’s largest EV charging hub in 2021;
• Deliver Air Quality Benefits through Planning System (EV charging infrastructure + efficient/
less pollutant technologies);
• Explore opportunities for the delivery of electric infrastructure that could accelerate the
uptake of electric boats and reduce their reliance on fossil fuel use for domestic heating.
28 Oxford City Council Air Quality Action Plan 2021-2025Priority C - Reducing emissions from domestic heating, industry and
services
The proportion of emissions from domestic heating, industry and services has increased
as transport emissions have reduced. With the decrease in air pollution emissions from
transport, air pollution levels generated from these other sectors gain more importance every
year particularly when it comes to the role they play in the generation of PM10 and PM2.5
emissions. With regards to NOx, these activities also contribute to 31% of total NOx emissions
of the City.
The city of Oxford is currently fully compliant with legal limits, as well as WHO advisory limits,
for PM10 and PM2.5. However, recent studies clearly indicate that there is no safe level of air
pollution, and there is already clear evidence that particulate matter has a significant impact
on human health, including premature mortality, allergic reactions, and cardiovascular
diseases.
Most of the measures that will be delivered under this priority area are related to the
reduction of combustion emissions via increased energy efficiency, thereby reducing NOx
and PM emissions. (I.e. replacing old combustion sources such as boilers, shifting to low fuel
appliances, and exploring heat networks).
Core actions will be to:
• Upgrade the Energy Efficiency of City Council’s Housing stock;
• Provide Energy Advice Services, by employing Energy Advice Officers to visit Council homes
and advise tenants, whilst also identifying energy saving improvements to the properties;
• Use central government’s ECO Flexible Eligibility funding to identify and designate
households as eligible under the Affordable Warmth Scheme;
• Review of Smoke Controlled Zones and implement revised government legislation for
smoke nuisance.
• Encourage the development of local heat networks.
29Priority D - Reduce the need to travel, explore opportunities for mode shift
and increase the uptake of sustainable transport
One of the key themes of Oxfordshire’s current local transport plan is to support the transition
to a low carbon future by minimising the need to travel and reducing the proportion of
journeys made by private car by making the use of public transport, walking and cycling more
attractive.
The City and County Councils and partners have been supporting a shift to more sustainable
and low emission modes of travel as well as reducing the proportion of car-based travel to
and around the city, as this is an important way to reduce transport emissions.
The main measures to be delivered under this area include exploring the possibility of
implementing a Work Place Parking Levy in the city, introducing new vehicle access restrictions,
implementing a local cycle and walking infrastructure plan, as well as introducing bus priority
measures.
Core actions will be to:
• Deliver Connecting Oxford;
• Deliver sustainable transport measures such as cycling improvements and bus priority
lanes;
• Roll-out Controlled Parking Zones (CPZ) to discourage non-residential parking;
• Roll out Low Traffic Neighbourhoods and supporting infrastructure
• Work with businesses to explore the inclusion of innovative sustainable travel modes into
their business models;
• Explore opportunities to address city centre freight emissions by creating consolidation
centre/s;
• Work with schools to reduce exposure to air pollution by reducing the need to travel during
drop off/pick up times and introducing School Streets;
• Support Bikeability (free cycling lessons provided to pupils).
30 Oxford City Council Air Quality Action Plan 2021-2025You can also read