AIR QUALITY DURING THE 2006-07 VICTORIAN BUSHFIRES - Yarra and ...
←
→
Page content transcription
If your browser does not render page correctly, please read the page content below
ENVIRONMENT REPORT – VICTORIA’S CHANGING ENVIRONMENT

AIR QUALITY DURING THE 2006–07 VICTORIAN BUSHFIRES
Publication 1187 December 2007

EXECUTIVE SUMMARY
Bushfires impact on air quality and human health.             making informed decisions to protect their health on
Victoria is one of the most fire-prone regions in the         smoke-affected days.
world — approximately 1.2 million hectares were burnt         Prevailing winds and fire conditions meant that a large
during the major bushfires between December 2006              area of Victoria was impacted by the bushfires.
and February 2007. With climate change predictions            Melbourne, Geelong, the Latrobe Valley and East
indicating an increase in the risk and severity of            Gippsland were the worst affected areas.
bushfires, large-scale smoke impacts similar to those
of the summer of 2006—07 may become more                      All regions had high levels of particle pollution. For
commonplace in Victoria.                                      example, in a typical summer Melbourne would expect
                                                              to have only one or two days with high levels of fine
During the 2006—07 bushfires, EPA installed                   particles, but during the bushfires 15 days were
additional monitoring stations in populated areas             affected. Melbourne, Geelong and the Latrobe Valley
closer to the fires (at Wangaratta and Bairnsdale,            also experienced high levels of ozone.
augmenting the existing Victorian network of 15
stations) to assess the massive impact these fires had        EPA, with assistance from the Bureau of Meteorology
on Victorian air quality. This equipment analysed the         and the Department of Sustainability and
level of bushfire smoke and compared these                    Environment, forecast the smoke impacts from the
measurements to Victorian and Australian air quality          fires. EPA worked with the Department of Human
objectives.                                                   Services to alert Victorians to the potential health
                                                              effects and cautionary actions that could be taken.
EPA collected data to assess the levels of particles
smaller than 10 micrometres, visibility-reducing              EPA will continue to work with the Department of
particles and ozone; key indicators of bushfire smoke         Human Services to better understand the health
that affect human health. EPA’s air monitoring                impacts of bushfires and to monitor and advise the
program during the bushfires assisted people in               community.

                     Figure 1: Melbourne’s central business district affected by bushfire smoke
                            during December 2006. Photo: Paul Rovere courtesy of The Age

                                                                                                                   1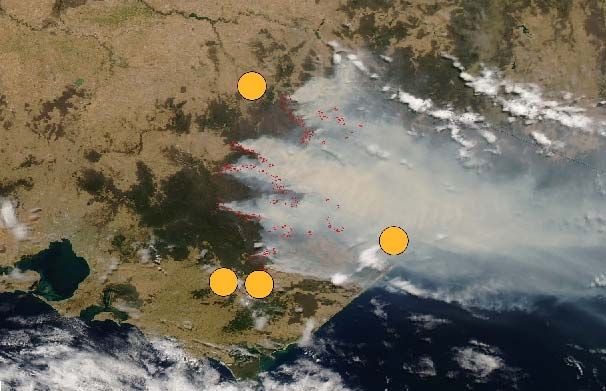
AIR QUALITY DURING THE 2006–07 VICTORIAN BUSHFIRES
BUSHFIRES IN VICTORIA 2006–07 BUSHFIRES
Victoria is one of the most fire prone regions in the There were numerous major fires in Victoria between
world and bushfires are an inherent part of the December 2006 and February 2007. Lightning strikes
Victorian environment. In southern Australia major on 1 December sparked initial blazes in Victoria’s
fires generally occur during drought periods, Gippsland and north-eastern regions. Around 50
associated with el Niño events that have a direct effect separate fires joined to form large fire fronts (Great
on Australia’s rainfall. Divide Complex) that burnt until early February. The
Victoria has had a number of severe bushfires during most severe fire outbreaks occurred on 31 December —
the past 100 years, including 1939 (Black Friday), 1983 1 January and 21—22 January, when temperatures
(Ash Wednesday), 2002—03 (NE Victoria) and the across the state exceeded 40 °C.
recent 2006—07 bushfires. The 2006—07 bushfires The extent of area burnt in north-east Victoria is
were amongst the most severe bushfires on record. shown in Figure 2. Approximately 1.2 million hectares
Among the many impacts of these fires were high were burnt, with north-east Victoria, Gippsland and the
levels of air pollution across Victoria, including Alpine areas most severely affected. Smoke from large
Melbourne (Figure 1). fires burning in Tasmania and King Island also affected
Victoria’s air quality during the summer of 2006-07.
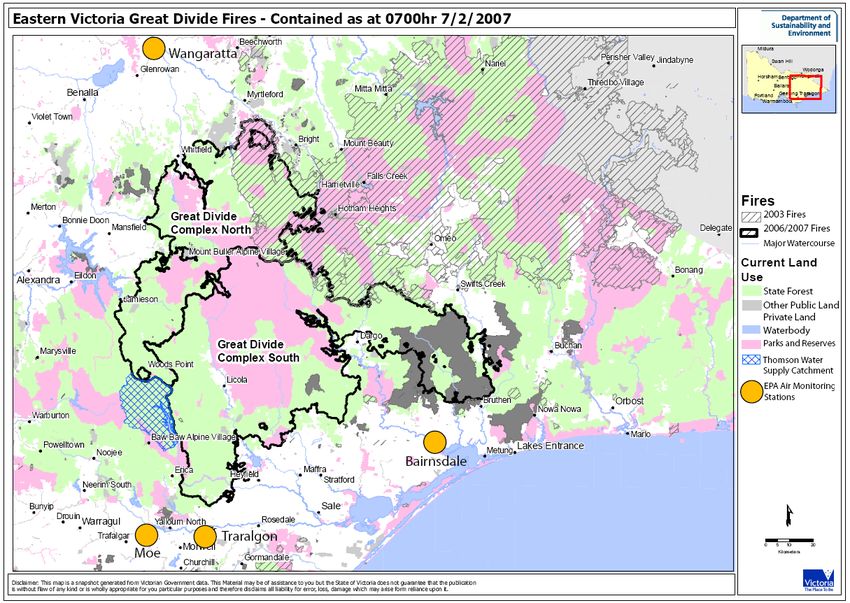
Figure 2: Map of north-eastern Victoria, showing areas burnt during 2006—07 (bold outline) and 2002—03
bushfires (grey cross-hatching). Land use type is shown in colour and EPA air monitoring stations shown by
orange dots. (Modified map courtesy of the Department of Sustainability and Environment (DSE) www.dse.vic.gov.au)
2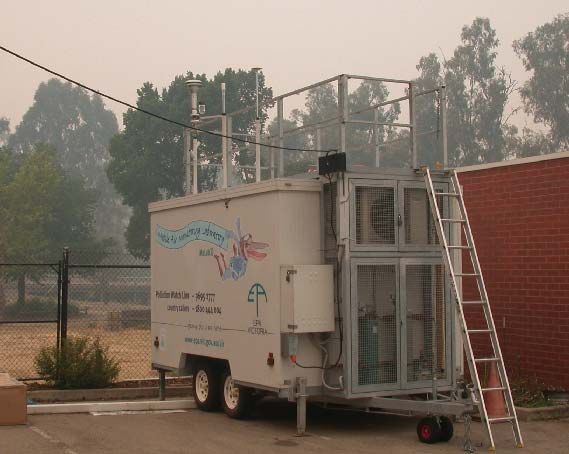
AIR QUALITY DURING THE 2006–07 VICTORIAN BUSHFIRES

EPA’S BUSHFIRE RESPONSE

1.      Where did EPA monitor?
In December 2006 EPA had 15 air quality monitoring
stations across Victoria (10 in Melbourne, two in
Geelong, two in the Latrobe Valley and one in
Warrnambool) 1. In response to the bushfires, EPA
installed air quality monitoring equipment in populated
areas close to the fires.
Monitoring commenced at Bairnsdale (Figure 3) on
9 December and Wangaratta (Figure 4) on 13
December. EPA commissioned a further mobile
monitoring station at Macleod (a northern suburb of
Melbourne) on 19 December, with the potential for
deployment to bushfire areas if required. New
instrumentation to monitor visibility-reducing particles
was also added to the existing monitoring station at
Richmond.                                                                        Figure 3: Mobile air monitoring station at
                                                                                      Bairnsdale, 9 December 2006

                               Figure 4: Mobile air monitoring station at Wangaratta, 13 December 2006

1
     EPA air monitoring network: www.epa.vic.gov.au/air/bulletins/airmonlc.asp

                                                                                                                              3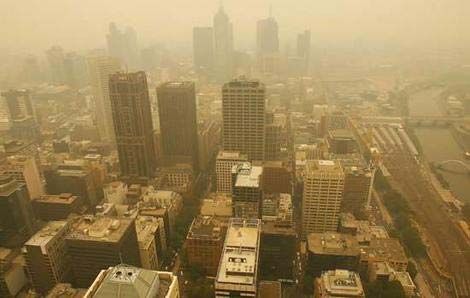
AIR QUALITY DURING THE 2006–07 VICTORIAN BUSHFIRES

2.       What did EPA monitor?                                                     3.      What are the health effects of bushfires
                                                                                           smoke?
The key pollutants monitored by EPA during the
bushfires were particles (both as PM10 — particles                                 A number of overseas studies have shown health
smaller than 10 micrometres — and visibility-reducing                              effects from bushfire smoke. These effects are most
particles) and ozone. The actual composition of                                    pronounced in sensitive groups such as those with
bushfire smoke depends on the vegetation type, the                                 asthma or other respiratory problems. Studies in
temperature of the fire and wind conditions. Particles                             Australia have so far been inconclusive, perhaps
and ozone are the main pollutants of interest during                               because of low study populations.
bushfire events, as they are indicators of bushfire
                                                                                   An investigation by the Department of Human
smoke and its impact on human health.
                                                                                   Services (DHS) of the north-east Victorian region
Particles smaller than 10 micrometres (PM10 ) can                                  during the 2002—03 bushfires did not find any
be absorbed into the lungs, which can impact on                                    noticeable change in hospital admissions for
people’s health, especially those who have existing                                respiratory disease during the smoke-affected periods.
respiratory illnesses or heart disease. Children and the                           However, bushfire smoke is fundamentally a
elderly may be more vulnerable to the effects of                                   combustion product, similar in many respects to
particles.                                                                         smoke from domestic wood heaters. Smoke from wood
Visibility-reducing particles can reduce visual                                    heaters is known to cause health problems in both
distance and aesthetic enjoyment and, due to their                                 indoor and outdoor environments.
small size, can also be absorbed deep into the lungs                               A comprehensive health study of the 2006—07 fires is
and impact on human health. Visibility measurements                                currently being undertaken by EPA, DHS and St.
give an indication of how far the average person can                               George’s Hospital, London to fully investigate the
see, with the objective being a minimum visual                                     health effects of the recent bushfires. Further
distance of 20 km.                                                                 information on bushfire smoke and your health is
Ozone is an irritant gas that can impact on the                                    available from the Emergency Management section of
respiratory system. Asthmatics and the elderly are                                 the DHS website 3.
particlularly sensitive to the effects of ozone. It exists
naturally in the earth’s atmosphere (the ozone layer),
                                                                                   ADVICE TO THE COMMUNITY
but can also cause problems when it occurs in high
concentrations at ground level during pollution events.
                                                                                   1.      Forecasting smoke impacts
Due to improved pollution controls on cars and
industry, elevated levels of ozone are now uncommon                                EPA Victoria provides daily forecasts of air quality for
in Melbourne. However bushfires produce the                                        Melbourne and Geelong. During the 2006—07
ingredients (oxides of nitrogen and hydrocarbons)                                  bushfires EPA expanded this forecasting to include
necessary to form ozone.                                                           smoke advisories. The Bureau of Meteorology’s smoke
Levels of pollutants monitored during the bushfires                                dispersion model and DSE burn maps were used in
were compared against Victorian and Australian air                                 conjunction with direct contact with Bureau of
quality objectives 2 (Table 1). The objectives for PM10                            Meteorology senior forecasters and DSE fire
and ozone have been set to protect human health and                                management officers to assist in forecasting areas
well-being. The objective for visibility-reducing                                  likely to be affected by smoke. EPA also used daily
particles has been set to maintain visual amenity. In                              satellite imagery from MODIS 4 and Sentinel Hotspot4
this report PM10 and ozone results that did not meet                               data to track smoke movement across Victoria.
the air quality objectives during the bushfires are
referred to as high. Visibility is referred to as poor                             2.      Smoke advisories and cautionary advice
when it did not meet the objective.                                                EPA worked closely with DHS during the bushfires to
                                                                                   issue bushfire smoke advisories and communicate
                     Table 1: Air quality objectives                               these through the media (Table 2). These advisories
                                                                                   were based on visibility and PM10 measurements, as
    Pollutant                      Averaging period             Objective          they are a good representation of potentially harmful
    Particles as PM10                     24 hour               50 µg/m3           fine particle pollution and can be easily measured and
                                                                                   communicated.
    Visibility-reducing
                                           1 hour                 20 km
    particles

    Ozone                                  1 hour                100 ppb
                                                                                   3
                                                                                        Public Health Information: Bushfire smoke and your health, available from
                                                                                        www.health.vic.gov.au/environment/emergency_mgmnt/
                                                                                   4
                                                                                        MODIS Rapid Response Project (NASA/GSFC)
2
     State Environment Protection Policy (Ambient Air Quality) (SEPP), available        http://rapidfire.sci.gsfc.nasa.gov/ and Sentinel Hotspot information
     from www.epa.vic.gov.au/about_us/legislation/sepps.asp                             http://sentinel.ga.gov.au

4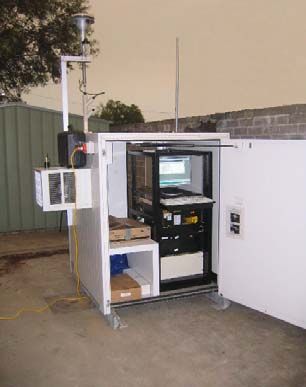
AIR QUALITY DURING THE 2006–07 VICTORIAN BUSHFIRES

The advisories (given in Appendix 1) help people to
make informed decisions and take appropriate action                           Indication of
                                                                               fire activity
on smoke-affected days. Further information is                               (red outlines)
available on the EPA 5 and DHS websites

                     Table 2: Smoke alert categories

    Smoke alert category                         Visibility (km)

              Low                  Greater than 10 km but less than 20 km

           Moderate                 Greater than 5 km but less than 10 km

              High                               Less than 5 km

              Refer to Appendix 1 for cautionary actions and advice.

3.       How can I find more information on air quality?
More information on air quality, including real-time
information and 24-hour summaries, can be found on                           Figure 5: Bushfire smoke transport over eastern
the EPA website 6. EPA issues twice-daily air quality                       Victoria under north-westerly winds, 18 December
bulletins and forecasts the expected air quality for the                    2006. Red outlines indicate fires (not actual size).
next 24 hours for Melbourne and Geelong. Forecasts                            EPA regional monitoring stations are shown by
and air quality summaries are also published daily in                        orange dots (Melbourne and Geelong not shown).
the weather sections of The Age and Herald Sun                                (Images courtesy of MODIS Rapid Response Project at
newspapers.                                                                                       NASA/GSFC)

HOW WAS VICTORIA’S AIR QUALITY
AFFECTED?                                                                   2.   Particle pollution
                                                                            All monitored regions experienced high levels of
1.       What areas were affected by smoke?                                 particle pollution as a direct result of the bushfires
                                                                            (Figure 7). The maximum PM10 particle levels recorded
A significant part of Victoria was affected by smoke                        were up to five times greater than the objective of
from the bushfires. Prevailing winds and local weather                      50 µg/m3 (Table 3).
patterns determined which areas were affected on a
day-by-day basis.                                                           The greatest impacts were seen in north-east Victoria
                                                                            and the Latrobe Valley, which were closest to the fires.
Due to the location of the fires, Melbourne and                             In a typical summer, Melbourne would expect to have
Geelong were predominantly impacted by bushfire                             only one or two days of high PM10 particle pollution.
smoke when the winds were easterly. North-eastern
Victoria was impacted by smoke under southerly                              Fine particle pollution also heavily affected local
winds, while the Latrobe Valley and East Gippsland                          visibility in all regions (Figure 8). North-east Victoria
were impacted by smoke under northerly winds                                experienced nine consecutive days of poor visibility
(Figure 5). Warrnambool was also affected by smoke                          (below 20 km of visual distance) from 13—21 December.
from fires in King Island and Tasmania during                               These extended periods heavily impacted on daily
February. The MODIS satellite images below show the                         activities in the smoke-affected areas. The poorest
extent of smoke across Melbourne and eastern                                visibility was recorded in Wangaratta on 13 December
Victoria on 9 January 2007 (Figure 6). These photos                         with local visibility being reduced to approximately
also show the difference between clouds and smoke as                        400 m (Table 3).
observed from satellite imagery.

5
     Further information on ‘Bushfires and Air Quality’ is available at
     www.epa.vic.gov.au/air/bushfires/
6
     EPA air quality bulletins are available at
     www.epa.vic.gov.au/air/bulletins/default.asp

                                                                                                                                    5
AIR QUALITY DURING THE 2006–07 VICTORIAN BUSHFIRES
Smoke
Clouds
Figure 6: Satellite images of smoke from fires in north-eastern Victoria:
a) Clear skies over Melbourne, 6 December 2006 b) Bushfire smoke over Melbourne, 9 January 2007
(Images courtesy of MODIS Rapid Response Project at NASA/GSFC)
Table 3: Number of high days of particle pollution for each monitored region between 1 December 2006 and 31 January 2007.
High PM10 days are days greater than 50 μg/m3. Poor visibility days are days of visibility less than 20 km.
PM10 Visibility Reduction
Number of high Highest 24-hour average PM10 Number of poor Minimum visibility
Region PM10 days reading (µg/m3) visibility days (km)
NE Victoria
17 213 µg/m3 (19-Dec-06) 23 0.4 (13-Dec-06)
(Wangaratta)
Latrobe Valley 16 254 µg/m3 (14-Dec-06) 20 0.5 (21-Dec-06)
Melbourne 15 220 µg/m (20-Dec-06)
3
24 1.2 (10 Jan-07)
Geelong 11 116 µg/m (22-Dec-06)
3
15 1.9 (21-Dec-06)
East Gippsland
9 194 µg/m3 (14-Dec-06) Not monitored Not monitored
(Bairnsdale)
SW Victoria
3 67 µg/m3 (21-Dec-06) 7* 4.7 (10-Jan-07)
(Warrnambool)
* Visibility did not meet the objective on a further three days at Warrnambool due to fires burning in Tasmania and King Island in February 2007.
6AIR QUALITY DURING THE 2006–07 VICTORIAN BUSHFIRES
300
Melbourne
Latrobe Valley
250 Geelong
NE Victoria
Daily average PM10 (ug/m3)
East Gippsland
200 SW Victoria
150
100
Objective
(50 ug/m3)
50
0
01-Dec-06
05-Dec-06
09-Dec-06
13-Dec-06
17-Dec-06
21-Dec-06
25-Dec-06
29-Dec-06
02-Jan-07
06-Jan-07
10-Jan-07
14-Jan-07
18-Jan-07
22-Jan-07
26-Jan-07
30-Jan-07
Day
Figure 7: Highest daily average PM10 for each region during December 2006 and
January 2007. Extended periods above the objective due to bushfire smoke occurred
between 9 and 22 December 2006 for all regions.
1000
Melbourne
Good Visibility
Latrobe Valley
Geelong
Daily Minimum 1-hour Visibility (km)
NE Victoria
100
10 Objective
(20km of
visibility)
Reduced Visibility
1
0
01-Dec-06
05-Dec-06
09-Dec-06
13-Dec-06
17-Dec-06
21-Dec-06
25-Dec-06
29-Dec-06
02-Jan-07
06-Jan-07
10-Jan-07
14-Jan-07
18-Jan-07
22-Jan-07
26-Jan-07
30-Jan-07
Day
Figure 8: Minimum daily visibility for each region during December 2006 and January 2007.
7AIR QUALITY DURING THE 2006–07 VICTORIAN BUSHFIRES
Table 4: Number of high ozone days (one-hour average
3. Ozone (O3) greater than 100 ppb) and highest recorded value for
Melbourne, Geelong and the Latrobe Valley all each monitored region between 1 December 2006 and 31
experienced high levels of ozone as a result of the January 2007.
bushfires (Figure 9). The highest 1-hourly ozone Number of Highest one-hourly
concentration (169 ppb) was recorded at Geelong on 9 days of high ozone concentration
December (Table 4). This was the highest hourly ozone Region ozone (ppb)
concentration recorded in the Melbourne and Geelong
region since 1993 and the highest ever recorded at Melbourne 4 138 (20-Dec-06)
EPA’s Geelong monitoring station.
Latrobe Valley 4 138 (10-Dec-06)
In the Latrobe Valley region four days were monitored
above the ozone objective. These were the first ever Geelong 2 169 (09-Dec-06)
recorded at EPA’s Latrobe Valley monitoring stations.
NE Victoria
0 91 (19-Dec-06)
(Wangaratta)
SW Victoria
0 65 (09-Dec-06)
(Warrnambool)
180
Melbourne
160 Latrobe Valley
Geelong
Daily Maximum 1-hour Ozone (ppb)
NE Victoria
140 SW Victoria
120 Hourly Objective
(100ppb)
100
80
60
40
20
0
01-Dec-06
05-Dec-06
09-Dec-06
13-Dec-06
17-Dec-06
21-Dec-06
25-Dec-06
29-Dec-06
02-Jan-07
06-Jan-07
10-Jan-07
14-Jan-07
18-Jan-07
22-Jan-07
26-Jan-07
30-Jan-07
Day
Figure 9: Highest daily one-hour ozone (ppb) for each region during December 2006 and January 2007.
8AIR QUALITY DURING THE 2006–07 VICTORIAN BUSHFIRES
4. How did 2006–07 compare with the 2002–03 BUSHFIRES AND CLIMATE CHANGE
bushfires?
One of the predicted impacts of climate change is an
Both in duration and magnitude the 2006-07 bushfires increase in the number of severe fire weather days in
had a greater impact on Victoria’s air quality than the south-eastern Australia. This change is likely to result
2002-03 fires 7. The most recent bushfires impacted on in increased bushfire activity that can adversely
all regions for longer and resulted in more days that impact on Victoria’s air quality.
did not meet the air quality objectives (Table 5).
A recent report commissioned by The Climate Institute
Maximum concentrations of 24-hour PM10 were higher
of Australia indicates that south-eastern Australia is
in all regions during 2006—07 except for NE Victoria
likely to become hotter and drier in future as a result
(Wangaratta) (Table 6). Visibility was significantly
of climate change 8. There has been a general trend
reduced during the most recent fires, with the poorest
towards more fire weather in Victoria over the past 30
visibility being recorded in north-east Victoria
years, with the most severe fire weather on record
(Wangaratta).
occurring during the 1997, 2003 and 2007 summer
All regions were exposed to greater ozone levels seasons.
during the most recent fires. Geelong and the Latrobe
The report examined the potential impacts of climate
Valley both recorded high ozone levels during the
change on fire-weather at 17 sites in south-east
2006—07 fires. This was the first time that ozone has
Australia and found that the number of ‘very high’ and
not met the objective in the Latrobe Valley since EPA
extreme’ fire danger days could increase by as much
began monitoring in 1979. Geelong recorded its
as 4—25 per cent by 2020 and 15—70 per cent by
highest hourly averaged ozone concentration since
2050. The increase in fire activity and severity over
ozone monitoring began at that site in 1991.
the last few years, particularly the 2006—07 fire
season, provides an indication of how Victoria may be
impacted in the future.
Table 5: Comparison of the number of days not meeting the air quality objectives for each pollutant
during 2002–03 and 2006–07 bushfires.
Number of high days of PM10 Number of poor visibility days Number of high days of ozone
(above 50 µg/m3) (less than 20 km) (above 100 ppb)
Region 2002—03 2006—07 2002—03 2006—07 2002—03 2006—07
Melbourne 10 15 16 24 2 4
Geelong 6 11 9 15 0 2
Latrobe Valley 10 16 12 20 0 4
NE Victoria
16 17 Not monitored 23 Not monitored 0
(Wangaratta)
East Gippsland
Not monitored 9 Not monitored Not monitored Not monitored Not monitored
(Bairnsdale)
SW Victoria
Not monitored 3 Not monitored 7 Not monitored 0
(Warrnambool)
8
Lucas, Hennessy, Mills and Bathols (2007), Bushfire Weather in Southeastern
Australia: Recent Trends and Projected Climate Change Impacts. Consultancy
7
Air quality during Victorian bushfires of 2002—03, EPA publication SR5, is Report prepared for The Climate Institute of Australia, by Bushfire CRC,
available for download from the Publications section of EPA website, Australian Bureau of Meteorology and CSIRO Marine and Atmospheric
www.epa.vic.gov.au/publications. Research. Available at www.climateinstitute.org.au
9AIR QUALITY DURING THE 2006–07 VICTORIAN BUSHFIRES
Table 6: Comparison of levels recorded in each region for each pollutant during 2002–03 and 2006–07 bushfires.
Highest 24-hour average PM10 Minimum one-hour visibility Highest one-hour ozone concentration
(µg/m3) (km) (ppb)
Region 2002—03 2006—07 2002—03 2006—07 2002—03 2006—07
Melbourne 125 220 3.7 1.2 112 138
Geelong 112 116 4.6 1.9 81 169
Latrobe Valley 178 254 4.9 0.5 83 138
NE Victoria
276 213 Not monitored 0.4 Not monitored 91
(Wangaratta)
East Gippsland
Not monitored 194 Not monitored Not monitored Not monitored Not monitored
(Bairnsdale)
SW Victoria
Not monitored 67 Not monitored 4.7 Not monitored 65
(Warrnambool)
SUMMARY ACKNOWLEDGEMENTS
Both in duration and magnitude the 2006—07 EPA Victoria would like to acknowledge the work and
bushfires had a greater impact on Victoria’s air quality support provided by the Bureau of Meteorology, DHS,
than the 2002—03 fires. Particles (PM10 and visibility) DSE and other emergency services during the
and ozone levels were all significantly elevated in all bushfires. In particular, EPA thanks the Wangaratta
monitored regions, and record levels were recorded as Police and Bairnsdale DHS for allowing the mobile
a result of bushfire smoke during December 2006 and monitoring stations to be housed at their offices.
January 2007. Climate change predictions indicate
that bushfire frequency and intensity will increase in
Victoria, increasing the potential for major air quality
impacts to be experienced across the state.
EPA Victoria expanded its monitoring network and
worked closely with numerous state and
commonwealth agencies to provide regular updates to
the media and general public on air pollution levels,
including advice to the community on measures to
reduce the impact of bushfire smoke on their health.
EPA is working with the Department of Human
Services to better understand the health effects
experienced by the Victorian community as a result of
the bushfires.
Further information on bushfires and air quality can be
found on the EPA website at:
www.epa.vic.gov.au/air/bushfires
10AIR QUALITY DURING THE 2006–07 VICTORIAN BUSHFIRES
APPENDIX 1: SMOKE ALERT CATEGORIES, POTENTIAL HEALTH EFFECTS AND CAUTIONARY ACTIONS
ADVISORIES ISSUED DURING THE 2006–07 BUSHFIRE SEASON
Smoke alert and
Potential health effects and cautionary actions
air quality categories
Likelihood of respiratory symptoms and aggravation of pre-existing heart or lung conditions such as asthma. Sensitive groups include people with heart or lung conditions, children and
Smoke alert category: the elderly.
Low
Cautionary actions
Sensitive groups:
Air quality: People with lung or heart conditions, the elderly, and children should:
Unhealthy for sensitive groups • limit prolonged or heavy physical activity
• limit time spent outdoors in the smoke (when possible)
• asthmatics — follow your personal asthma management plan
• take medication as prescribed, and pay attention for symptoms
• seek medical advice if symptoms occur.
Increased likelihood of respiratory symptoms and aggravation of pre-existing heart or lung conditions such as asthma. Likelihood of respiratory symptoms in the general population.
Smoke alert category:
Cautionary actions
Moderate
Sensitive groups:
People with lung or heart conditions, the elderly and children should:
Air quality: • avoid prolonged or heavy physical activity
Unhealthy (all) • stay indoors (when possible)
• asthmatics — follow your personal asthma management plan
• take medication as prescribed, and pay attention for symptoms
• seek medical advice if symptoms occur.
General population:
• Limit prolonged or heavy physical activity.
• Limit time spent outdoors in the smoke (when possible).
• Anyone experiencing breathing problems or chest pains should seek medical advice.
Everyone:
• If your home gets too hot to be comfortable, or is letting in outside air, and it is safe to do so, consider leaving the area until the smoke clears.
• Shopping centres and local community facilities (e.g., libraries) can provide short-term relief from smoke and heat.
• When travelling in your car, switch the air conditioner to recycle to reduce smoke.
• Take medication with you.
11AIR QUALITY DURING THE 2006–07 VICTORIAN BUSHFIRES
Smoke alert and
Potential health effects and cautionary actions
air quality categories
Significant increase in respiratory symptoms and aggravation of lung or heart conditions such as asthma. Increasing likelihood of respiratory effects in the general population.
Smoke alert category:
Cautionary actions
High
Everyone:
• Avoid prolonged or heavy physical activity.
Air quality: • Stay indoors (when possible).
Very Unhealthy (all) • Outdoor sporting events should be postponed.
• If your home gets too hot to be comfortable, or is letting in outside air, and it is safe to do so — consider leaving the area until the smoke clears.
• Shopping centres and local community facilities (eg. libraries) can provide short-term relief from smoke and heat.
• When travelling in your car, switch the air conditioner to recycle to reduce smoke.
• Seek medical advice if symptoms occur.
Anyone experiencing breathing problems or chest pains should seek medical advice immediately.
Serious aggravation of heart or lung conditions. People with cardiopulmonary disease and the elderly are particularly at risk. Serious risk of respiratory effects in the general
Air quality:
population.
Hazardous (all)
Cautionary actions
Everyone should
• Avoid prolonged or heavy physical activity.
• Stay indoors (when possible).
• Outdoor sporting events should be postponed.
• If your home gets too hot to be comfortable, or is letting in outside air, and it is safe to do so — consider leaving the area until the smoke clears.
• Shopping centres and local community facilities (e.g., libraries) can provide short-term relief from smoke and heat.
• When travelling in your car, switch the air conditioner to recycle to reduce smoke.
Anyone experiencing breathing problems or chest pains should seek medical advice immediately.
Bushfire smoke advice is available at www.epa.vic.gov.au/air/bushfires
12You can also read