Air quality in Montréal - Service de l'environnement Environmental Assessment Report 2019
←
→
Page content transcription
If your browser does not render page correctly, please read the page content below

Environmental Assessment Report 2019

Air quality
in Montréal
Service de l’environnement
Air Quality Monitoring
RSQA Monitoring Stations on
the Island of Montréal in 2019 Rivière-des-Prairies
NOx O3 CO PM2.5 PM10
COV HAP CÉ
55
Fire Station 17
Montréal-Nord
NOx O3 CO PM2.5
PM10 PST Anjou
17 3
NOx O3 SO2 PM2.5
Saint-Jean-Baptiste
PM10 PST COV
6 RDP-PAT
Métaux NOx O3 SO2
PM2.5 PM10 PST COV
Saint-Joseph
Rosemont-La Petite-Patrie
Sainte-Anne-de-Bellevue Décarie Interchange
NOx O3 SO2 PM2.5
NOx O3 SO2 PM2.5 Mont-Royal
PM10 PST COV NOx O3 CO PM2.5
PM 10 PST COV 80 Hochelaga-Maisonneuve
Montréal Airport
99 Dorval PM10 PST PM2.5 PM10 PST
28 50
NOx O3 CO PM2.5 COV
66
St-Dominique, Ville-Marie
31 NOx O3 CO SO2 PM2.5 COV
Notre-Dame, Le Sud-Ouest
BC Black Carbon 101
NOx PM2.5 PM10 PST COV HAP Richelieu, Le Sud-Ouest
Pollutants measured
CO Carbon Monoxide 102
NO X Nitrogen Monoxide and Dioxide PM2.5 PM10 PST HAP
O3 Ozone 104 103
Saint-Patrick, Le Sud-Ouest
PAH Polycyclic aromatic hydrocarbon York/Roberval, Le Sud-Ouest
PM2.5 Particulate Matter (diameter < 2.5 microns) PM2.5 PM10 PST HAP NOx O3 PM2.5 PM10
PM10 Particulate Matter (diameter < 10 microns) PST HAP
SO2 Sulphur Dioxide RSQA monitoring station
TSP Total Suspended Particulates
VOC Volatile Organic Compounds Turcot project monitoring station
The Network’s Mission
In keeping with its mandate, the Réseau de surveillance de la qualité de l’air (RSQA) measures concentrations
of pollutants in the ambient air in order to take stock of the situation on the territory of the agglomeration of
Montréal. The results for fine particulate matter (PM2.5), ozone (O3), sulphur dioxide (SO2), nitrogen oxides (NOx)
and carbon monoxide (CO) are available in real time and can be consulted on the RSQA’s Web site at rsqa.qc.ca.
Other measures and analyses are also conducted according to the sampling program of Environment and Climate
Change Canada’s (ECCC) National Air Pollution Surveillance (NAPS) Program, to which it belongs.
Team
The RSQA team is comprised of nine persons who ensure themselves of the accuracy of the measures taken by
the analyzers as well as the validation of the many results collected. The team combines the expertise of a section
head, a chemist, a research officer, a technical officer and five environmental technicians. All participate in the
Quality Assurance/Quality Control (QA/QC) program that will officially be validated in 2020 in order to comply
with the new NAPS Program guidelines.
2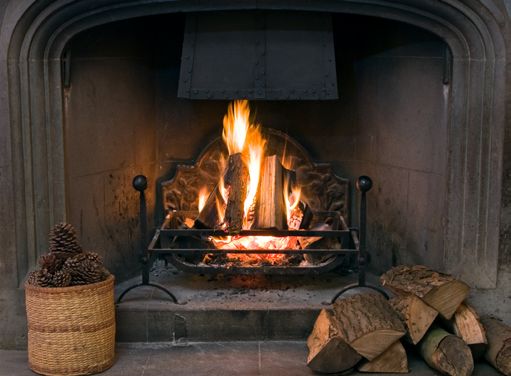
The NAPS Program is 50 years old!
The NAPS Program celebrated its 50th anniversary in 2019.
Since its inception in 1969, the NAPS Program has changed
significantly, but its mandate remains the same: provide
reliable long term data on ambient air quality in Canada
that meet stringent quality standards. The data generated
help support the regulations, programs and research dealing
with air quality. The NAPS Program is comprised of some
260 stations throughout Canada managed by provincial and
territorial governments. Did you know that Ville de Montréal
and Metro Vancouver are the only entities that manage
their own air quality monitoring networks? These innovative
entities had taken responsibility for the monitoring of air
quality on their territories before the provinces adopted
legislation in this regard. The RSQA ensures that it complies
with the NAPS Program guidelines on air quality monitoring
in order to provide the population with reliable data.

Equipment
In 2019, the number of air quality monitoring stations
decreased to 14 with the closing of station 7. The renovations
and redevelopment of the Chénier Arena property no longer
allowed the station to pursue its activities on that site. In the
fall, the instruments were transferred less than 2 km away,
to station 6-Anjou, located at 7650 Châteauneuf Blvd. (see
station 6 topo p.9).

These 14 monitoring stations are equipped with continuous
analyzers and samplers to intermittently measure air
pollutants. The data obtained are then subjected to a stringent
validation process. Some of the samples are sent to the Ville
de Montréal’s laboratory (VOC polar, anions and metals) while
others are sent to the ECCC’s laboratory in Ottawa (VOC non
polar, PAH, PM2.5). The RSQA processes a considerable number
of results annually, approximately one million data, which
explains why some of the results can only be made public a
few months after being collected.

 Type                                    Continuous analyzers             Intermittent samplers

 Number                                  54                               15

 Data                                    Hourly                           24 hrs (every 6 days)

                                         NOx, O3, SO2, CO, PM2.5, PM10,   VOC (polar and non polar), PAH,
 Pollutants measured
                                         TPM, VOC (BTEX), EC              PM2.5, PM10, TPM, metals, anions

 Number of annual data                   Almost 1 million                 Almost 100,000

                                                            3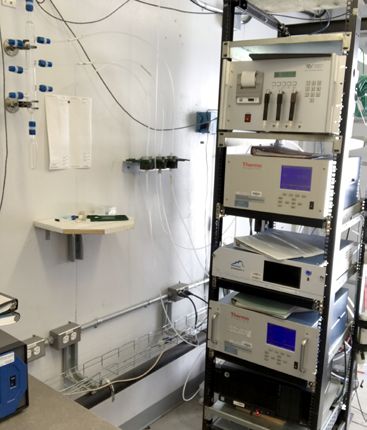
Portrait of Air Quality
A total of 43 days of poor air quality were recorded in 2019, of which 4 smog days were identified. As was the
case in 2018, fine particles were responsible for all the poor air quality days distributed over 11 months during the
year. However, the greatest number of poor air quality days were observed in the months of January, February
and March.

Poor air quality days by month in Montréal in 2019

10
 9
 8
 7
                       1
 6
 5
   9            9                                     1
 4
 3                     6                                                                     2
 2                                                    4
 1                                             2                              2     2        2
                                      1                        1     1
 0
   J            F      M        A     M        J      J        A     S        O     N        D
                                Smog                Other causes

The number of smog days has been declining since 2014, whereas the number of poor air quality days has
been increasing in Montréal since 2016. A study published in 2019 has shown that fine particle pollution levels
have increased by 5.5% from 2016 to 2018 due to the smoke of forest fires, a growing economy and the lax
application of the Clean Air Act1. Given that the air knows no boundaries, this increase has had an impact on
the concentrations observed in Montréal, which may partially explain the increase in fine particles observed
since 2016.

Poor air quality days in Montréal by year since 2014

70
60                         7
           10
50
40                                                                                       4
                                                                         6
30         53              57                             7
                                           8
20                                                                       35             39
                                                          27
10                                        21

  0
         2014           2015           2016            2017           2018             2019
                                Smog                Other causes

1 Karen Clay and Nicholas Z. Muller. Recent Inreases in Air Pollution: Evidence and Implications for Mortality. NBER Working Paper No. 26381, October 2019.
  https://www.nber.org/papers/w26381.

                                                                                   4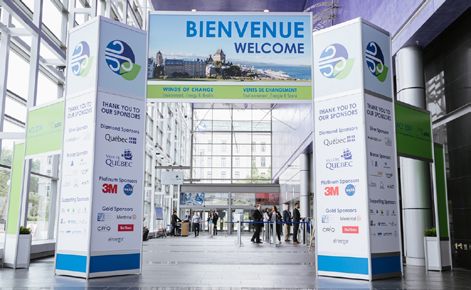
What is a poor air quality day?
   Based on established criteria, a day is deemed poor in terms of air quality as soon as fine particulate
   matter concentrations (PM2.5) exceed 35 µg/m3 for at least 3 hours in a given station. A poor air quality
   day is characterized as a smog day when concentrations of PM2.5 exceed 5 µg/m3 during at least 3 hours
   over more than 5% of the agglomeration’s territory. During a smog day, concentrations of PM2.5 generally
   remain high for 24 hours and sometimes longer.

Air Quality Index (AQI)
Ville de Montréal measures air quality using a numerical value called the “air quality index (AQI)”. The value of 50
of this index is attributed to the upper limit acceptable for each of the pollutants measured. The hourly index that
is posted is the greatest value of the sub-indices calculated for each of the five pollutants subjected to continuous
monitoring in the RSQA stations.

  The value of the index is defined as follows

     Good                    1 to 25

     Acceptable              26 to 50

     Poor                    51 or more

The index is calculated using the following formula: Index = (measure / standard or AQI value*) x 50
The calculation is based on the following schedule:

  Pollutant                               Type of measure               Standard                  AQI value*

                                             10-minute
  Sulphur dioxide (SO₂)                                                      -                    500 μg/m³
                                           moving average

  Carbon monoxide (CO)                          Hourly                  35 mg/m3                       -

  Ozone (O₃)                                    Hourly                  160 μg/m³                      -

  Nitrogen dioxide (NO₂)                        Hourly                  400 μg/m³                      -

                                           3-hour moving
  Respirable particles (PM2.5)                                               -                     35 μg/m³
                                              average

*Reference value used to calculate the air quality index.

                                                            5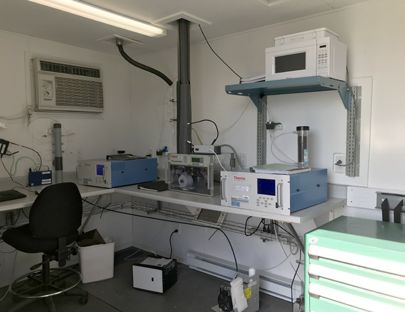
Air Quality Index (AQI) by
  Monitoring Station in 2019                                                                                                                9

                                                                                                                                    156 55
                                                                                                                                           200
                                                                                                                                                    5
                                                                                                     12

                                                                                                                                                 162 3
                                                                                                 155 17 198                                            198
                                                                                                                                        6   *

                                                                                                                    1
       3
                                                                                                              133
                                                                      1              17                             80              7
                                                                                                                         231
   151 99
            211                                                                                                                75
                                                                                 129 28
                                                                  155 66                  219                       3               50
                                                                           209                                                           269
                                                                                                          125
                                                                                                                    31
                                                                                                                         237
                                                                                                   19
                  Distribution of AQI Days

            Good               Acceptable                  Poor                                 142 103 202

      Only those stations that continuously measure fine
      particulate matter (PM 2.5 ) are shown.
      * Station 6: ignored as there are fewer than 75% of the
        data for the year

In 2019, in addition to the smog days, the events responsible for the poor air quality days are mainly related to
traffic (Décarie Exchange and Notre-Dame Street) and the construction work associated with the Turcot Project
(20 days, stations 28, 50 and 103), the Loto-Québec fireworks (1 day, station 50) and other human activities with
a local scope (18 days, all stations).

                                                                                 6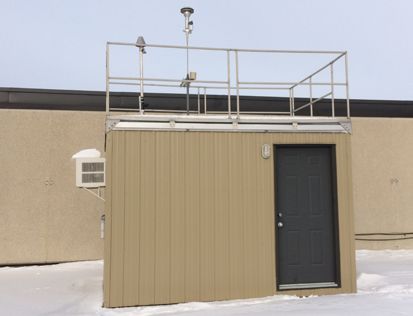
Dossier on the East End
of Montréal
Station 3 - Saint-Jean-Baptiste
The air quality in the East End of Montréal is an issue that again preoccupied Montrealers in 2019. Since
its commissioning in 1989 in the park on Saint-Jean-Baptiste Blvd., monitoring station 3 has never ceased
measuring atmospheric pollutants in the sector. Over the years, the measuring equipment has improved and the
station’s apparatus was enhanced, notably with the addition of a continuous BTEX analyzer (benzene, toluene,
ethylbenzene and xylene) and the monitoring of metals which was done every 5 years and is now done annually
since 2018.

  Measures at station 3

  Type of analysis          Pollutants measured

  Continuous                NOx, O3, SO2, PM2.5, VOC (non polar: BTEX)

  Intermittent              VOC (polar and non polar), PM10, TPM, metals, anions

Evolution 2000-2019 of the Air Quality in the East End
  Station 3 - Saint-Jean-Baptiste Blvd.
  Annual concentrations (hourly averages) in µg/m³

  Pollutant                           2000                          2019                       Evolution

  SO2                                  15.8                          3.0                         ↓ 81%

  O3                                   38.2                         48.8                         ↑ 28%

  NO2                                  28.1                         15.5                         ↓ 45%

  NO                                   17.3                          2.5                         ↓ 86%

  PM2.5                                8.9                           7.0                         ↓ 21%

As shown in the schedule of annual concentrations for the years 2000 to 2019, the main pollutants emitted by
industrial activities, wood burning and transportation, namely sulphur dioxide, nitrogen oxides and fine particles,
have strongly declined, whereas ozone is on the increase. Ozone is a secondary pollutant whose formation is
complex and influenced by the sun. As NOx decrease, a greater portion of radicals OH are available to react with
VOCs, leading to a greater formation of ozone, which explains the increase observed.

Except for ozone, air quality greatly improved in the East End of Montréal. With respect to SO2, the number of
poor air quality days due to the presence of that pollutant dropped from 13 days in 2006 to none since 2012,
an indication of the effectiveness of the measures implemented to control their emissions. As far as PM2.5 are
concerned, a significant decline of 21% is observed. Any decrease in the ambient concentrations of that pollutant
are a net gain for public health.

                                                         7
Air Quality in the East End Compared to that in the Rest
of the Island
      Comparison of the air quality in the East End of
      Montréal with that in the rest of the Island

                          50
                                           48,7   47,8

                          40
Concentrations in µg/m3

                          30

                          20
                                                                  18,2
                                                           15,4
                          10
                                                                                          6,9   7,2
                                                                                5,6
                               3,0   0,7                                  2,4
                           0
                                 SO2          O3             NO2            NO            PM2,5
                                                         Pollutants
                                             Station 3            Other stations

             Comparison between the annual average (hourly data) recorded at station 3
             and that of the other network stations.
             • Sulphur dioxide (SO2): three stations 31, 80, 99
             • Ozone (O3): eight stations 17, 28, 31, 55, 66, 80, 99, 103
             • Nitrogen oxides (NO2 et NO): nine stations 17, 28, 31, 55, 66, 80, 99, 102, 103
             • Fine particles (PM2,5): nine stations 17, 28, 31, 50, 55, 66, 80, 99, 103

As illustrated in the comparative graph of annual averages, the situation in the East End of Montréal is similar to
that in the stations of the rest of the Island. The concentrations of nitrogen oxides and of fine particles are slightly
lower than those measured in the other RSQA stations. The concentrations of ozone and of sulphur dioxide are
a little higher at station 3 compared to the other stations. However, ozone concentrations are inter-related with
those of nitrogen oxides. Consequently, given that the latter are lower at station 3, the quantity of ozone is
more important.

Despite a drop of 81% in SO2 from 2000 to 2019, the results indicate that concentrations of this pollutant are still
three times greater in the East End than in the rest of the Island. However, it needs to be said that their levels are
very low (traces) and are close to the detection limit of the 2.6 µg/m3 apparatus.

                                                                                      8
And What About Arsenic?
In 2019, arsenic was the subject of many articles in the media. The measuring of metals is done on particles of
a size smaller than 10 µm collected on filters over 24 hrs. The sources of arsenic in the ambient air are industrial
activities, the incineration of waste and the use of fossil fuels. However, at the onset, arsenic is a chemical
element naturally present in the environment. At station 3, the annual average of arsenic concentrations in 2019
was of 0.50 ng/m3, similar to the average recorded in the previous year (0.45 ng/m3).
In response to the recommendations of a notice by the Direction générale de la santé publique (DRSP) published
in September 2018 on arsenic emissions by Glencore Canada Corporation’s (CCR) copper refinery, the
establishment now measures arsenic concentrations in its own three air quality monitoring stations. These
measures are then forwarded to the DRSP in order to enable it to produce a new notice. It is worthwhile
mentioning that the 2018 notice indicated that the arsenic concentrations measured and modeled in the sectors
neighboring the refinery were too low for any health effects related to an environmental exposition to arsenic to
be observed among the people living near by.
Station 6 - Anjou
Station 6 located on the roof of Fire station 28 in Anjou was commissioned back in 1983. Analyses are still
conducted over a period of 24 hours every 6 days by high flow samplers. Following the closure of station
7-Chénier, its continuous monitoring instruments were transferred to the Anjou station in the fall of 2019. Toward
this end, the additional equipment required the complete renovation of an aedicule installed on its roof. PM10
and VOC analyses were also added. The results for O3, NOx, SO2 and PM2.5 are available in real time on the
RSQA’s Web site.
9Turcot Project
The monitoring of air quality within the framework of the Turcot Interchange project continued throughout the
year. In 2019, average daily concentrations of fine particulate matter (PM2.5) exceeded the standard of 30 µg/m3
set by the Ministère de l’Environnement et de la Lutte aux changements climatiques (MELCC) on only five occasions
at station 102, compared to 7 in 2018. An improvement was also observed in all other stations.
Exceedances of the Standard for Fine Particulate Matter (PM2.5)
Stations 101 102 103 104
Total 2016 1 13 1 3
Total 2017 0 4 0 1
Total 2018 2 7 2 3
Total 2019 1 5 1 0
In 2019, the milestones were related to the dismantlement of the last infrastructures, the installation of the
final beams and the progressive reopening of many sections of the Interchange. Although work is still ongoing in
the vicinity of the stations, the work site is declining in intensity and is reaching the end, as shown in the
lower results.
Air Quality Index (AQI) by Turcot Project Monitoring Station
in 2019
263 257
227
180
129
103
83 88
47
19 29 20
101 102 103 104
Monitoring stations
Number of AQI days Good Acceptable Poor
The data are available online on the Web site of the Ministère des Transports (MTQ) at
seti-media.com/infopopulation/rsqa_turcot.
10Wood Burning By-Law
The By-law concerning solid fuel-burning
devices and fireplaces (15–069), which
entered into force on August 24, 2015,
prohibited the use of any solid fuel burning
device on the territory of Ville de Montréal
during smog alerts. However, it is only
since October 1, 2018 that the second part
of the By-law entered into force, that part
forbidding the use of any solid fuel device
on the territory of Ville de Montréal, except
for devices recognized by an organization
identified in the Attachment of the By-
law, within a certification process (CSA/
B415.1-10 or EPA) confirming that it emits
no more than 2.5 g/hr of particles in the
Shutterstock
atmosphere.
Since the complete entry into force of the By-law on October 1, 2018, Ville de Montréal has ensured a follow-up
of complaints and reported cases on the 311 call line and conducted the inspections required. In cases of non-
compliance, the City sends notices of infraction and may prosecute offenders.
11Canadian Ambient Air Quality
Standards
Within the framework of the following comparative exercise, the averages are obtained by using the data of all
RSQA stations. The Canadian ambient air quality standards (CAAQS) are used for reference purposes only. Since
2017, the CAAQS deal with fine particulate matter (PM2.5), ozone (O3), sulphur dioxide (SO2) and nitrogen dioxide
(NO2). These standards are the core of the Air Quality Management System (AQMS) promoted by the Canadian
Council of Ministers of the Environment. These data are presented in micrograms per cubic metre (µg/m3) or parts
per billion (ppb).
Since 2013, an improvement in PM2.5 concentrations has been observed in Montréal’s ambient air. The situation is
similar to last year and the results are below the standards to be attained by 2020.
Fine Particulate Matter (PM2.5) Concentrations Expressed in µg/m3
3-year average of the annual 98th percentile of the daily 24-hour average concentrations
Canadian standard = 28 in 2015 and 27 in 2020
2013-2015 2014-2016 2015-2017 2016-2018 2017-2019
24 21 20 20 20
3-year average of the annual average concentrations
Canadian standard = 10 in 2015 and 8.8 in 2020
2013-2015 2014-2016 2015-2017 2016-2018 2017-2019
9.4 8.6 7.5 7.4 7.4
The recorded concentrations of ozone are lower than the Canadian standard for 2020. The trend is stable with
3-year averages fluctuating between 55 and 58 ppb between 2013 and 2019.
Ozone (O3) Concentrations Expressed in ppb
3-year average of the annual 4th highest daily maximum 8-hour average concentrations
Canadian standard = 63 in 2015 and 62 in 2020
2013-2015 2014-2016 2015-2017 2016-2018 2017-2019
55 56 58 57 55
Over the past 5 years, there has been an improvement in SO2 results. The concentrations of the two CAAQS are
compliant with the 2020 standards and there has been little or no variation since the preceding year.
12Sulphur Dioxide (SO2) Concentrations Expressed in ppb
3-year average of the annual 99th percentile of the daily maximum 1-hour average concentrations
Canadian standard = 70 in 2020 and 65 in 2025
2013-2015 2014-2016 2015-2017 2016-2018 2017-2019
23 21 18 17 17
Arithmetic average over a single calendar year of all 1-hour average concentrations
Canadian standard = 5.0 in 2020 and 4.0 in 2025
2013-2015 2014-2016 2015-2017 2016-2018 2017-2019
0.9 0.7 0.8 0.6 0.5
The 3-year averages for NO2 were stable between 2013 and 2019. The concentrations recorded in 2017-2019,
i.e. 46 ppb, were far below the Canadian standard for 2020, but just above the 2025 standard (42 ppb). And as
far as the annual average is concerned, it complies with the 2020 and 2025 standards. A slight decline in NO2
concentrations in the atmosphere was observed in 2019.
Nitrogen dioxide (NO2) Concentrations Expressed in ppb
3-year average of the annual 98th percentile of the daily maximum 1-hour average concentrations
Canadian standard = 60 in 2020 and 42 in 2025
2013-2015 2014-2016 2015-2017 2016-2018 2017-2019
46 45 45 45 46
Arithmetic average over a single calendar year of all 1-hour average concentrations
Canadian standard = 17 in 2020 and 12 in 2025
2013-2015 2014-2016 2015-2017 2016-2018 2017-2019
8.4 10.0 10.3 10.4 9.1
13Outreach
Awareness-Raising
Awareness-raising is a core priority of the Service de l’environnement. In 2019, the members of the RSQA team
were invited to participate in two public meetings on air quality in the East End of Montréal (February and
August). During the meetings, citizens were able to share their preoccupations and ask their questions relative to
air quality. The RSQA’s Web site was also presented and its content explained in order to enhance the sharing of
information.
In 2019, the RSQA Web site hosted 48,000 visitors and the month of July was the busiest (6,586 views).
Also, during the year, two groups of citizens were able to visit some of the monitoring stations of the network and
see for themselves the equipment and the tasks accomplished by the RSQA’s technical staff.
Conferences
The RSQA was involved in many conferences in
2019. For instance, the RSQA was invited to a
panel discussion entitled La nouvelle bataille de
l’air on the occasion of the prestigious Americana
conference held in March 2019.
Also, the RSQA gave a presentation during the
“Santé et qualité de l’air – Enjeu de société majeur”
conference organized by the Association pour la
prévention de la contamination de l’air et du sol
(APCAS), the Quebec chapter of the Air & Waste
Management Association (AWMA).
The RSQA was also part of the organizing committee of the AWMA’s 112th annual conference entitled “Winds
of change: Environment, Energy & Health” held in Quebec City in June 2019. This event attracted a majority of
the world’s leading experts in air quality. It provided a forum for the exchange of information while affording an
opportunity to enhance our knowledge in order to offer durable solutions to environmental issues. This was the
very first time that the conference was held in Quebec. The RSQA co-presided two technical sessions on air quality
entitled “Air quality monitoring: challenges and innovations PART I & II”. It presented the results of an analysis of
elemental carbon at station 55 - Rivières-des-Prairies, strongly influenced by wood heating.
The RSQA was also involved in the planning of a professional development workshop for women. This workshop
broached various subjects such as gender discrimination, raising awareness relative to mental health problems in
order to combat stigma, work-family balance and women in science following the #MeToo movement. All of these
events were highly successful and the conference was awarded the 2019 Event of the year prize by the Québec
City’s Ambassador Club.
14Overview
COVID-19: Impact of the Confinement on Air Quality
The RSQA continues to put its expertise to work for citizens by monitoring the quality of the air during the
confinement episode brought about by the COVID-19 pandemic.
This analysis of the confinement on air quality is done on three levels by using the data provided by the RSQA:
• At the ECCC level: exploitation of the data for all of Canada by the NAPS Program in order to exploit and publish
data at the national level.
• At the MELCC level: creation of a Web page that includes the evolution of NO2 at the level of the Province of
Québec.
• At the RSQA level: global exploitation (Island of Montréal) and fine exploitation (monitoring stations 3, 28 and
99) published on the Web site. The pollutants studied are: NO2, fine particulate matter and ozone. The period
covered runs from March 16 (beginning of the confinement) to April 13 inclusively (beginning of the cleaning of
streets). The analysis is available on the Web site at rsqa.qc.ca.
The confinement’s impact on the air quality of the Agglomeration of Montréal is positive. A reduction in air
pollution has been observed for the confinement period under review, i.e. from March 16 to April 13, 2020,
inclusively. The overall result can be summarized as follows:
• The average air quality index (AQI) for the different years over the same period is “good” (AQI ≤ 25). However,
an improvement of 10% during the confinement is observed for the AQI of 2020, compared to 2017-2019.
• An absence of poor air quality days in 2020, whereas for the same period, the average number of days varies
historically between 1 and 8.
• A significant decrease in nitrogen doxide (NO2) and fine particles (PM2.5), both of which are pollutants whose
major source of emissions is transportation.
• Concentrations of ozone (O3), a secondary pollutant, have slightly risen. Indeed, ozone is formed under
warm and sunny conditions owing to chemical reactions between nitrogen oxides (NOx) and volatile organic
compounds (VOC), caused by strong road traffic density.
An improvement in air quality has come about through changes in our individual and collective practices. The
confinement period provides evidence to that effect.
15Coming in 2020
The RSQA measures ambient air quality according to a well established sampling program and maintains
standards of the highest quality. Certain novelties will be deployed shortly in the network:
• the introduction of continuous monitoring instruments for hydrogen sulfide (H2S);
• the introduction of continuous monitoring instruments for ultrafine particles (UFP) or nanoparticles
(≤0.1 µm in diameter);
• the introduction of metal analyses on filters of PM10 at 2 stations on a permanent basis.
Production
Ville de Montréal
Service de l’environnement
Division du contrôle des rejets et suivi environnemental
Réseau de surveillance de la qualité de l’air (RSQA)
Information
environnement@ville.montreal.qc.ca
514 280-4330 ou 311
Photography
Ville de Montréal unless otherwise specified
Cover Shutterstock
Graphic design
2nd quarter 2019
ISSN 1925-6558 (print)
ISSN 1925-6566 (PDF)
Legal deposit – Bibliothèque et Archives nationales du Québec, 2019
Legal deposit – Library and Archives Canada, 2019
16You can also read