Air Quality Specialist Report for the Proposed Medupi Flue Gas Desulphurisation (FGD) Retrofit Project - Eskom
←
→
Page content transcription
If your browser does not render page correctly, please read the page content below

Air Quality Specialist Report for the Proposed Medupi Flue
 Gas Desulphurisation (FGD) Retrofit Project

 Project done on behalf of Zitholele Consulting

 Project Compiled by:
 R von Gruenewaldt
 L Burger
 G Kornelius

 Report No: 14ZIT10 | Date: February 2018

 Address: 480 Smuts Drive, Halfway Gardens | Postal: P O Box 5260, Halfway House, 1685
 Tel: +27 (0)11 805 1940 | Fax: +27 (0)11 805 7010
 www.airshed.co.za
Report Details

Report No. 14ZIT10
Status Rev 1
 Air Quality Specialist Report for the Proposed Medupi Flue Gas Desulphurisation (FGD)
Report Title
 Retrofit Project
Date December 2016
Client Zitholele Consulting
 Reneé von Gruenewaldt (Pr. Sci. Nat.). MSc (University of Pretoria)
Prepared by Lucian Burger. PHD (University of Natal)
 Gerrit Kornelius. PHD (University of Pretoria)
 Airshed Planning Professionals (Pty) Ltd is a consulting company located in Midrand, South
 Africa, specialising in all aspects of air quality, ranging from nearby neighbourhood concerns
Notice to regional air pollution impacts as well as noise impact assessments. The company
 originated in 1990 as Environmental Management Services, which amalgamated with its
 sister company, Matrix Environmental Consultants, in 2003.
 Airshed is an independent consulting firm with no interest in the project other than to fulfil the
Declaration contract between the client and the consultant for delivery of specialised services as
 stipulated in the terms of reference.
 Unless otherwise noted, the copyright in all text and other matter (including the manner of
 presentation) is the exclusive property of Airshed Planning Professionals (Pty) Ltd. It is a
Copyright Warning
 criminal offence to reproduce and/or use, without written consent, any matter, technical
 procedure and/or technique contained in this document.

 Air Quality Specialist Report for the Proposed Medupi Flue Gas Desulphurisation (FGD) Retrofit Project
Report No.: 14ZIT10 i

Revision Record

Revision Number Date Reason for Revision
Draft 27 February 2015 Client review
Draft 2 March 2015 Minor grammatical changes
Rev 0.2 27 March 2015 Inclusion of additional information
Rev 0.3 16 April 2015 Incorporation of comments received
 by the client
Rev 0.4 7 May 2015 Incorporation of second round of
 comments received by the client
Rev 0.5 11 May 2015 Incorporation of third round of
 comments received by the client
Rev 0.6 11 May 2015 Incorporation of minor comments
 received by the client
Rev 0.7 24 November 2016 Inclusion of additional information
 regarding the waste disposal of the
 gypsum, salts and sludge
Rev 0.8 5 December 2016 Minor grammatical changes
Rev 0.9 18 January 2018 Incorporation of changes to
 authorisation and licencing approach
 in 2017
Rev 1.0 7 February 2018 Incorporation of comments received
 by the client

 Air Quality Specialist Report for the Proposed Medupi Flue Gas Desulphurisation (FGD) Retrofit Project
Report No.: 14ZIT10 ii
List of Abbreviations

AQA Air quality act
APCS Air pollution control systems
ARM Ambient Ratio Method
As Arsenic
Cd Cadmium
Co Cobalt
CO Carbon monoxide
CO2 Carbon dioxide
Cr Chromium
Cu Copper
DEA Department of Environmental Affairs
ESP Electro static precipitator
g Gram
g/s Gram per second
HCl Hydrogen chloride
Hg Mercury
HNO3 Nitric acid
HF Hydrogen fluoride
LMo Monin-Obukhov length
m Meter
m² Meter squared
m³ Meter cubed
m/s Meters per second
Mn Manganese
NAAQS National ambient air quality standards
NH3 Ammonia
Ni Nickel
NO Nitrogen oxide
NO2 Nitrogen dioxide
NOx Oxides of nitrogen
O3 Ozone
OLM Ozone Limiting Method
PBL Planetary boundary layer
Pb Lead
PM Particulate matter
PM10 Particulate matter with diameter of less than 10 µm
PM2.5 Particulate matter with diameter of less than 2.5 µm
Sb Antimony
ppb Parts per billion
SO2 Sulfur dioxide
SO3 Sulfur trioxide
Tl Thalium
US EPA United States Environmental Protection Agency

 Air Quality Specialist Report for the Proposed Medupi Flue Gas Desulphurisation (FGD) Retrofit Project
Report No.: 14ZIT10 iii
V Vanadium
VOC Volatile organic concentrations
µ micro
°C Degrees Celsius

 Air Quality Specialist Report for the Proposed Medupi Flue Gas Desulphurisation (FGD) Retrofit Project
Report No.: 14ZIT10 iv

Glossary

 An area, bounded by topographical features, within which airborne contaminants
Airshed
 can be retained for an extended period
 A mathematical process or set of rules used for calculation or problem-solving,
Algorithm
 which is usually undertaken by a computer
 A piece of expert advice submitted to regulators to support a claim that adverse
Assessment of environmental
 effects will or will not occur as a result of an action, and usually developed in
effects
 accordance with section 88 of the Resource Management Act 1991
 The chemical changes that gases and particulates undergo after they are
Atmospheric chemistry
 discharged from a source
 A mathematical representation of the physics governing the dispersion of
Atmospheric dispersion model
 pollutants in the atmosphere
Atmospheric stability A measure of the propensity for vertical motion in the atmosphere

Calm / stagnation A period when wind speeds of less than 0.5 m/s persist
Cartesian grid A co-ordinate system whose axes are straight lines intersecting at right angles
Causality The relationship between cause and effect
 Terrain that contains features that cause deviations in direction and turbulence
Complex terrain
 from larger-scale wind flows
Configuring a model Setting the parameters within a model to perform the desired task

Convection Vertical movement of air generated by surface heating

Convective boundary layer The layer of the atmosphere containing convective air movements
 Clean air mixing with contaminated air through the process of molecular motion.
Diffusion
 Diffusion is a very slow process compared to turbulent mixing.
 The lowering of the concentration of pollutants by the combined processes of
Dispersion
 advection and diffusion
Dispersion coefficients Variables that describe the lateral and vertical spread of a plume or a puff

 Air Quality Specialist Report for the Proposed Medupi Flue Gas Desulphurisation (FGD) Retrofit Project
Report No.: 10ZIT10 v
Executive Summary

Airshed Planning Professionals (Pty) Limited was appointed by Zitholele Consulting to undertake an air quality impact
assessment for a proposed Medupi Flue Gas Desulphurisation (FGD) retrofit project (hereafter referred to as the Project). The
FGD retrofit project will reduce the sulphur dioxide (SO2) emissions from the power station by 84% on average, to ensure
compliance with an SO2 emission limit of 500 mg/Nm3 (at 10% O2).

The aim of the investigation is to quantify the possible impacts resulting from the proposed activities on the surrounding
environment and human health. To achieve this, a good understanding of the local dispersion potential of the site is necessary
and subsequently an understanding of existing sources of air pollution in the region and the resulting air quality.

Scope of Work

Confirmed scope of work includes assessment of the following activities and infrastructure:
 1. Construction and operation of a rail yard/siding to transport Limestone from a source defined point via the existing
 rail network to the Medupi Power Station and proposed rail yard / siding. The rail yard infrastructure will include
 storage of fuel (diesel) in above ground tanks and 15m deep excavation for tippler building infrastructure;
 2. Construction and operation of limestone storage area, preparation area, handling and transport via truck and
 conveyor to the FGD system located near the generation units of the Medupi Power Station;
 3. The construction and operation of the wet FGD system that will reduce the SO2 content in the flue gas emitted;
 4. Construction and operation of associated infrastructure required for operation of the FGD system and required
 services to ensure optimal functioning of the wet FGD system. The associated FGD infrastructure include a facility
 for storage of fuel (diesel), installation of storm water infrastructure and conservancy tanks for sewage;
 5. The handling, treatment and conveyance of gypsum and effluent from the gypsum dewatering plant.
 6. Pipeline for the transportation of waste water from the gypsum dewatering plant and its treatment at the waste water
 treatment plant (WWTP) that will be located close to the FGD infrastructure within the Medupi Power Station;
 7. Construction and operation of the WWTP;
 8. Management, handling, transport and storage of salts and sludge generated through the waste water treatment
 process at a temporary waste storage facility.
 9. The transportation of salts and sludge via trucks from the temporary waste storage facility to a final Waste Disposal
 Facility to be contracted by Eskom for the first 5 years of operation of the FGD system.
 10. Disposal of gypsum together with ash on the existing licenced ash disposal facility (ADF), with resulting increase in
 height of the ADF from 60m to 72m.

Study Approach and Methodology

The investigation followed the methodology required for a specialist report as prescribed in the Environmental Impact
Assessment (EIA) Regulations (Government Notice R.543 in Government Gazette 33306 of 18 June 2010).

 Air Quality Specialist Report for the Proposed Medupi Flue Gas Desulphurisation (FGD) Retrofit Project
 Report No.: 10ZIT10 vi

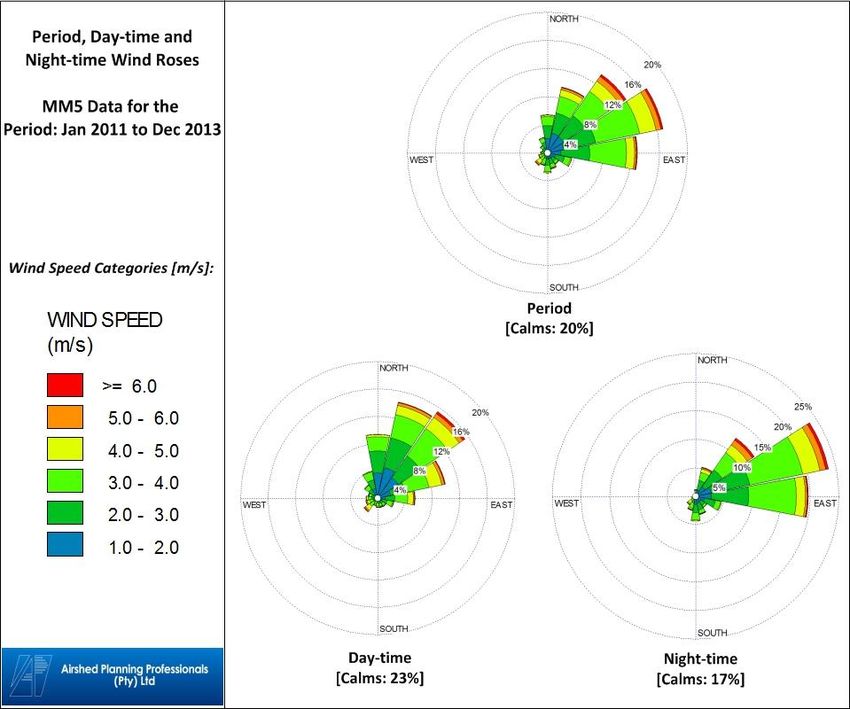
Potential Air Emissions from the Proposed Project

For the Air Quality Assessment initiated in 2014 the approach focussed on the impacts from the operation of the FGD (“the
Project”). The main pollutant that will be affected through the operations of the Project is SO2, as the FGD control aims at the
reduction of this pollutant. The emission concentrations of nitrogen dioxide (NO2) and particulate matter from the stack
releases was provided by Eskom personnel to remain the same with and without the control of FGD but the buoyancy of the
plume and its ability to disperse from the point of release will be altered due to changes in exit temperatures effecting the
ambient concentrations of the pollutant at ground level. The gypsum by-product will alter the potential wind-blown dust from
the ash storage facility (assuming the disposal of ash and gypsum together in an appropriate Class C facility) or may generate
additional dust from an independent disposal facility. For the current assessment, the assumption was made that the ash and
gypsum would be disposed of in a single facility.

Towards the middle of 2017 changes to the authorisation and licencing approach for the Medupi FGD Retrofit Project
applications were proposed in order to streamline the application processes to ensure compliance with the NEMAQA
compliance requirements by the year 2021. The changes that influence potential air emissions include the application for
activities associated with the construction and operation of the FGD system within the Medupi PS footprint and the railway
yard and siding, including limestone and gypsum handling facilities and diesel storage facilities new access roads. The impacts
from the construction activities were not assessed further as their impacts would be localised and of a temporary nature. The
impacts from the railway siding and handling operations as well as vehicle entrainment from the new access road would
contribute to the particulate matter. The diesel storage facility would contribute to volatile organic compounds. Impacts from
these activities, however, will be localised and will not exceed National Ambient Air Quality Standards offsite. These changes
were therefore not deemed significant and were thus not assessed further.

Baseline Assessment

The baseline study encompassed the analysis of meteorological data. Local meteorological data (including wind speed, wind
direction and temperature) was obtained from MM51 data for the period 2011 to 2013. The identification of sources of
emissions in the study area also formed part of the baseline assessment.

Two scenarios were assessed which consisted of (i) 2014 baseline (including operations of the Matimba Power Station) and
(ii) 2020 baseline (including the operations of the Matimba Power Station and the Medupi Power Station with all six units
excluding FGD).

Emissions Inventory

Emissions inventories provide the source input required for the simulation of ambient air concentrations. Windblown fugitive
source emissions from the ash disposal facilities were quantified. Point source emissions and parameters for the proposed
operations were provided by Eskom personnel.

1 The MM5 (short for Fifth-Generation Penn State/NCAR Mesoscale Model) is a regional mesoscale model used for creating weather
forecasts and climate projections. It is a community model maintained by Penn State University and the National Centre for Atmospheric
Research.
 Air Quality Specialist Report for the Proposed Medupi Flue Gas Desulphurisation (FGD) Retrofit Project
 Report No.: 10ZIT10 vii
Impact Prediction Study

SO2, NO2 and particulate concentrations due to the baseline and proposed operations were simulated using the
CALMET/CALPUFF dispersion modelling suite. Ambient concentrations were simulated to ascertain highest hourly, daily and
annual averaging levels occurring as a result of the baseline and proposed Project operations.

Three scenarios were assessed: (i) 2014 baseline: the potential impacts due to the Matimba Power Station operations, (ii)
2020 baseline: the potential impacts due to the Matimba Power Station operations and the Medupi Power Station operations
including all six units without FGD, and (iii) proposed Project operations: the potential impacts due to the Matimba Power
Station operations and the Medupi Power Station operations including all six units with FGD. The fugitive emissions due to
windblown dust from the disposal of ash and gypsum at the ash disposal facility was also quantified at the existing Ash
Disposal Facility (ADF) as an unmitigated operation (no controls in place) and as a mitigated operation (80% control efficiency
in place through active re-vegetation and wetting). Stack emissions and parameters were provided by Eskom personnel for
the study.

Assessment Criteria

For the current study, the impacts were assessed against published National Ambient Air Quality Standards (NAAQS).

Assumptions, Exclusions and Limitations

 • Emissions emanating from all existing sources in the area were not quantified nor were resultant ambient air pollutant
 concentrations due to such sources simulated, with the exception of the existing Matimba Power Station and its
 associated ashing operations. Given that Matimba Power Station is the most significant source of ambient SO2
 concentrations in the region, this study limitation is not significant for assessing compliance and health risk potentials
 due to SO2. Matimba Power Station is, however, not the major contributor to ambient fine particulate concentrations.
 In order to project cumulative particulate concentrations other significant sources, particularly local mining operation
 emissions, would need to be quantified.

 • Routine emissions from power station operations were estimated and modelled. Atmospheric releases occurring as
 a result of accidents were not accounted for.

 • For the current assessment, the assumption was made that the ash and gypsum would be disposed together in the
 same facility, until there is an opportunity in the market for alternative use of gypsum. The gypsum material on the
 disposal facility is expected to provide a crust when mixed with water. To what extent this material will crust will
 depend on how the material is disposed (i.e. mixed with the ash or deposited as layers of gypsum material in between
 the ash material) and how much water is added to the disposal facility. The crust may also be disturbed from time
 to time with activity on the disposal facility. For the current assessment, the effectiveness of this crust in lowering
 windblown emissions could not be quantified.

 • MM5 was used as the “initial guess” field for the CALMET model. Although two monitoring stations are located within
 the study area, MM5 could not be used together with the surface measurements as the Eskom-operated Marapong
 station is sited incorrectly providing questionable wind direction and, with one representative station (South African
 Weather Service Station located at Lephalale), CALMET requires 100% data availability which was not present.

The most important assumptions made during the air quality impact assessment are as follows:
 Air Quality Specialist Report for the Proposed Medupi Flue Gas Desulphurisation (FGD) Retrofit Project
 Report No.: 10ZIT10 viii
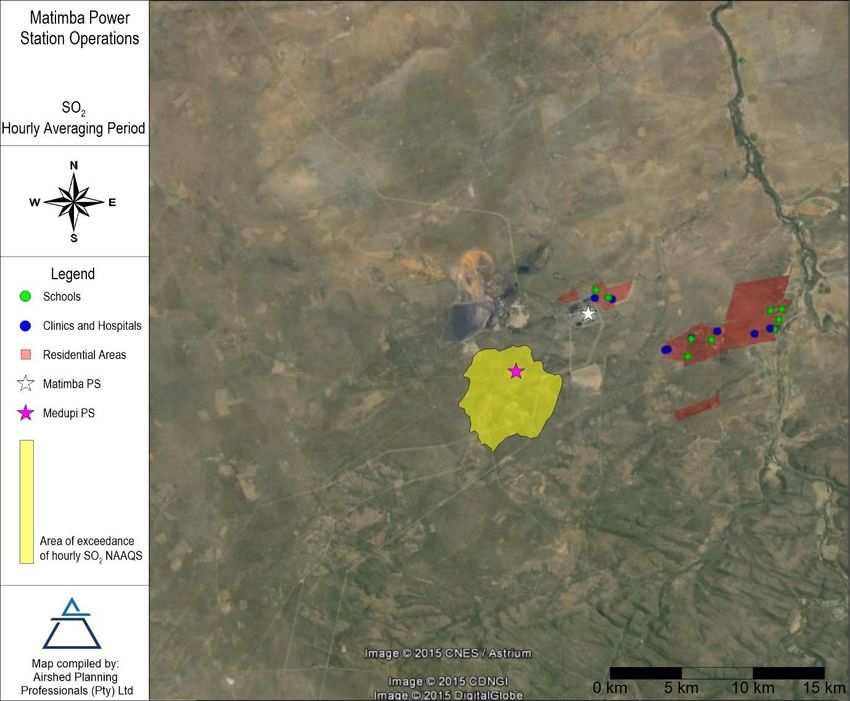
• Source parameters and emission rates for these emission scenarios required for input to the dispersion modelling
 study were provided by Eskom personnel. The assumption was made that this information was accurate and correct.

 • A constant NH3 background concentration of 20 ppb was used in Calpuff (Scorgie et al, 2006). Measured ozone
 data from the Marapong station was included for the background data required for the chemical transformation
 module in Calpuff.

Main Findings

The main findings from the baseline air quality characterisation study (prior to the operation of the Medupi Power Station),
which was based on information from both monitoring and modelling studies, are as follows:

 • SO2 concentrations have been measured to infrequently exceed short-term NAAQ limits at the monitoring stations
 located at Marapong and Lephalale. Modelled SO2 concentrations also indicate infrequent short-term exceedances
 of the NAAQ limits at these sensitive receptors. There is however compliance with the NAAQS.

 • Currently, the Matimba Power Station is likely to be the main contributing source to the ambient SO 2 ground level
 concentrations in the study area due to the magnitude of its emissions. Other sources which may contribute
 significantly due to their low release level include: spontaneous combustion of coal discards associated with mining
 operations, clamp firing emissions during brickmaking at Hanglip and potentially household fuel burning within
 Marapong. The highest ground level SO2 concentrations due to the Matimba Power Station stack emissions are
 expected to occur during unstable conditions, usually occurring during the day, when the plume is brought to ground
 in relatively close proximity to the power station.

 • NO2 concentrations have been measured to infrequently exceed short-term NAAQ limits (but are in compliance with
 NAAQS) at the monitoring stations located at Marapong and Lephalale, which is reiterated in the modelled results.
 Low level sources of NOx in the region include combustion within coal discard dumps, brick firing operations and
 possibly also household fuel burning and infrequent veld burning.

 • Measured PM10 concentrations exceed the daily NAAQS at Marapong for the period 2014 but are lower at Lephalale
 (where levels comply with daily NAAQS). The measured PM2.5 concentrations are within the daily NAAQS applicable
 till 2030 at Marapong and Lephalale, but exceed the more stringent daily NAAQS applicable in 2030. The annual
 average PM10 and PM2.5 concentrations measured at Lephalale are within NAAQS. Measured annual PM10
 concentrations at Marapong during the period 2013 exceed annual NAAQS.

 • 2014 Baseline simulations:
 o The contribution of Matimba Power Station to primary and secondary particulates was simulated, with no
 exceedances of the SO2, NO2, PM10 and PM2.5 NAAQS at Marapong and Lephalale. Secondary
 particulates form in the atmosphere through the conversion of SO x and NOx emissions to sulfate and
 nitrate.

 • 2020 Baseline simulations:
 o The area of non-compliance with the hourly and daily SO2 NAAQS extended ~30km southwest of the
 Medupi Power Station due to the cumulative operations of Matimba Power Station and Medupi Power

 Air Quality Specialist Report for the Proposed Medupi Flue Gas Desulphurisation (FGD) Retrofit Project
 Report No.: 10ZIT10 ix
Station without FGD control. Non-compliance with the hourly and daily SO2 NAAQS was simulated at the
 residential settlement to the northwest of the Matimba Power Station under these conditions.

 • Various local (informed through observation from site visits) and far-field (informed by literature) sources are
 expected to contribute to the suspended fine particulate concentrations in the region. Local dust sources include
 wind erosion from exposed areas, fugitive dust from mining and brickmaking operations, vehicle entrainment from
 roadways and veld burning. Household fuel burning may also constitute a local source of low-level emissions. Long-
 range transport of particulates emitted from remote tall stacks and from biomass burning in countries to the north of
 Republic of South Africa (RSA) and the accumulation and recirculation of such regional air masses over the interior
 is well documented (Andreae et al., 1996; Garstang et al., 1996; Piketh, 1996) (detail pertaining to the recirculation
 of air masses is provided in Section 3.3.1.9).

The main findings of the impact assessment for the proposed Project are provided as follows:

 • The area of exceedance of the hourly and daily SO2 NAAQS was significantly reduced when FGD controls on the
 Medupi Power Station are considered, bringing the simulated ground level concentrations within compliance of the
 hourly and daily SO2 NAAQS at all sensitive receptors in the study area.

 • Simulated impacts from the Matimba Power Station and the Medupi Power Station without FGD (2020 baseline)
 was in non-compliance with SO2 NAAQS on a regional scale resulting in a MODERATE significance. The area of
 non-compliance of SO2 concentrations reduces significantly for proposed Project operations (i.e. Matimba Power
 Station operations and Medupi Power Station operations with FGD) and reduces the significance to LOW as no
 exceedances of the NAAQS are simulated at the closest sensitive receptors in the study area. No exceedances of
 the NAAQS for NO2, PM10 and PM2.5 were simulated at sensitive receptors due to proposed Project operations
 resulting in LOW significance. The available monitoring data shows that the PM10 concentrations are in non-
 compliance with the daily NAAQS at Marapong. Simulated impacts due to proposed Project operations, however,
 do not contribute significantly to current ambient particulate concentrations.

Recommendation

As the proposed Project operations will significantly reduce SO2 impacts from the Medupi Power Station, it is recommended
that the FGD Retrofit Project (including the increase in height of 12 m at the ADF) be implemented.

 Air Quality Specialist Report for the Proposed Medupi Flue Gas Desulphurisation (FGD) Retrofit Project
 Report No.: 10ZIT10 x
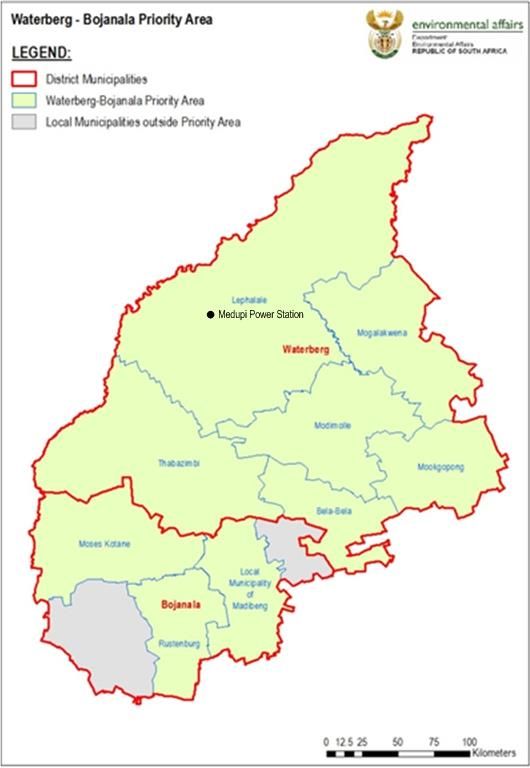
Table of Contents

1 Introduction....................................................................................................................................................................... 1

 1.1 Description of Project Activities from an Air Quality Perspective ............................................................................ 1
 1.2 Approach and Methodology .................................................................................................................................... 2
 1.2.1 Potential Air Emissions from the Proposed Project ........................................................................................... 2
 1.2.2 Regulatory Requirements and Assessment Criteria .......................................................................................... 2

 1.2.3 Description of the Baseline Environment ........................................................................................................... 3

 1.2.4 Existing Ambient Air Quality .............................................................................................................................. 3
 1.2.5 Emissions Inventory ........................................................................................................................................... 3

 1.2.6 Atmospheric Dispersion Modelling .................................................................................................................... 3

 1.3 Assumptions, Exclusions and Limitations ............................................................................................................... 8
 1.4 Outline of Report .................................................................................................................................................... 9
2 Regulatory Requirements and Assessment Criteria ...................................................................................................... 10

 2.1 Minimum Emission Standards .............................................................................................................................. 10

 2.2 National Ambient Air Quality Standards for Criteria Pollutants ............................................................................. 11

 2.3 Code of Practice for Air Dispersion Modelling in Air Quality Management in South Africa, 2014 ........................ 12

 2.4 Waterberg-Bojanala Priority Area ......................................................................................................................... 12

3 Description of the Receiving/Baseline Environment....................................................................................................... 14
 3.1 Air Quality Sensitive Receptors ............................................................................................................................ 14
 3.2 Atmospheric Dispersion Potential ......................................................................................................................... 14
 3.2.1 Surface Wind Field .......................................................................................................................................... 15

 3.2.2 Temperature .................................................................................................................................................... 16
 3.2.3 Atmospheric Stability ....................................................................................................................................... 16

 3.3 Status Quo Ambient Air Quality ............................................................................................................................ 17

 3.3.1 Atmospheric Emissions ................................................................................................................................... 17
 3.3.2 Measured Ambient Air Pollutant Concentrations ............................................................................................. 21
 3.3.3 Simulated Ambient Air Pollutant Concentrations ............................................................................................. 28

 3.3.4 Conclusions Regarding Baseline Air Quality ................................................................................................... 37
4 Impact of Proposed Project on Human Health ............................................................................................................... 39

 4.1 Atmospheric Emissions ........................................................................................................................................ 39

 4.2 Impact Assessment .............................................................................................................................................. 40

 4.2.1 Qualitative Assessment ................................................................................................................................... 40
 4.2.2 Quantitative Assessment ................................................................................................................................. 42
 4.3 Impact Significance Rating ................................................................................................................................... 45
 Air Quality Specialist Report for the Proposed Medupi Flue Gas Desulphurisation (FGD) Retrofit Project
 Report No.: 10ZIT10 xi
4.3.1 Existing Status ................................................................................................................................................. 45
 4.3.2 Cumulative Impact ........................................................................................................................................... 45
 4.3.3 Mitigation Measures ......................................................................................................................................... 45
 4.3.4 Residual Impact ............................................................................................................................................... 45

5 Conclusions .................................................................................................................................................................... 48
 5.1 Baseline Air Quality Study Findings ..................................................................................................................... 48
 5.2 Impact Assessment for Proposed Project ............................................................................................................ 49
 5.3 Recommendation ................................................................................................................................................. 49

6 References ..................................................................................................................................................................... 50
7 Appendix A - The NO2/NOx Conversion Ratios For NO2 Formation............................................................................... 52

8 Appendix B - Summary Of: Status Of Trace Element Emission In A Coal Combustion Process: A Review (Xua, et al.,
2003) ....................................................................................................................................................................................... 54

 Air Quality Specialist Report for the Proposed Medupi Flue Gas Desulphurisation (FGD) Retrofit Project
 Report No.: 10ZIT10 xii
List of Tables

Table 1-1: Summary description of CALPUFF/CALMET model suite with versions used in the investigation .......................... 5
Table 2-1: Subcategory 1.1: Solid fuel combustion installations .............................................................................................. 10
Table 2-2: National Ambient Air Quality Standards ................................................................................................................. 11
Table 3-1: Atmospheric Stability Classes ................................................................................................................................ 17
Table 3-2: Summary of the data availability and compliance with NAAQS for the ambient data measured at Lephalale ....... 24
Table 3-3: Summary of the data availability and compliance with NAAQS for the ambient data measured at Marapong ...... 27
Table 3-4: Stack parameters for the Matimba Power Station .................................................................................................. 28
Table 3-5: Annual emissions (in tonnes) for the Matimba Power Station operating conditions (as obtained from the Matimba
Atmospheric Impact Report (Zunckel & Raghunandan, 2014)) ............................................................................................... 28
Table 3-6: Particle size distribution for the ash dump .............................................................................................................. 29
Table 3-7: Stack parameters for the Medupi Power Station(a) ................................................................................................. 30
Table 3-8: Annual emissions (in tonnes) for Medupi Power Station operating conditions (as calculated based on information
provided by Eskom personnel) ................................................................................................................................................ 30
Table 3-9: Simulated SO2, NO2, PM10 and PM2.5 ground level concentrations at the closest sensitive receptors due to 2014
baseline and 2020 baseline operating conditions .................................................................................................................... 35
Table 4-1: Stack parameters for the Medupi Power Station(a) ................................................................................................. 39
Table 4-2: Annual emissions (in tonnes) for Medupi Power Station operating conditions (as calculated based on information
provided by Eskom personnel) ................................................................................................................................................ 39
Table 4-3: Simulated SO2, NO2, PM10 and PM2.5 ground level concentrations at the closest sensitive receptors due to Matimba
Power Station operations and Medupi with FGD ..................................................................................................................... 43
Table 4-4: Impact rating matrix for the proposed project operations ....................................................................................... 47

 Air Quality Specialist Report for the Proposed Medupi Flue Gas Desulphurisation (FGD) Retrofit Project
 Report No.: 10ZIT10 xiii
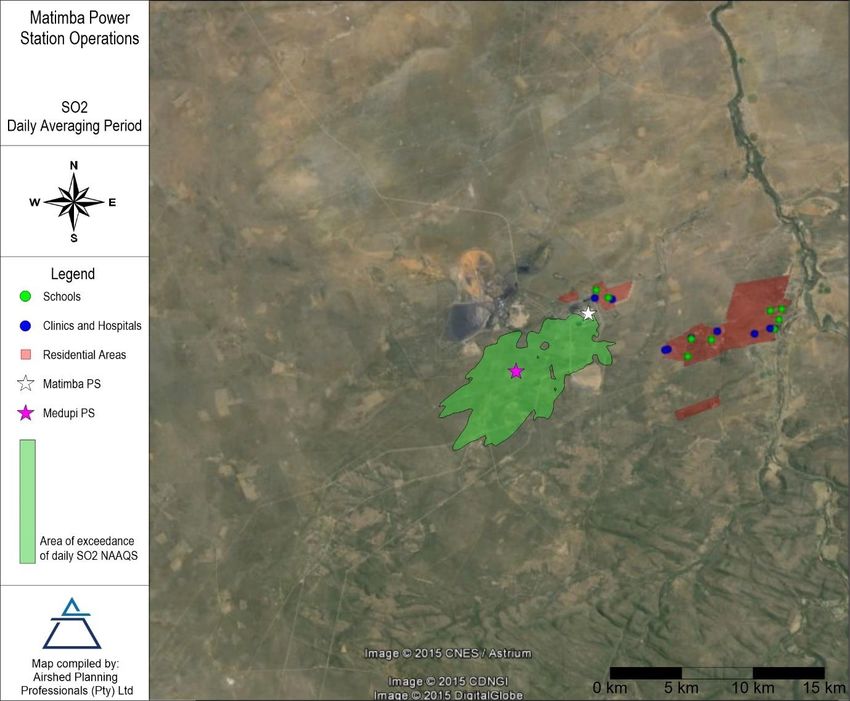
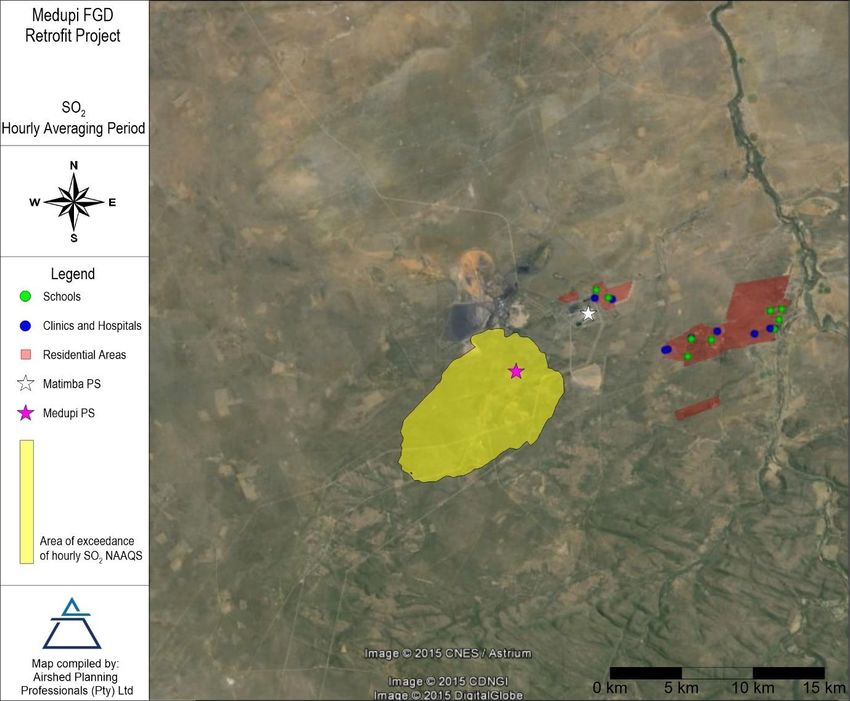
List of Figures

Figure 2-1: Location of the Medupi Power Station within the Waterberg-Bojanala Priority Area (Scott, 2012) ....................... 12
Figure 3-1: Location of sensitive receptors in the vicinity of the Medupi Power Station .......................................................... 14
Figure 3-2: Period, day- and night-time wind roses for the period 2011-2013 ......................................................................... 15
Figure 3-3: Monthly diurnal temperature averages for the Medupi Power Station Site (as extracted from MM5 data) ........... 16
Figure 3-4: Schematic representation of major low-level transport trajectory models likely to result easterly or westerly exiting
of material from southern African or in recirculation over the subcontinent (Tyson et al, 1996c) ............................................ 20
Figure 3-5: Hourly NO2 measured at the Lephalale monitoring station for the period January 2013 to November 2014 ........ 21
Figure 3-6: Daily PM10 measured at the Lephalale monitoring station for the period January 2013 to November 2014 ......... 22
Figure 3-7: Daily PM2.5 measured at the Lephalale monitoring station for the period January 2013 to November 2014 ........ 22
Figure 3-8: Hourly SO2 measured at the Lephalale monitoring station for the period January 2013 to November 2014 ........ 23
Figure 3-9: Daily SO2 measured at the Lephalale monitoring station for the period January 2013 to November 2014 .......... 23
Figure 3-10: Hourly NO2 measured at the Marapong monitoring station for the period January 2013 to November 2014 ..... 25
Figure 3-11: Daily PM10 measured at the Marapong monitoring station for the period January 2013 to November 2014 ...... 25
Figure 3-12: Daily PM2.5 measured at the Marapong monitoring station for the period January 2013 to November 2014 ...... 26
Figure 3-13: Hourly SO2 measured at the Marapong monitoring station for the period January 2013 to November 2014...... 26
Figure 3-14: Daily SO2 measured at the Marapong monitoring station for the period January 2013 to November 2014 ........ 27
Figure 3-15: Area of exceedance of the hourly SO2 NAAQS due to the 2014 baseline conditions ......................................... 32
Figure 3-16: Area of exceedance of the daily SO2 NAAQS due to the 2014 baseline conditions............................................ 33
Figure 3-17: Area of exceedance of the hourly SO2 NAAQS due to the 2020 baseline conditions ......................................... 34
Figure 3-18: Area of exceedance of the daily SO2 NAAQS due to the 2020 baseline conditions............................................ 35
Figure 4-1: Estimated highest daily and annual average PM10 ground level concentrations, due to vehicle entrainment, at set
distances from the emission source......................................................................................................................................... 41
Figure 4-2: Estimated highest daily and annual average PM2.5 ground level concentrations, due to vehicle entrainment, at set
distances from the emission source......................................................................................................................................... 41
Figure 4-3: Area of exceedance of the hourly SO2 NAAQS due to Matimba Power Station operations and Medupi with FGD
................................................................................................................................................................................................. 42
Figure 4-4: Area of exceedance of the daily SO2 NAAQS due to Matimba Power Station operations and Medupi with FGD 43

 Air Quality Specialist Report for the Proposed Medupi Flue Gas Desulphurisation (FGD) Retrofit Project
 Report No.: 10ZIT10 xiv
Air Quality Specialist Report for the Proposed Medupi Flue Gas
 Desulphurisation (FGD) Retrofit Project

1 INTRODUCTION

Airshed Planning Professionals (Pty) Limited was appointed by Zitholele Consulting to undertake an air quality impact
assessment for a proposed Medupi Flue Gas Desulphurisation (FGD) retrofit project (hereafter referred to as the Project). The
FGD retrofit project will reduce the sulphur dioxide (SO2) emissions from the power station by 84%.

The aim of the investigation is to quantify the possible impacts resulting from the proposed activities on the surrounding
environment and human health. To achieve this, a good understanding of the regional climate and local dispersion potential
of the site is necessary and subsequently an understanding of existing sources of air pollution in the region and the resulting
air quality is required.

Typical of specialist investigations conducted, the air quality investigation comprises both a baseline study and an impact
assessment. The baseline study includes the review of site-specific atmospheric dispersion potentials, and existing ambient
air quality in the region, in addition to the identification of potentially sensitive receptors. The ambient air quality impact
assessment comprised the establishment of an emissions inventory for the proposed activities, the simulation of ambient air
pollutant concentrations occurring due to Project operations, and the evaluation of the resultant potential for impacts and non-
compliance.

1.1 Description of Project Activities from an Air Quality Perspective

Confirmed scope of work includes assessment of the following activities and infrastructure:
 11. Construction and operation of a rail yard/siding to transport Limestone from a source defined point via the existing
 rail network to the Medupi Power Station and proposed rail yard / siding. The rail yard infrastructure will include
 storage of fuel (diesel) in above ground tanks and 15m deep excavation for tippler building infrastructure;
 12. Construction and operation of limestone storage area, preparation area, handling and transport via truck and
 conveyor to the FGD system located near the generation units of the Medupi Power Station;
 13. The construction and operation of the wet FGD system that will reduce the SO2 content in the flue gas emitted;
 14. Construction and operation of associated infrastructure required for operation of the FGD system and required
 services to ensure optimal functioning of the wet FGD system. The associated FGD infrastructure include a facility
 for storage of fuel (diesel), installation of storm water infrastructure and conservancy tanks for sewage;
 15. The handling, treatment and conveyance of gypsum and effluent from the gypsum dewatering plant.
 16. Pipeline for the transportation of waste water from the gypsum dewatering plant and its treatment at the waste water
 treatment plant (WWTP) that will be located close to the FGD infrastructure within the Medupi Power Station;
 17. Construction and operation of the WWTP;
 18. Management, handling, transport and storage of salts and sludge generated through the waste water treatment
 process at a temporary waste storage facility.
 19. The transportation of salts and sludge via trucks from the temporary waste storage facility to a final Waste Disposal
 Facility to be contracted by Eskom for the first 5 years of operation of the FGD system.
 20. Disposal of gypsum together with ash on the existing licenced ash disposal facility (ADF), with resulting increase in
 height of the ADF from 60m to 72m.

 Air Quality Specialist Report for the Proposed Medupi Flue Gas Desulphurisation (FGD) Retrofit Project
 Report No.: 10ZIT10 1
1.2 Approach and Methodology

The methodology followed in the assessment to quantify the air quality impacts associated with the proposed Project is
discussed below. The general tasks included:
 • The establishment of the baseline air quality (based on available information);
 • Quantification of air emissions from the proposed Project;
 • Discussion of meteorological parameters required to establish the atmospheric dispersion potential;
 • Calculation of the air concentrations from the proposed Project using a suitable atmospheric dispersion model;
 • Assessment of the significance of the impact through the comparison of simulated air concentrations with local
 National Ambient Air Quality Standards (for compliance).

1.2.1 Potential Air Emissions from the Proposed Project

For the Air Quality Assessment initiated in 2014 the approach focussed on the impacts from the operation of the FGD (“the
Project”). The main pollutant that will be affected through the operations of the Project is SO2, as the FGD control aims at the
reduction of this pollutant. The emission concentrations of nitrogen dioxide (NO 2) and particulate matter from the stack
releases was provided by Eskom personnel to remain the same with and without the control of FGD but the buoyancy of the
plume and its ability to disperse from the point of release will be altered due to changes in exit temperatures effecting the
ambient concentrations of the pollutant at ground level. The gypsum by-product will alter the potential wind-blown dust from
the ash storage facility (assuming the disposal of ash and gypsum together in an appropriate Class C facility) or may generate
additional dust from an independent disposal facility. For the current assessment, the assumption was made that the ash and
gypsum would be disposed of in a single facility.

Towards the middle of 2017 changes to the authorisation and licencing approach for the Medupi FGD Retrofit Project
applications were proposed in order to streamline the application processes to ensure compliance with the NEMAQA
compliance requirements by the year 2021. The changes that influence potential air emissions include the application for
activities associated with the construction and operation of the FGD system within the Medupi PS footprint and the railway
yard and siding, including limestone and gypsum handling facilities and diesel storage facilities new access roads. The impacts
from the construction activities were not assessed further as their impacts would be localised and of a temporary nature. The
impacts from the railway siding and handling operations as well as vehicle entrainment from the new access road would
contribute to the particulate matter. The diesel storage facility would contribute to volatile organic compounds. Impacts from
these activities, however, will be localised and will not exceed National Ambient Air Quality Standards offsite. These changes
were therefore not deemed significant and were thus not assessed further.

1.2.2 Regulatory Requirements and Assessment Criteria

In the evaluation of air emissions and ambient air quality impacts reference is made to National Ambient Air Quality Standards
(NAAQS) for compliance. These standards generally apply only to a number of common air pollutants, collectively known as
criteria pollutants. Criteria pollutants typically include SO2, NO2, carbon monoxide (CO), inhalable particulate matter (including
thoracic particulate matter with an aerodynamic diameter of equal to or less than 10 µm or PM10 and Inhalable particulate
matter with an aerodynamic diameter equal to or less than 2.5 µm or PM2.5), benzene, ozone and lead. For the proposed
Project, pollutants of concern included SO2, NO2, PM10 and PM2.5 (screened against NAAQS) and metals within the ash
deposition facility (screened against international health effect screening levels).

 Air Quality Specialist Report for the Proposed Medupi Flue Gas Desulphurisation (FGD) Retrofit Project
 Report No.: 10ZIT10 2
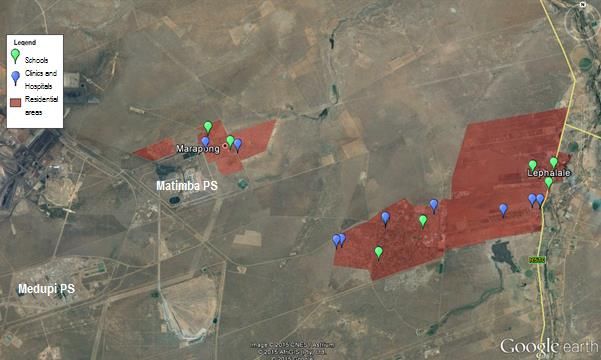
1.2.3 Description of the Baseline Environment

An understanding of the atmospheric dispersion potential of the area is essential to an air quality impact assessment. For this
assessment use was made of a numerical weather prediction model (Mesoscale Model version 5 (MM5 2)).

1.2.4 Existing Ambient Air Quality

The Department of Environmental Affairs (DEA) has an ambient air quality monitoring network for the Waterberg-Bojanala
Priority area consisting of stations located at Lephalale, Mokopane and Thabazimbi. The closest DEA managed monitoring
station to the proposed Project is in Lephalale (~12 km east). Eskom also operates an ambient monitoring station located in
Marapong (~8 km northeast of the Project). The monitored information from these two stations was used in the current
assessment.

1.2.5 Emissions Inventory

The establishment of a comprehensive emissions inventory formed the basis for the assessment of the air quality impacts
from proposed operations. Proposed Project operations will result in point and fugitive gaseous and particulate emissions.

Point sources are well defined with set parameters and emission concentrations. The information on the point sources was
provided by Eskom for use in the current assessment.

Fugitive emissions refer to emissions that are spatially distributed over a wide area. In the quantification of fugitive dust, use
was made of emission factors which associate the quantity of a pollutant to the activity associated with the release of that
pollutant. (Emission factors used are discussed in more detail in Section 3.3.3).

1.2.6 Atmospheric Dispersion Modelling

1.2.6.1 Dispersion Model Selection

Dispersion models compute ambient concentrations as a function of source configurations, emission strengths and
meteorological characteristics, thus providing a useful tool to ascertain the spatial and temporal patterns in the ground level
concentrations arising from the emissions of various sources. Increasing reliance has been placed on ground level air pollution
concentration estimates from models as the primary basis for environmental and health impact assessments, risk
assessments and determining emission control requirements. Care was therefore taken in the selection of a suitable dispersion
model for the task at hand. For the current study, it was decided to use the US Environmental Protection Agency’s CALMET
meteorological model and the CALPUFF dispersion model in combination.

Most regulatory dispersion models, such as the widely used AERMOD model, are based on the steady-state plume
assumption, with meteorological inputs for these models assuming a horizontally uniform flow field. Usually the winds are
derived from a single point measurement, which is often made at a nearby non-complex terrain site. The meteorological
processors for the regulatory models do not adjust the winds to reflect terrain effects. The steady-state flow fields either do
not or only partially reproduce the terrain-induced spatial variability in the wind field. In addition to which, the straight-line
trajectory assumption of the plume models cannot easily handle curved trajectories associated with terrain-induced deflection

2 The MM5 (short for Fifth-Generation Penn State/NCAR Mesoscale Model) is a regional mesoscale model used for creating weather
forecasts and climate projections. It is a community model maintained by Penn State University and the National Centre for Atmospheric
Research.
 Air Quality Specialist Report for the Proposed Medupi Flue Gas Desulphurisation (FGD) Retrofit Project
 Report No.: 10ZIT10 3
or channelling. These limitations of plume models can significantly affect the models ability to correctly represent the spatial
area of impact from sources in complex terrain, in addition to the magnitude of the peak values in certain instances.

CALPUFF is a regional Lagrangian Puff model intended for use on scales from tens of metres to hundreds of kilometres from
a source (US EPA 1998). A number of dispersion coefficients options are accommodated, including

 • stability‐based empirical relationships such as the Pasquill‐Gifford or McElroy‐Pooler dispersion coefficients;
 • turbulence‐based dispersion coefficients (based on measured standard deviations of the vertical and crosswind
 horizontal components of the wind); and
 • similarity theory to estimate the turbulent quantities using the micrometeorological variables calculated by CALMET.

The most desirable approach is to use turbulence‐based dispersion coefficients using measured turbulent velocity variances
or intensity components, if such data are readily available and they are of good quality. However, since reliable turbulent
measurements are generally not available, use can be made of the similarity approach.

CALPUFF also has the capability to model the effects of vertical wind shear by explicitly allowing different puffs to be
independently advected by their local average wind speed and direction, as well as by optionally allowing well‐mixed puffs to
split into two or more puffs when across-puff shear becomes important. Another option is to use a probability density function
(pdf) model to simulate vertical dispersion during convective conditions.

CALPUFF includes parameterized chemistry modules for the formation of secondary sulfate and nitrate from the oxidation of
the emitted primary pollutants, SO2 and NOx. The conversion processes are assumed to be linearly dependent (first‐order) on
the relevant primary species concentrations. Two options are included, namely the MESOPUFF II and RIVAD/ARM3 chemistry
options. In both options, a fairly simple stoichiometric thermodynamic model is used to estimate the partitioning of total
inorganic nitrate between gas‐phase nitric acid and particle‐phase ammonium nitrate. Ammonia and ozone concentrations
are required as background values to the model.

CALPUFF uses dry deposition velocities to calculate the dry deposition of gaseous and particulate pollutants to the surface.
These dry deposition velocities can either be user-specified or calculated internally in CALPUFF. A resistance‐based model
is used for the latter option. For gaseous pollutants, the resistances that are considered are the atmospheric resistance, the
deposition layer resistance, and the canopy resistance. For particles, a gravitational settling term is included and the canopy
resistance is assumed to be negligible. CALPUFF uses the scavenging coefficient approach to parameterize wet deposition
of gases and particles. The scavenging coefficient depends on pollutant characteristics (e.g., solubility and reactivity), as well
as the precipitation rate and type of precipitation. The model provides default values for the scavenging coefficient for various
species and two types of precipitation (liquid and frozen). These values may be overridden by the user.

The CALPUFF modelling system consists of a number of components, as summarised in Table 1-1. However only CALMET
and CALPUFF contain the simulation engines to calculate the three-dimensional atmospheric boundary layer conditions and
the dispersion and removal mechanisms of pollutants released into this boundary layer. The other codes are mainly used to
assist with the preparation of input and output data. Table 1-1 also includes the development versions of each of the codes
used in the investigation.

 Air Quality Specialist Report for the Proposed Medupi Flue Gas Desulphurisation (FGD) Retrofit Project
 Report No.: 10ZIT10 4
Table 1-1: Summary description of CALPUFF/CALMET model suite with versions used in the investigation
 Module Version Description
 CALMET v6.334 Three-dimensional, diagnostic meteorological model
 Non-steady-state Gaussian puff dispersion model with chemical removal, wet and dry
 CALPUFF v6.42 deposition, complex terrain algorithms, building downwash, plume fumigation and other
 effects.
 A post-processing program for the output fields of meteorological data, concentrations and
 CALPOST V6.292
 deposition fluxes.
 Sums and scales concentrations or wet/dry fluxes from two or more source groups from
 CALSUM v1.4 (1)
 different CALPUFF runs
 PRTMET v 4.495(1) Lists selected meteorological data from CALMET and creates plot files
 Processes CALPUFF concentration and wet/dry flux files. Creates new species as weighted
 combinations of modelled species; merges species from different runs into a single output
 POSTUTIL v1.641(1)
 file; sums and scales results from different runs; repartitions nitric acid/nitrate based on total
 available sulfate and ammonia.
 TERREL v3.69(1) Combines dna grids terrain data
 CTGPROC v3.5(1) processes and grids land use data
 MAKEGEO v3.2(1) merges land use and terrain data to produce the geophysical data file for CALMET
Note These modules indicate version number as listed on http://www.src.com/calpuff/download/mod6_codes.htm (for CALPro Plus v6)
 (1):

[version number not given in GUI interface or ‘About’ information].

1.2.6.2 Atmospheric Dispersion Processes

CALPUFF initiates the simulation of point source plumes with a calculation of buoyant plume rise. Transport winds are
extracted from the meteorological data file at the location of the stack and at the effective plume height (stack height plus
plume rise). For near-field effects, the height of the plume in transition to the final plume height is taken into account. The puff
release rate is calculated internally, based on the transport speed and the distance to the closest receptor.

As the puff is transported downwind, it grows due to dispersion and wind shear, and the trajectory is determined by advection
winds at the puff location and height at each time step. The pollutant mass within each puff is initially a function of the emission
rate from the original source. The pollutant mass is also subject to chemical transformation, washout by rain and dry deposition,
when these options are selected, as is the case in this application. Chemical transformation and removal are calculated based
on a one-hour time step.

Both wet and dry deposition fluxes are calculated by CALPUFF, based on a full resistance model for dry deposition and the
use of precipitation rate-dependent scavenging coefficients for wet deposition. Pollutant mass is removed from the puff due
to deposition at each time step. For the present modelling analyses, most options were set at “default” values, including the
MESOPUFF II transformation scheme and the treatment of terrain.

Nitrogen Dioxide Formation

Of the several species of nitrogen oxides, only NO2 is specified in the NAAQS. Since most sources emit uncertain ratios of
these species and these ratios change further in the atmosphere due to chemical reactions, a method for determining the
amount of NO2 in the plume must be selected.

Estimation of this conversion normally follows a tiered approach, as discussed in the Regulations Regarding Air Dispersion
Modelling (Gazette No 37804 published 11 July 2014), which presents a scheme for annual averages:

 Air Quality Specialist Report for the Proposed Medupi Flue Gas Desulphurisation (FGD) Retrofit Project
 Report No.: 10ZIT10 5
• Tier 1: Total Conversion Method

 Use any of the appropriate models recommended to estimate the maximum annual average NO2 concentrations by
 assuming a total conversion of NO to NO2. If the maximum NOx concentrations are less than the NAAQS for NO2, then
 no further refinement of the conversion factor is required. If the maximum NOx concentrations are greater than the NAAQS
 for NO2, or if a more "realistic" estimate of NO2 is desired, proceed to the second tier level.

 • Tier 2: Ambient Ratio Method (ARM) - Multiply NOx by a national ratio of NO2/NO. = 0.80

 Assume a wide area quasi-equilibrium state and multiply the Tier 1 empirical estimate NOx by a ratio of NO2/NOx = 0.80.
 The ratio is recommended for South Africa as the conservative ratio based on a review of ambient air quality monitoring
 data from the country. If representative ambient NO and NO2 monitoring data is available (for at least one year of
 monitoring), and the data is considered to represent a quasi-equilibrium condition3 where further significant changes of
 the NO/NO2 ratio is not expected, then the NO/NO2 ratio based on the monitoring data can be applied to derive NO2 as
 an alternative to the national ratio of 0.80 (as stipulated in the Regulations (Gazette No 37804 published 11 July 2014)).

In the Total Conversion Method, the emission rate of all NOx species is used in the dispersion model to predict ground-level
concentrations of total NOx. These levels of NOx are assumed to exist as 100% NO2, and are directly compared to the NAAQS
for NO2. If the NAAQS are met, the Tier 2 methods are not necessary.

Although not provided in the Regulations (Gazette No 37804 published 11 July 2014), the conversion of NO to NO2 may also
be based on the amount of ozone available within the volume of the plume. The NO2/NOx conversion ratio is therefore coupled
with the dispersion of the plume. This is known as the Ozone Limiting Method (OLM). Use of onsite ozone data is always
preferred for the OLM method.

The MESOPUFF II chemical transformation scheme, used in the current assessment, included in the CALPUFF model
accommodates NOx reactions, these are only considering the formation of nitrates and not the NO/NO2 reactions.

Given all of the above limitations, it was decided to employ the Ambient Ratio Method (ARM), i.e. the second version of the
DEA Tier 2 option. The ARM ambient ratio method is based upon the premise that the NO2/NOx ratio in a plume changes as
it is transported but attains an equilibrium value some distance away from the source (Scire and Borissova, 2011). In their
study, Scire and Borissova analysed hourly monitored NO2 and NOx data for 2006 at 325 monitoring sites throughout USA,
which amounted to approximately 2.8 million data points for each species. These observations were grouped into a number
of concentration ranges (bins), and the binned data were used to compute bin maximums and bin average curves. Short-term
(1-hr) NO2/NOx ratios were subsequently developed based on bin-maximum data. Similarly, long-term (annual average)
NO2/NOx ratios were based on bin-averaged data. The method was tested using the NO2/NOx ratios applied to the observed
NOx at selected stations to predict NO2, and then compared to observed NO2 concentrations at that station. The comparison
of NO2 derived from observed NOx using these empirical curves was shown to be a conservative estimate of observed NO2
(as obtained from measurements at Marapong), whilst at the same time arriving at a more realistic approximation than if simply
assuming a 100% conversion rate. More details of the adopted conversion factors are given in Appendix A.

3 A process is called a quasi-equilibrium process if the intermediate steps in the process are all close to equilibrium.
 Air Quality Specialist Report for the Proposed Medupi Flue Gas Desulphurisation (FGD) Retrofit Project
 Report No.: 10ZIT10 6
You can also read