Destination AKL 2025 A new direction for Auckland's visitor economy - Aucklandnz.com

Page created by Jason Swanson
 
CONTINUE READING
Destination AKL 2025 A new direction for Auckland's visitor economy - Aucklandnz.com
Destination

                                                                                            S U P P L E M E N TA RY R E P O RT
       AKL 2025
       A new direction for
       Auckland's visitor economy

1   D E ST I N AT I O N A K L ST R AT E GY - S U P P O RT I N G D O C U M E N TAT I O N |
Destination AKL 2025 A new direction for Auckland's visitor economy - Aucklandnz.com
Contents
                1. ABOUT THIS DOCUMENT_______________________________________________                  4
                2. SCOPE & BOUNDARY__________________________________________________                  5
                          2.1 Geographical scope of the Strategy___________________________            5
                3. FULL LIST OF CONSULTATION___________________________________________                6
                               3.1 Who was consulted__________________________________________         6
                               3.2 Industry Leaders Group_______________________________________       7
                         3.3 Organisations represented___________________________________              8
                4. SETTING THE SCENE __________________________________________________                9
                               4.1 About Auckland______________________________________________        9
                               4.2 Our people_________________________________________________        11
                               4.3 Our visitors__________________________________________________     12
                               4.4 Value of the visitor economy__________________________________     18
                5. SURVEYS _____________________________________________________________              20
                         5.1 Auckland industry stakeholder survey___________________________          20
                               5.2 Auckland visitor survey (domestic market)_______________________   24
                6. AUCKLAND AS A COMPETITIVE DESTINATION CITY ________________________                31
                               6.1 Defining competitiveness_____________________________________      31
                               6.2 The cities assessed__________________________________________      32
                               6.3 The results of the benchmarking_______________________________     32
                               6.4 Auckland’s performance in each category______________________      33
                          6.5 Full comparative city benchmarking findings____________________         34
                7. KEY FACTORS REQUIRING CONTINUOUS FOCUS__________________________                   42
                               7.1 Overview____________________________________________________       42
                               7.2 Destination management key factors__________________________       43
                               7.3 Destination marketing key factors______________________________    46
                8. RECOMMENDED ACTIONS______________________________________________                  48
                               8.1 Destination management_____________________________________        48
                               8.2 Destination marketing________________________________________      66
                9. LITERATURE REVIEW___________________________________________________               74
                10. SUPPORTING STATISTICAL DATA_______________________________________                86
                               10.1 Population data – historic____________________________________    86
                               10.2 Population data – forecasts_________________________________      86
                          10.3 Visitation data – historic_____________________________________        87
                11. BIBLIOGRAPHY_______________________________________________________               88

2   ST R AT E GY S U P P O RT I N G
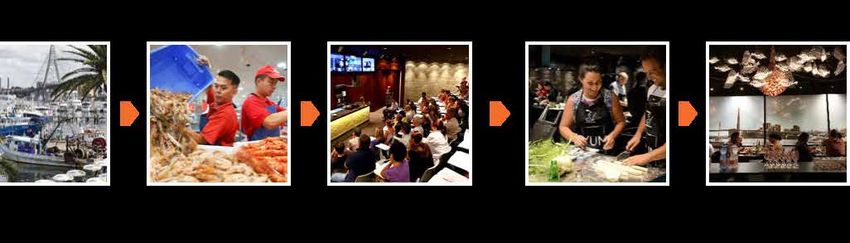
Destination AKL 2025 A new direction for Auckland's visitor economy - Aucklandnz.com
Figures & Tables
                FIGURE 1: GEOGRAPHICAL SCOPE OF THE STRATEGY__________________________________         5
                FIGURE 2: CONSULTATION WHICH GUIDED THE STRATEGY______________________________         6
                FIGURE 3: AUCKLAND COUNCIL IN A BROADER CONTEXT______________________________         10
                FIGURE 4: HISTORIC POPULATION GROWTH__________________________________________         11
                FIGURE 5: INTERNATIONAL ARRIVALS TO AUCKLAND (2008-2017, SEPTEMBER YE)__________      13
                FIGURE 6: ORIGIN OF INTERNATIONAL VISITORS TO AUCKLAND (2008-2017)______________      14
                FIGURE 7: COMMERCIAL AND PRIVATE OVERNIGHT
                VISITORS TO AUCKLAND (2013-2017, SEPTEMBER YE)____________________________________    15
                FIGURE 8: ALOS IN AUCKLAND BY ACCOMMODATION TYPE (5-YEAR AVERAGE)____________         15
                FIGURE 9: AVERAGE LENGTH OF STAY IN AUCKLAND
                BY ACCOMMODATION TYPE (2012-2016, DECEMBER YE)________________________________        16
                FIGURE 10: NEW ZEALAND VISITOR SPEND (2012-2016)__________________________________    16
                FIGURE 11: AUCKLAND VISITOR FORECASTS –
                LOW, MEDIUM AND HIGH GROWTH SCENARIOS_______________________________________           17
                FIGURE 12: TOURISM’S GDP__________________________________________________________    18
                FIGURE 13: TOURISM EMPLOYMENT___________________________________________________      18
                FIGURE 14: POPULATION FORECASTS_________________________________________________      19
                FIGURE 15: FREQUENCY OF VISITATION TO AUCKLAND__________________________________      25
                FIGURE 16: MAIN REASON FOR VISITING AUCKLAND____________________________________      26
                FIGURE 17: COMPARATIVE METRICS___________________________________________________     31
                FIGURE 18: THE CITIES ASSESSED_____________________________________________________   32
                FIGURE 19: OVERALL RANKINGS______________________________________________________     33
                FIGURE 20: AUCKLAND’S RANKING ACROSS THE CATEGORIES__________________________         33
                FIGURE 21: NELSON STREET CYCLEWAY_______________________________________________      51
                FIGURE 22: ACTIVATION OF OTHER ISLANDS (EXAMPLES ONLY)__________________________      54
                FIGURE 23: ALBERT PARK TUNNELS___________________________________________________     55
                FIGURE 24: ADAPTIVE REUSE OF PRISON EXAMPLES____________________________________      56
                FIGURE 25: PERTH STADIUM__________________________________________________________    62
                FIGURE 26: VIVID SYDNEY____________________________________________________________   67
                FIGURE 27: SYDNEY FISH MARKET COOKING SCHOOL
                AND ‘SEA TO PLATE’ EXPERIENCE_____________________________________________________    70

                TABLE 1: DEMOGRAPHIC CHARACTERISTICS OF AUCKLAND RESIDENT
                AND DOMESTIC VISITOR SURVEY RESPONDENTS______________________________________         24
                TABLE 2: FAVOURITE PLACES TO VISIT IN AUCKLAND___________________________________     27
                TABLE 3: FAVOURITE ACTIVITIES TO DO IN AUCKLAND__________________________________     27
                TABLE 4: THINGS AUCKLAND RESIDENTS LIKE TO DO MOST
                WITH VISITORS OR RECOMMEND THEY DO____________________________________________        28
                TABLE 5: THINGS DOMESTIC VISITORS LIKE LEAST ABOUT AUCKLAND____________________       28
                TABLE 6: WHAT AUCKLAND LACKS AS A PLACE TO VISIT________________________________      29
                TABLE 7: THE ONE THING AUCKLAND COULD CHANGE TO
                MAKE IT MORE ATTRACTIVE TO VISITORS._____________________________________________     30
                TABLE 8: FULL COMPARATIVE CITIES BENCHMARKING FINDINGS_________________________       34
                TABLE 9: HISTORIC POPULATION GROWTH____________________________________________       86
                TABLE 10: POPULATION FORECASTS__________________________________________________      86
                TABLE 11: INTERNATIONAL ARRIVALS TO AUCKLAND (MARCH YE)_________________________      87
                TABLE 12: COMMERCIAL ACCOMMODATION MONITOR_________________________________           87

3   ST R AT E GY S U P P O RT I N G
Destination AKL 2025 A new direction for Auckland's visitor economy - Aucklandnz.com
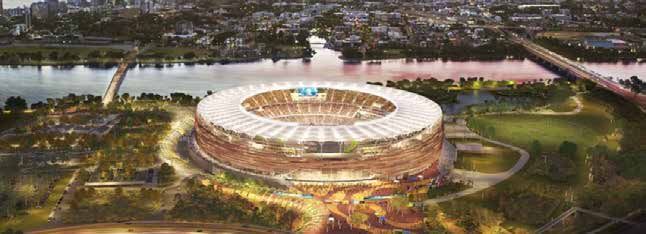
1. About This Document
                  Destination AKL 2025 (the Strategy) has been created through a process
                  of extensive consultation, including hours of interviews, workshops and
                  discussions, surveys completed by more than 1,000 people with an interest
                  in Auckland’s future, as well as detailed research and analysis.

                  The final result is a comprehensive strategy which sets a new direction
                  for Auckland’s visitor economy – a vision for a more sustainable future for
                  Auckland.

                  This process has been initiated by Auckland Tourism, Events, & Economic
                  Development (ATEED) and guided by an industry leadership group.

                  ATEED is the guardian and driver of this Strategy and has a key role in its
                  implementation, working alongside industry and government (at all levels)
                  to activate the opportunities and help address the challenges.

                  This document is comprised of all the additional information which was
                  obtained through the nine-stage process of creating the final Strategy.

4   D E ST I N AT I O N A K L ST R AT E GY - S U P P O RT I N G D O C U M E N TAT I O N | A B O U T T H IS D O C U M E N T
Destination AKL 2025 A new direction for Auckland's visitor economy - Aucklandnz.com
2. Scope & Boundary
                  2.1.          G E O G R A P H I CA L S CO P E O F T H E ST R AT E GY
                  The geographical scope/boundary of this Strategy includes the Auckland Council Territorial
                  Local Authority (TLA) boundary, as indicated in Figure 1. However, the Strategy also investigates
                  opportunities for strengthening the visitor economy through partnerships with surrounding
                  regions, noting that changes in Auckland’s economy, as New Zealand’s major city, has a distinct
                  trickledown effect into various regions.

                  The importance of surrounding regions needs to be recognised for various reasons, including
                  the strength of attractions such as Hobbiton (in Matamata), Waitomo Caves and Hot Water
                  Beach (in The Coromandel Peninsula).

                  Figure 1: Geographical scope of the Strategy

                      Legend
                              Auckland Council Area

5   D E ST I N AT I O N A K L ST R AT E GY - S U P P O RT I N G D O C U M E N TAT I O N | S C O P E & B O U N DA RY
Destination AKL 2025 A new direction for Auckland's visitor economy - Aucklandnz.com
3.	Full List Of Consultation
                      3.1.        W H O WA S C O N S U LT E D
                      In addition to interviews and workshops held with the stakeholder groups outlined below, surveys were
                      distributed to more than 1,000 industry recipients on the ATEED database. Surveys were also undertaken
                      with local board elected members, mana whenua authorities, local community, domestic visitors to
                      Auckland, and ATEED specialists involved in destination marketing and development.

                    1. Guiding the process                           2. Broader Stakeholder Consultation                             3. Govt. Consultation/Infrastructure

                           ATEED Board                                             Accommodation                                       Tourism, Education, Cultural Agencies

                                                                • T IA Hotels Group & owners                                   • M
                                                                                                                                   BIE – Major Events & Business Events,
                      ATEED Working Group
                                                                • Motels                                                          tourism policy
    • B usiness unit heads                                     • Accomm group (backpackers, camp parks, B&B)                  • Creative NZ
    • Support team reps                                                                                                        • Ministry for the Environment
                                                                              Attractions & Experience
                 Maori Tourism Leaders Group                                                                                                Other Agencies, Departments
                                                                • Major attractions group
    • T ourism operators                                                                                                       •   Department of Conservation
    • Air NZ                                                                     Inbound Operators                              •   Auckland Transport
    • Tourism focused iwi                                                                                                      •   Council Parks
                                                                • Inbound Tour Operators
                                                                                                                                •   Panuku Development
            Local Government Local Government
                                                                             Retail, Restaurants & Cafes                        •   NZ Tourism Research Institute
    •   Mayor’s Office                                                                                                         •   AUT
                                                                • Heart of the City
    •    CEO Auckland Council                                                                                                  •   Te Puni Kokiri
                                                                • Hospitality Association
    •     Councillors
    •     Panuku                                                                    Business Events                                                      Public
    •     City Planning – Ludo
                                                                                                                                • AKL resident panel
    •      Local board chairs                                  • ACB Membership Gold & Silver level only
                                                                                                                                • NZ domestic panel
                     Industry Leaders Group                                            Education

    • Group of 16 strategic thinkers                            • AKL Futures Group
    • Composition approved by ATEED Board
                                                                                     Arts & Culture

                                                                • R
                                                                   FA group – Museum, Art Gallery, zoo, theatres,
                                                                  stadiums
                              Members

    • Chair – Martin Sneddon
                                                                                     Major Events
    • Jeremy O’Brien – Regional GM Direct Market               • Government
       Development – Air NZ                                     • Key stakeholders
    • Steve Armitage - ATEED GM Destination
    • Nick Hill - ATEED CE                                                          Industry Youth
    • Stephen England-Hall – CEO Tourism New Zealand
                                                                • AUT tourism students
    • Chris Roberts – CEO TIA
                                                                • Young TEC
    • Kerry Hannaford – Area Director Sales
       Marketing – Accor                                                         Industry Innovators
    • Scott Tasker – GM Aeronautical Commercial,
       Auckland Airport                                         •   Nuwanthie Samarakone, ICE Professionals
    • Debbie Summers – Chair Cruise NZ                          •   Haka Tours
    • Jan Tonkin – MD The Conference Company                    •   Google Travel
    • Norm Thompson – Board ATEED                               •   Design Works
    • Sir Pita Sharples – ATEED Board Advisor
    • Graeme Stephens – CEO Skycity
    • Sir Rob Fenwick – Entrepreneur and environmentalist
    • Grant McPherson – CEO Education NZ
    • John Thorburn – CEO Intercity                              It is important to recognise this Strategy reflects the views, aspirations and
    • Pania Tyson-Nathan – CE NZ Maori Tourism
    • Ian Cossar – GM Tourism, MBIE
                                                                 desires of a wide range of stakeholders to deliver a stronger, more robust
                                                                 and sustainable visitor economy for the entire Auckland region.

    ATEED facilitated this process and provided the presentations and feedback to allow for this level of robust discussion.

6   D E S T I N AT I O N A K L S T R AT E GY - S U P P O R T I N G D O C U M E N TAT I O N | L I S T O F C O N S U LTAT I O N
Destination AKL 2025 A new direction for Auckland's visitor economy - Aucklandnz.com
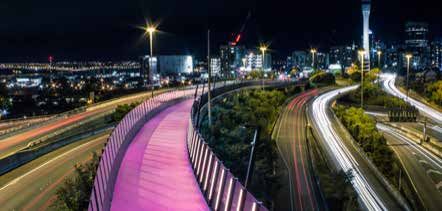
3.2.         INDUSTRY LEADERS GROUP
    Guiding the process was an Industry Leaders Group of major stakeholders representing a mix
    of public and private sector entities. This resulted in robust discussions about the challenges
    facing the Auckland visitor economy and, equally importantly, the mechanisms which need to
    be considered for achieving desired results.

    Industry Leaders Group members:

    Martin Snedden,                  Chris Roberts,                       Debbie Summers,                   Graeme Stephens,     Grant McPherson,
    Director,                        Chef Executive,                      Chair, Cruise                     Chief Executive,     Chief Executive,
    New Zealand Cricket              Tourism Industry                     New Zealand                       SkyCity and NZICC    Education New Zealand
                                     Aotearoa.

    Iain Cossar,                     Jan Tonkin,                          Jeremy O'Brien,                   John Thorburn,       Kerrie Hannaford,
    General Manager,                 Managing Director,                   Regional General                  Chief Executive,     Area Director, Sales
    Tourism, Sectors,                Conference Company                   Manager,                          InterCity Group.     & Marketing NZ, Fiji
    Regions & Cities,                                                     Direct & Market                                        & French Polynesia,
    MBIE                                                                  Development, Air NZ                                    Accor

    Nick Hill,                       Norm Thompson,                       Scott Tasker,                     Sir Rob Fenwick,     Stephen England-Hall,
    Chief Executive,                 ATEED Board                          General Manager,                  Entrepreneur and     Chief Executive,
    ATEED                            Advisor                              Aeronautical                      Environmentalist     Tourism New Zealand
                                                                          Commercial,
                                                                          Auckland Airport

    Stephen Town,                    Mark Lambert,                         Steve Armitage,                  Sir Pita Sharples,
    Chief Executive,                 Chief Transport Services              General Manager                  ATEED
    Auckland Council                 Officer, Auckland                     Destination,                     Board Advisor
                                     Transport                             ATEED

7   D E ST I N AT I O N A K L ST R AT E GY - S U P P O RT I N G D O C U M E N TAT I O N | I N D U ST RY L E A D E RS G R O U P
Destination AKL 2025 A new direction for Auckland's visitor economy - Aucklandnz.com
3.3.           O R GA N ISAT I O NS R E P R E S E N T E D
    The 150 stakeholders who were invited to participate in interviews and workshops represented
    the following organisations:

    • Accor Hotels                                             • Gilpin Travel                                             • Ports of Auckland
    • ACG Education                                            • Good Group Hospitality                                    • Potiki Adventures
    • Adventure Capital                                        • Google Travel                                             • Production Associates
    • Air New Zealand Aviation Institute                       • Grand Millennium Auckland                                 • Quantum Events
    • Air New Zealand                                          • GSN Pacific                                               • Rainbow’s End
    • Ananda Tours                                             • Haka Legend                                               • Ramada Auckland
    • Annick House Bed & Breakfast                             • Haka Tours                                                • Rangitoto College
    • Auckland Adventure Jet                                   • Hangi Master & Te Pou Project                             • Regional Facilities Auckland
    • Auckland Airport                                         • Heart of the City                                         • Renaissance Tours
    • Auckland Art Gallery                                     • Heletranz                                                 • Rydges Auckland
    • Auckland Bridge Climb and Bungy                          • Heritage Hotels                                           • S
                                                                                                                              chools International Business Association
    • Auckland Conventions Venues & Events                     • Hike Bike Ako                                               of New Zealand
    • Auckland Council                                         • Holiday Parks New Zealand                                 • SkyCity
    • Auckland Design Office                                   • Hospitality New Zealand                                   • Skydive Auckland
    • Auckland Ghost Tours                                     • ICE Professionals                                         • Snowplanet
    • Auckland Live                                            • ICL Education Group                                       • Somerville Intermediate School
    • Auckland Stadiums                                        • ID New Zealand                                            • Southern World Vacations
    • Auckland Transport                                       • Inside Out Productions                                    • Spark Arena
    • Auckland Tourism, Events & Economic                      • International Travel College                              • Sport New Zealand
     Development                                               • InterCity Group                                           • Stamford Plaza Auckland
    • Auckland University of Technology                        • Kelly Tarlton’s SEA LIFE Aquarium                         • Sudima Auckland Airport
    • Auckland War Memorial Museum                             • Mangere Mountain Education Centre                         • Te Hana Te Ao Marama
    • Auckland Whale and Dolphin Safari                        • McKay Shipping                                            • The AOT Group
    • Auckland Zoo                                             • Marriott Hotels                                           • The Conference Company
    • Bachcare Holiday Homes                                   • Mayo & Calder                                             • The Hunting Lodge
    • Boutique Hotels and Lodges New Zealand                   • Ministry of Business, Innovation and Employment           • The New Zealand School of Food & Wine
    • Butterfly Creek                                          • Ministry for the Environment                              • The Show Business
    • Campbells Bay School                                     • Motel Association of New Zealand                          • The Trusts Arena
    • Carnival                                                 • Mudbrick Vineyard and Restaurant                          • TIA Auckland Hotel Group
    • City Parks Services                                      • Museum of Transport and Technology Auckland               • Ticketek New Zealand
    • Conference Innovators                                    • New Zealand Cruise Association                            • TIME Unlimited Tours
    • Conventions & Incentives New Zealand                     • New Zealand Hotel Council Auckland Chapter                • Toru Tours
    • Cordis Hotel                                             • New Zealand International Convention Centre               • Tourism Holdings Limited
    • Creative New Zealand                                     • New Zealand Major Events                                  • Tourism Industry Aotearoa
    • Crown Plaza Auckland                                     • New Zealand Maritime Museum                               • Tourism New Zealand
    • Department of Conservation                               • New Zealand Māori Tourism                                 • The Southern Initiative
    • Designworks                                              • New Zealand Rugby                                         • Unitec Institute of Technology
    • Ecozip Adventures                                        • Nga Maunga Whakahii o Kaipara Investments                 • University of Auckland
    • Eden Park                                                • Ngati Whatua Orakei – Tamaki Hikoi                        • Urban Gourmet
    • Education New Zealand                                    • Ngai Tai ki Tamaki – Te Haerenga                          • Waipuna Hotel Auckland
    • Event Dynamics                                           • Novotel Auckland Airport                                  • Waka Quest & Navigator Tours
    • EventWorx                                                • Orange Productions                                        • Vector Wero Whitewater Park
    • Exhibition Hire Services & Displayworks                  • Pakiri Beach Horse Rides                                  • Verve
    • Explore Group                                            • Pan Pacific Travel                                        • Vidcom New Zealand
    • Footprints Waipoua                                       • Panuku Development Auckland                               • Villa Maria
    • Fresh Info                                               • Peek Exhibition                                           • YHA New Zealand
    • Fullers Group                                            • Pop-up Globe

8   D E ST I N AT I O N A K L ST R AT E GY - S U P P O RT I N G D O C U M E N TAT I O N | O R GA N ISAT I O NS R E P R E S E N T E D
4. Setting The Scene
                       4.1.           ABOUT AUCKLAND
                       Māori settled in the Auckland region circa 1350 after crossing the Pacific in waka. The region is
                       referred to as ‘Tāmaki Makarau’, which can be linked to different tribal narratives. Some of the
                       common themes of these narratives are included below.

                       • T
                          he likeness of Tāmaki Makaurau (the whenua/land) to a woman and being desired and

                           challenged over by many.

                       • T
                          he desirability of a region rich with resources and surrounded by water. Due to these

                           abundant resources, Tāmaki Makaurau has and continues to be much coveted.

                       •   The name Tāmaki Makaurau links to a number of different ancestors who occupied the area.

                       •   Tāmaki Makaurau is referenced as the land of many lovers1.

                       • T
                          āmaki Makaurau was a specific tract of land (e.g. area by the Tāmaki river) which has been

                           adopted for the whole region over time.

                       Auckland’s harbours were abundant with life and offered Māori valuable passageways for both
                       travel and trade. Many battles were fought between iwi over the land, and, evidence of some
                       of the pā (fortified settlements) created are still visible today.

                       Today, there are 19 iwi who represent mana whenua interests in Tāmaki Makaurau – a city
                       brimming with diversity and one which is made up of cultures from all corners of the world:
                       entrepreneurs, travellers, migrants and locals.

                       Auckland2 is also New Zealand’s largest urban area and local government council area (by
                       population). It is governed by Auckland Council which began operating as a single unitary
                       authority on 1 November 2010, combining the functions of the previous regional council and the
                       region's seven city and district councils into one. Directly to the south of Auckland Council lies
                       the Waikato District and to the north, Kaipara District (see Figure 3).

    1
          Note: ‘makau-rau’ translated means ‘to have many lovers’ (verb).
    2
          When Auckland is referred to in the Strategy and this Supplementary Report, it is referring to the area covered by Auckland Council.
         If the CBD specifically is being referred to, it is referred to as Auckland CBD.

9       D E ST I N AT I O N A K L ST R AT E GY - S U P P O RT I N G D O C U M E N TAT I O N | S E T T I N G T H E S C E N E
Figure 3: Auckland Council in a broader context

                          Far North
                           District

                                      Whangarei
                                       District

                           Kaipara
                           District

                                                  Auckland

                                                                                     Thames
                                                                                   Coromandel
                                                                                     District

                                                                                        Hauraki
                                                                                        District

                                                                Waikato
                                                                District
                                                                                   Matamata
                                                                                     Piako
                                                                                    District           Tauranga
                                                                        Hamilton                          City
                                                                          City
                                                                                                   Western Bay
                                                                                                    of Plenty
                                                                             Waipa                  District
                                                                             District
                                                                                        South
                                                                                       Waitkato              Rororua    Kawerau
             Legend                                                         Otorohanga District              District   District
                                                                                                                                     Opotiki    Gisborne
                                                             Waitomo          District                                               District
                     Auckland Council Area                                                                                                      District
                                                             District                                                    Whakatane
                     TLA Boundaries                                                                                       District

     Auckland is New Zealand’s primary international gateway and is an economic hub for the country: its infrastructure
     is increasingly growing, its transport network is the most significant in the country, and Auckland Airport operates
     24/7. Auckland Port is ranked second, behind Tauranga, in the number of containers handled each year.

     Auckland covers an area of 4,894 square kilometres and includes outlying rural areas and the islands of the Hauraki
     Gulf. It is one of the few cities in the world which has a harbour on each of two separate major bodies of water
     (the Tasman Sea and the Pacific Ocean) and its landscape is dotted with dozens of dormant volcanic cones. It
     is a unique urban setting, wedged between two major and distinctly different harbours (the Waitemata and the
     Manukau).

     Since 2011, the city has ranked third in the Mercer Quality of Living Survey which assesses cities based on a variety of
     liveability and quality of life principles, across political, economic, environmental, personal safety, health, education
     and transportation spheres.

     The city hosts and supports many cultural institutions (the most in the country), including art galleries; museums;
     performing arts venues; events and festivals; public/street art; popular, live and independent music; film; and
     fashion. And culture extends to sporting activities, with Auckland having New Zealand’s largest sporting ground –
     Eden Park – which is able to seat 50,000, as well as Spark Arena and Vodafone Events Centre (amongst others).

10   D E ST I N AT I O N A K L ST R AT E GY - S U P P O RT I N G D O C U M E N TAT I O N | S E T T I N G T H E S C E N E
4.2.          OUR PEOPLE
     Auckland has a growing population (Figure 4). Over the past ten years, Auckland’s population has increased
     by more than 253,000 residents, reaching 1.66m in 2017 (June YE). Auckland’s rate of population growth
     over this period (18%), exceeded New Zealand’s rate of growth (13%) and Auckland’s share of New Zealand’s
     population also increased from 33% to 35%.

     This growth is attributed to inward migration (by both Kiwis from other parts of New Zealand as well as
     foreigners) as well as natural population growth.

     Figure 4: Historic population growth3

                                                                                 Auckland Population
                                                                                                                                                                    1.66m
                                                                                                                                                   1.61m

                                                                                                                                 1.57m
                                                                                                                1.53m
                                                                                               1.49m
                                                                             1.48m
                                                           1.46m
                                          1.44m
                         1.42m
         1.41m

         2008            2009              2010             2011              2012              2013             2014              2015            2016             2017

     Cultural diversity is an intrinsic element of Auckland’s identity. This diversity contributes to the city’s cosmopolitan
     feel. A study completed by the International Organization for Migration4 found that Auckland is “one of the world’s
     most culturally diverse cities with the fourth most foreign-born population” 5.

     While New Zealand Europeans make up the majority of Auckland’s population, Auckland is also home to a
     significant number of Māori, Pacific and Asian peoples. Auckland has the second largest Polynesian population of
     any city in the world, after Sydney.

     As of the 2013 New Zealand Census, 54% of Aucklanders identified as of NZ European ethnicity, 21% as Asian, 13%
     as Pacific peoples, 10% as Māori, 2% as Middle Eastern/Latin American/African and 1% as another ethnicity 6.

     3
       Auckland data: ATEED, ‘Auckland Index - Data Tables - People’. 2017.
      NZ data: Stats NZ, ‘National Population Estimates: As at 30 June’. 2017.
     4
       International Organization for Migration, World Migration Report 2015 - Migrants and Cities: New Partnerships to Manage Mobility. 2015,  [accessed 20 September 2017].
     5
       Tan, L, ‘Auckland more diverse than London and New York’ in NZ Herald, 17 January 2016, http://www.nzherald.co.nz/nz/news/article.cfm?c_id=1&objectid=11575305
     [accessed 12 September 2017].
     6
       Primarily “New Zealander”.

11   D E ST I N AT I O N A K L ST R AT E GY - S U P P O RT I N G D O C U M E N TAT I O N | S E T T I N G T H E S C E N E
Additionally, 39% of Aucklanders indicated that they were born outside of New Zealand (up from 32% in 2001) 7.
     The only other cities which ranked higher than (or equal to) Auckland for foreign-born population were Dubai (83%),
     Brussels (62%)8 and Toronto (39%)9.

     The World Migration Report 2015 indicates that where global cities exist, migrants often are concentrated in these
     cities when compared to other parts of the country. This is the case for Auckland: more than half (52%) of New
     Zealand’s 1m residents who are foreign-born reside in Auckland.

     Auckland’s diversity is considered a key strength. Diversity brings a wide range of benefits including (but not limited
     to): a broader food and retail offering; new cultural celebrations and festivals; and foreign direct investment is often
     greater from countries that are well-represented in cities 10.

     4.3.           OUR VISITORS

     4 . 3 . 1 . 		 A N O T E A B O U T V I S I T O R D A T A
     There have been significant changes to the way visitor data is collected and distributed at a national level.
     The Ministry of Business, Innovation and Employment (MBIE) previously (up to 2011) released Regional Tourism
     Estimates11 which drew data from the International Visitor Survey (IVS), Domestic Travel Survey (DTS) and
     electronic transactions data. This provided a summary of visitor nights, visits and expenditure at the regional
     tourism organisation (RTO) level for both domestic and international overnight and day visitors. MBIE however,
     has moved away from this and now releases data based on tourism expenditure.

     While international visitation data can be gathered via the International Visitor Arrivals (IVA) - which is
     released monthly and is based on information contained in the electronic records supplied by the New
     Zealand Customs Service and from arrivals and departure cards completed by passengers – there is a
     distinct data gap for domestic visitation. These gaps in visitation data have also been identified by industry
     via Tourism Industry Aotearoa (TIA) and they have indicated the need to fill these gaps12.

     The Commercial Accommodation Monitor (CAM) produced by MBIE captures domestic and international
     overnight visitation in RTOs, however, this only covers those staying in commercial accommodation13
     properties. It, therefore, does not capture the large number of visitors who stay in private accommodation,
     including with family and friends.

     7
        Stats NZ, ‘Ethnic group (total responses) by age group and sex, for the census usually resident population count, 2001, 2006, and 2013 Censuses (RC, TA)’.
     8
        Dubai and Brussels have particularly high levels of foreign-born residents because of their highly mobile workforces.
     9
        International Organization for Migration, World Migration Report 2015 - Migrants and Cities: New Partnerships to Manage Mobility. 2015, p.39,  [accessed 20 September 2017].
     10
         Liberty GB, ‘Does Multiculturalism Benefit the United Kingdom?’, 2013,  [accessed 20
     September 2017].
     11
        Ministry of Business, Innovation and Employment, ‘Regional Tourism Estimates 2006 - 2011’.  [accessed 3 October 2017].
     12
         Cropp, A, ‘Lack of critical visitor data puts the tourism industry at risk’.in Stuff - Fairfax Media, 4 June 2017, .
     13
         Only includes short term commercial accommodation properties which are GST registered and which have a turnover of at least $30,000 per annum. Short term
     is defined as less than one month: (Ministry of Business, Innovation and Employment, ‘CAM methodology’. 2017,  [accessed 18 November 2017]).

12   D E ST I N AT I O N A K L ST R AT E GY - S U P P O RT I N G D O C U M E N TAT I O N | S E T T I N G T H E S C E N E
To demonstrate visitation to Auckland for this Strategy, official data sources – those which have a proven track
     record - have been utilised, including the CAM and the IVA. While this means that a picture of day trip visitation to
     Auckland as well as overnight visitation staying in private accommodation cannot be demonstrated, this Strategy
     has recommendations focused on filling this data gap in the near future.

     4.3.2.              I N T E R N AT I O N A L V IS I TAT I O N TO AU C K L A N D
     Visitation to Auckland and to New Zealand has grown significantly over the past ten years (Figure 5). With
     the advent of new technology (such as mobile phone data14) to measure visitation more accurately and
     consistently15, a new understanding of the Auckland’s visitor economy is emerging.

     The year to September 2017 marked a record high for international visitors to Auckland; there were more than
     2.6m international arrivals, a 55% increase since 2008. Auckland’s international visitation has been growing
     faster than the national rate, which increased by 49% over the same period.

     Auckland’s tourism sector plays an important role in the national tourism economy: Auckland has long been
     a gateway to the rest of New Zealand and offers the largest concentration of commercial accommodation,
     attractions and transport services within New Zealand.

     Figure 5: International arrivals to Auckland (2008-2017, September YE)16

                                                                    Total NZ Arrivals                    Auckland Airport Arrivals           3.68m
                                                                                                                                     3.39m

                                                                                                                           3.04m
                                                                                                                 2.80m
                                                                                 2.59m          2.67m                                        2.63m
          2.47m            2.43m              2.52m            2.55m
                                                                                                                                     2.40m
                                                                                                                            2.16m
                                                                                                                 1.99m
                                                                                 1.84m          1.90m
                                                               1.80m
          1.70m             1.66m             1.71m

          2008              2009              2010               2011             2012          2013              2014      2015     2016    2017

     14
        Via Qrious
     15
        Compared to annual visitor surveys based on sample sizes
     16
        Stats NZ, International Visitor Arrivals to New Zealand: September 2017. 2017.

13   D E ST I N AT I O N A K L ST R AT E GY - S U P P O RT I N G D O C U M E N TAT I O N | S E T T I N G T H E S C E N E
The largest international market for Auckland is Australia, comprising 30% of all international visitors to the region in
     2017 – up 2% from 10 years ago (Figure 6). While the UK and USA’s market share has declined slightly, major growth
     has been experienced in the China market, more than doubling its share of visitation from 2008-2017.

     Figure 6: Origin of international visitors to Auckland (2008-2017)17

                                                                              2017
                                 d
                        rl
                      wo
                   he

                                                                                                                                            Au
                                                                            2008
                 ft

                                                                                                                                              str
               to

                                                                                                                                                 alia
            Res

                                                                                                                                      30%
                        31%
                                                                                                                            28%
                                                   32%

                                                   2%                                                                           10%
                          2%                        2%
          Can

                                                      4%
            ad

                              3%                                    4%                                                                9%
              aG

                                                                                                           12%
                                                                                    6%
                 er m

                                     2%
                                                                                                                                              A
                                                                                                                                           US
                      an K

                                                   4%
                        y o
                          St re

                             a                                                                                             6%
                            h

                                     Ja
                                          pa
                                               n                                    13%
                                                                                                                                 UK

                                                                             C hin a

     17
          ATEED, ‘Auckland Index - Data Tables - Auckland Visitor Economy’. 2017.

14   D E ST I N AT I O N A K L ST R AT E GY - S U P P O RT I N G D O C U M E N TAT I O N | S E T T I N G T H E S C E N E
4.3.3. COMMERCIAL OVERNIGHT VISITORS (DOMESTIC AND
     I N T E R N AT I O N A L ) TO AU C K L A N D
     Over the past five years, overnight visitation (for those staying in commercial accommodation) has risen: increasing
     by 14% (or 459,000 overnight guests). More than half of this growth has been from the international market,
     increasing from 1.45m overnight guests in 2013 to 1.71m in 2017 (an increase of 18%). The domestic market has also
     grown, albeit at a slower rate, increasing by 11% (202,000 guests) over the same period.

     Figure 7: Commercial and private overnight visitors to Auckland (2013-2017, September YE)18

                                        Total                         Domestic                          International

                                                                                                                      3.65m             3.70m
                                              3.33m                              3.36m
            3.24m

                                              1.91m                              1.92m                                2.05m             2.00m
            1.79m

                                                                                                                                        1.71m
                                                                                                                      1.60m
            1.45m                             1.43m                              1.44m

              2013                              2014                               2015                                    2016          2017

     4.3.4.               L E N G T H O F S T AY I N A U C K L A N D
     The average length of stay (ALOS) for visitors staying in commercial accommodation in Auckland is 2.3 nights.
     Holiday parks and backpackers have the longest ALOS, averaging 2.6 and 2.5 nights respectively, while hotels have
     the shortest ALOS, averaging 2 nights over the five-year period assessed.

     Figure 8: ALOS in Auckland by accommodation type (5-year average 19)

                        2.5                              2.6
                                                                                                                                                2.3
                                                                                            2.1
                                                                                                                                  2.0

                  Backpackers                      Holiday Parks                          Motels                              Hotel             Total

     18
          Stats NZ, ‘Commercial Accommodation Monitor: September 2017’. 2017.
     19
          Stats NZ, ‘Commercial Accommodation Monitor: September 2017’. 2017.

15   D E ST I N AT I O N A K L ST R AT E GY - S U P P O RT I N G D O C U M E N TAT I O N | S E T T I N G T H E S C E N E
The ALOS in Auckland has remained fairly static over the past five years, ranging from 2.2-2.4 nights. While nights
     in hotels/motels have also remained relatively static, backpackers and holiday parks experienced the greatest
     fluctuations (albeit, these are still fairly minimal shifts).

     Figure 9: Average length of stay in Auckland by accommodation type (2012-2016, December YE20)

                                                               2012        2013          2014           2015           2016

                       2.9
                                                       2.8 2.8
                             2.7
                 2.6                                             2.6
                                           2.5
                                                 2.4                                                                                                   2.4 2.4
                                                                                                                                                                 2.3
     2.2 2.2                                                                                                                                 2.2 2.2
                                                                              2.1 2.1 2.1
                                                                                             2.0 2.0             2.0         2.0 2.0
                                                                                                                       1.9             1.9

          Backpackers                        Holiday Parks                           Motels                                Hotels             Total Average

     4.3.5.                  SPEND BY VISITORS TO AUCKL AND
     Spend by visitors to Auckland has also grown significantly, increasing by 42% ($2.2b) over the five years from 2012-
     2016 and is in line with national spend patterns. Additionally, Auckland’s share of visitor spend has risen from 28% in
     2012 to 29% in 2016, reflecting minimal change, as a share of total visitor spend nation-wide.

     Figure 10: New Zealand visitor spend (2012-2016)21

                                                          Auckland                                                 Rest of NZ

                                                                                                                                                   $18.5b
                                                                                                                             $17.0b
                                                                                       $15.4b
                                                       $14.2b
                  $13.6b

                                                                                                                             $7.0b                     $7.5b
                                                                                        $6.1b
                  $5.3b                                $5.4b

                   $2.9k                               $2.9k                            $3.1k                                $3.2k                     $3.1k

                   2012                                 2013                             2014                                2015                      2016

     20
          Stats NZ, ‘Commercial Accommodation Monitor: September 2017’. 2017.
     21
          Infometrics, ‘Auckland Economic Profile’. [accessed 12 September 2017].

16   D E ST I N AT I O N A K L ST R AT E GY - S U P P O RT I N G D O C U M E N TAT I O N | S E T T I N G T H E S C E N E
4.3.6.             VISITOR FORECASTS
     By 2023, MBIE forecast that New Zealand will see 4.9m international visitor arrivals. To demonstrate estimated
     international arrivals into Auckland specifically, a number of scenarios have been created (Figure 11).

     • A low scenario: This is based on a status quo scenario and assumes Auckland’s share of New Zealand’s visitation
          remains similar to their historic share (which has averaged 69% over the past 10 years). Based on this scenario,
          Auckland’s international visitation can be expected to grow by 28% (740,000 visitors) by 2023.

     •    A
           medium growth scenario: This is based on the assumption that Auckland will be able to capture a stronger

          percentage share of inbound arrivals, increasing from 69% in 2017 to 75% by 2023. Based on this scenario,
          Auckland’s international visitation can be expected to grow by 39% (1m visitors).

     • A high (stretch) growth scenario: This is based on the assumption that Auckland is able to capture a far greater
          share of the inbound market, particularly through: growing a strong short-break Australian market; having a
          stronger focus on off peak season events; and by having a far stronger domestic marketing programme. Under
          this scenario, Auckland’s international visitation can be expected to grow by 52% (1.4m visitors) and its share of
          total New Zealand visitation increases from 69% in 2017 to 82% by 2023. This scenario can only be achieved if
          many of the key factors in this Strategy are addressed on a timely basis.

     Figure 11: Auckland visitor forecasts – low, medium and high growth scenarios

                Low (Status Quo) Growth                          Medium Growth                         High (Stretch) Growth   Total NZ

         6.0m                                                                                                                             6.0m

         5.0m                                                                                                                             5.0m

         4.0m                                                                                                                             4.0m

         3.0m                                                                                                                             3.0m

         2.0m                                                                                                                             2.0m

         1.0m                                                                                                                             1.0m

          .0m                                                                                                                             .0m
                 2008 2009 2010 2011 2012 2013 2014 2015 2016 2017 2018 2019 2020 2021 2022

17   D E ST I N AT I O N A K L ST R AT E GY - S U P P O RT I N G D O C U M E N TAT I O N | S E T T I N G T H E S C E N E
4.4.             VALUE OF THE VISITOR ECONOMY
     Over the past 10 years, Auckland’s visitor economy has grown, with tourism’s GDP contribution value
     increasing by 23% ($511m).

     Figure 12: Tourism’s GDP22

                                                                                          Auckland
                                                                                                                                                    $2.77b
                                                                                              $2.53b            $2.50b                     $2.61b
                                                                                                                                 $2.48b
          $2.26b          $2.32b           $2.30b            $2.32b           $2.33b

            2007             2008            2009             2010              2011             2012             2013             2014     2015     2016

     While the level of visitation to Auckland has grown significantly, tourism-related employment has fluctuated over
     the past 10 years. This is in spite of the need for significantly more workers to enter the industry to fill positions.

     With the rapid growth of the New Zealand economy overall, skilled and semi-skilled workers have had much choice
     across industry sectors within Auckland, leading to significant competition amongst industry sectors to engage
     workers. This has also resulted in higher wages being achieved.

     As the tourism and hospitality sector is often seen as a less competitive wage sector than others, this is thought to
     have resulted in fairly low growth in jobs in spite of the increasing demand for more workers in the sector.

     Figure 13: Tourism employment23

                                                                                           Auckland

             $59k              60k             60k                                                                                                   60k

                                                                 57k                                                                        57k
                                                                                                  56k
                                                                                                                   54k              54k
                                                                                 54k

              2007            2008             2009             2010             2011             2012             2013             2014    2015     2016

     22
          Infometrics, ‘Auckland Economic Profile’. 2017,  [accessed 5 October 2017].
     23
          Ibid

18   D E ST I N AT I O N A K L ST R AT E GY - S U P P O RT I N G D O C U M E N TAT I O N | S E T T I N G T H E S C E N E
Figure 14: Population forecasts24

                                                          Auckland’s Population                            NZ’s Population

                                                                                                                           5.50m   5.64m
                                                                       5.15m                       5.34m
               4.74m                       4.95m

                                                                                                                           2.12m   2.23m
                                                                       1.89m                       2.01m
               1.65m                       1.77m

                2018                        2023                        2028                        2033                   2038    2043

      Auckland data: ATEED, ‘Auckland Index - Data Tables - People’. 2017.
     24

     NZ data: Stats NZ, ‘National Population Estimates: As at 30 June’. 2017.

19   D E ST I N AT I O N A K L ST R AT E GY - S U P P O RT I N G D O C U M E N TAT I O N | S E T T I N G T H E S C E N E
5. Surveys
                   5.1.           AU C K L A N D I N D U ST RY STA K E H O L D E R S U RV E Y
                   Question 1 and 2: What is your name and what business do you represent?
                   Question 1 and 2 were optional and requested the respondent’s name and company they represent.
                   The results of these have been kept confidential for privacy reasons.

                   Question 3: What sector do you primarily                                   Question 4: What are the three major strengths of
                   operate in?                                                                Auckland as a destination?

                    Response category                      Count            %                  Response category                       Count   %
                    Attractions/experiences                   35          24.8%                Variety                                  80     19%
                    International education                    21         14.9%                Accessibility/connectivity/location      75     18%
                    Accommodation                              18         12.8%                Natural beauty (city and environment)    40     9%
                    Elected Member                             18         12.8%                Attractions/experiences                  36     9%
                    Events                                     15         10.6%                Waterfront/harbour                       32     8%
                    Hospitality                                7          5.0%                 Arts/culture/heritage                    28     7%
                    Government                                 6          4.3%                 NZ's largest city                        28     7%
                    Other                                      5          3.5%                 F&B offering                             16     4%
                    Business events                            4          2.8%                 Events & event infrastructure            13     3%
                    Tour guiding                               4          2.8%                 Safety                                   12     3%
                    Iwi                                        3           2.1%                Other                                     11    3%
                    Transport                                  3           2.1%                People                                   10     2%
                    Property & development                     2           1.4%                Proximity to nature                      10     2%
                                                                                               Innovation                                8     2%
                                                                                               Accommodation                             6     1%
                                                                                               Climate                                   5     1%
                                                                                               Liveability                               4     1%
                                                                                               Uniqueness                                3     1%
                                                                                               Cleanliness                               3     1%
                                                                                               No response/not relevant                  3     1%

20   D E ST I N AT I O N A K L ST R AT E GY - S U P P O RT I N G D O C U M E N TAT I O N | S U RV E YS
Question 5: What do you consider to be the three                                          Question 6: What do you believe a visitor's
     key elements Auckland lacks relative to other                                             experience of Auckland should be like in ten
     international destinations?                                                               years’ time?

     Response category                                       Count            %                 Response category                          Count   %
     Connectivity/transport                                     156          37%                Improved connectivity/transport             59     32%
     Branding & promotion                                       57          13.4%               Focus on environment/sustainability         17     9%
     Accommodation                                              29            7%                Vibrant, world-class, international city    17     9%
     Attractions/experiences                                    23           5%                 More attractions & experiences              12     7%
     Arts/culture/heritage                                      22           5%                 Stronger display of culture                 10     5%
     Central hub                                                 19          4%                 More diverse F&B offering                    8     4%
     Affordability                                               17          4%                 Other                                        7     4%
     No response/not relevant                                    12           3%                A destination in its own right               7     4%
     Other infrastructure                                        11           3%                Diversity of accommodation                   6     3%
     Events & event infrastructure                               9            2%                Offering an authentic experience             6     3%
     Other                                                       8            2%                A safe city                                  6     3%
     Waterfront/harbour                                          8            2%                No response/not relevant                     6     3%
     Safety                                                      8            2%                Welcoming & beyond expectations              4     2%
     Professional skills                                         7            2%                A larger night time economy                  4     2%
     Scale                                                       5            1%                A revitalised CBD                            3     2%
     Climate                                                     5            1%                An innovative city                           3     2%
     Retail                                                      4            1%                Grow events & event infrastructure           3     2%
     Night time economy                                          4            1%                No significant changes                       3     2%
     Government policies/lack of coordination                    4            1%                A sustainable city                           1     1%
     Other infrastructure                                        4            1%
     Environment/sustainability                                  4           1.2%
     Economic growth                                             3            1%
     Population growth                                           2           1.2%
     Innovation                                                  1          0.2%
     Public spaces                                               1          0.2%

21   D E ST I N AT I O N A K L ST R AT E GY - S U P P O RT I N G D O C U M E N TAT I O N | S U RV E YS
Question 7: What are the three major challenges or impediments to growing
     Auckland as a more sustainable (environmentally, economically, culturally
     and socially) destination over the next ten years, and why?

     Response category                                                            Count              %
     Connectivity/transport                                                           81            19%
     Branding & promotion                                                            40             9%
     Government policies/lack of coordination                                        37             9%
     Environment/sustainability                                                      26             6%
     No response/not relevant                                                        24             6%
     Funding (private and public)                                                     21            5%
     Accommodation                                                                    19            4%
     Affordability                                                                    17            4%
     Other infrastructure                                                             16            4%
     Safety                                                                           14            3%
     Population growth                                                                13            3%
     Government policies                                                             10             2%
     Professional skills                                                              9             2%
     Social cohesion                                                                  8             2%
     Visitor overcrowding                                                             8             2%
     Congestion                                                                       8             2%
     Scale                                                                            7             2%
     Arts/culture/heritage                                                            7             2%
     Economic growth                                                                  7             2%
     Immigration                                                                      7             2%
     Attractions/experiences                                                          7             2%
     Events & event infrastructure                                                    6              1%
     Waterfront/harbour                                                               5              1%
     Other                                                                            5              1%
     Public transport                                                                 4              1%
     Public space                                                                     3              1%
     Climate                                                                          3            0.7%
     Innovation                                                                       3              1%
     Sustainable tourism                                                              2            0.5%
     Infrastructure development                                                       2            0.5%
     Transport infrastructure                                                         2             0%
     CBD revitalisation                                                               1            0.2%
     Low density housing                                                              1            0.2%

22   D E ST I N AT I O N A K L ST R AT E GY - S U P P O RT I N G D O C U M E N TAT I O N | S U RV E YS
Question 8: ATEED’s current mandate in the destination sector includes the following areas.
     Thinking about the next five years, please rank these activities in terms of importance.

      Response category                                          1–            2–             3–             4–       5–       6–      TOTAL   SCORE
      To promote Auckland to domestic visitor                  6.67%         17.50%         14.17%          21.67%   20.83%   19.17%
                                                                                                                                        120     3.10
      markets                                                     8             21             17             26       25      23

      To promote Auckland to international                    50.00%         24.17%         16.67%          1.67%    4.17%    3.33%
                                                                                                                                        120     5.04
      visitor markets                                            60            29             20              2        5        4

      To promote Auckland to international                     5.00%         7.50%           8.33%          15.00%   22.50%   41.67%
                                                                                                                                        120     2.33
      students                                                    6             9             10              18       27      50

                                                               14.17%        25.83%          19.17%         20.00%   15.00%   5.83%
     To attract and deliver major events                                                                                                120     3.87
                                                                 17             31            23              24       18       7

                                                               0.83%         15.00%         22.50%          25.83%   24.17%   11.67%
     To attract and deliver business events                                                                                             120     3.08
                                                                  1            18             27              31       29       14

     To support destination and product                       23.33%         10.00%          19.17%         15.83%   13.33%   18.33%
                                                                                                                                        120     3.59
     development across all of these areas                       28             12            23              19       16      22

     Question 9: If a revised Destination Auckland Strategy could only achieve
     one major outcome in the next five years, what should it be, and why?

      Response category                                                              Count            %
      Improved connectivity/transport                                                 28              20%
      Branding & promotion                                                            17              12%
      Attract/support more events                                                     15              11%
      Other                                                                            11             8%
      Sustainable growth                                                              10              7%
      Increase visitation &/or yield                                                  10              7%
      A destination in its own right                                                   6              4%
      Diversity of accommodation                                                       5              4%
     Support/plan for America's Cup                                                    5              4%
     More attractions & experiences                                                    5              4%
     Liveability                                                                       5              4%
     No response/not relevant                                                          4              3%
     Focus on higher-end travellers                                                    3              2%
     Spread events more evenly                                                         3              2%
     Focus on all parts of AKL                                                         3              2%
     Industry engagement/collaboration                                                 2              1%
     Supporting the arts                                                               2              1%
     Educate locals on the value of tourism                                            2              1%
     Reduce seasonality of visitation                                                  2              1%
     Balanced focus on events and tourism                                              1              1%
     Night time economy                                                                1              1%

23   D E ST I N AT I O N A K L ST R AT E GY - S U P P O RT I N G D O C U M E N TAT I O N | S U RV E YS
5.2.         AUCKL AND VISITOR SURVEY (DOMESTIC MARKET)
     As part of the development of this Strategy, surveys were undertaken with two groups of Auckland visitors:

     1. Auckland residents who undertake day or overnight trips within the Auckland region

     2. Domestic visitors to Auckland who had visited Auckland at least once in the previous 12 months. This group
        was split into ‘Drive’ market visitors (north of Wellington) and ‘Fly’ market visitors (Wellington and south)

     The surveys were designed by ATEED and administered by Pure Profile using their respondent panel.
     Surveying was conducted over the period 20-25 October 2017. This document presents a summary of the key
     findings from these surveys.

     WHO DID WE TALK TO?
     The demographic characteristics of those interviewed are in the table below.

     Table 1: Demographic characteristics of Auckland Resident and Domestic Visitor survey respondents

      Auckland residents                               %                  Domestic visitors                 %     Drive   Fly
      Gender                                                              Gender
      Male                                            47%                 Male                              45%    42%    48%
      Female                                          53%                 Female                            55%    58%    52%
      Age                                                                 Age
      15-29 years                                     22%                 15-29 years                       21%    18%    24%
      30-39 years                                    20%                  30-39 years                       17%    16%    19%
      40-49 years                                     19%                 40-49 years                       19%   20%     19%
      50-59 years                                     18%                 50-59 years                       17%    19%    16%
      60-69 years                                     12%                 60-69 years                       15%    15%    15%
      70+ years                                       9%                  70+ years                         9%     11%    7%
      Household                                                           Household
      Living alone                                    14%                 Living alone                      13%    13%    12%
      Couple, with no children                        18%                 Couple, with no children          18%    14%    21%
      Couple, children have left home                 13%                 Couple, children have left home   19%    22%    16%
      Parents, with children at home                  41%                 Parents, with children at home    35%    35%    36%
      Other                                           15%                 Other                             15%    15%    15%
      Base                                            403                 Base                              405    201    204

24   D E ST I N AT I O N A K L ST R AT E GY - S U P P O RT I N G D O C U M E N TAT I O N | S U RV E YS
HOW OFTEN DID THEY VISIT AUCKLAND?
     Residents were asked how often:

     1. They go on an overnight or a day trip/outing for leisure within the Auckland region (Warkworth in the north to
        Pukekohe in the south, including Hauraki Gulf Islands) that is outside of the places they usually go day to day?

     2. In the last 12 months they have had friends or relatives from outside of Auckland staying with them on a visit to
        Auckland?

     Non-Auckland residents were asked how often in the last 12 months they have visited the Auckland region
     (Warkworth in the north to Pukekohe in the south, including Hauraki Gulf Islands)?

     Key results were:

     • Among Auckland residents, approximately one in three (31%) go for a day or overnight trip within Auckland at
        least once a month. Two in five (41%) travel within Auckland several times per annum, with the remainder (28%)
        traveling within Auckland once per annum or less often (including never).

     • Only 5% of residents have had friends or relatives staying with them several times a month in the past 12 months.
        Two in five (41%) have guests staying a few times per annum, but more than half (53%) have guests staying once or
        never in the past 12 months.

     • Among domestic visitors, those within the drive market were more frequent visitors with two thirds (67%) visiting
        several times a year or more often.

     • The majority of the fly market were less frequent visitors, with more than half (58%) saying they visit once per
        annum or less often.

     Figure 15: Frequency of visitation to Auckland

                 AUCKL AND RESIDENTS                                                                            D O M E S T I C V I S I TO R S

                                             1%
      Once or more per week                       9%                                                                                   1%
                                                                                                    Once or more per week
                                                                                                                                       1%

                                               4%
       A few times per month                              22%
                                                                                                                                        6%
                                                                                                         A few times per month
                                                                                                                                            10%
                                                                      41%
       Several times per year                                         41%
                                                                                                                                                          35%
                                                                                                         Several times per year
                                                                   36%                                                                                                56%
         Once per year or less
                                                        19%

                                                       17%                                                                                                             58%
                                Never                                                                     Once per year or less
                                                  9%                                                                                                      34%
                                                                                                                                  0%
                                                                                                                                       10%
                                                                                                                                              20%
                                                                                                                                                    30%
                                                                                                                                                          40%
                                                                                                                                                                50%
                                                                                                                                                                      60%
                                                                                                                                                                            70%

                                          0% 10% 20% 30% 40% 50%

             Frequency of having friends/relatives                                                                                          Fly           Drive
             stay on a visit to Auckland in last 12 months
             Frequency of a day/overnight trip
             within Auckland

25   D E ST I N AT I O N A K L ST R AT E GY - S U P P O RT I N G D O C U M E N TAT I O N | S U RV E YS
WHY DID THEY COME TO AUCKLAND?
                   Domestic visitors to Auckland were asked the main reasons they come to Auckland:
in reason for visiting Auckland
                   • Domestic visitors from the fly market (Wellington and the South Island) were more likely than drive visitors to be
                    coming for leisure purposes - including holiday/leisure (35%) and events/concerts (15%) – or for business purposes
                    (10%).

                 • In contrast, drive visitors were significantly more likely to be coming mainly to visit friends and relatives (33%) or for
                    a mix or reasons (20%).

                 Figure 16: Main reason for visiting Auckland

                                                                             D O M E S T I C V I S I TO R S

                  Mainly for holiday/leisure
                                                                                                                                   22%

                                                                                                               12%
                 Mainly for events/concerts
                                                                                                   12%

                                                                                             10%
                                 Mainly for work                        4%

                                                                                                                                               26%
                                  Mainly for VFR
                                                                                                                                                           33%

                                                                                              11%
                           A mix of the above                                                                                20%

                                                                        4%
                                              Other
                                                                                  7%

                                                        0%              5%             10%               15%             20%             25%         30%    35%   40%

                                                                                                    Fly              Drive

                 FAVOURITE PLACES
                 Both Auckland residents and domestic visitors were asked their favourite places to visit within Auckland.

                 • It is clear that when Auckland residents are travelling within Auckland on a day or overnight trip, their strong
                    preference is to get out of the city with Waiheke Island (19%), beaches (unspecified, 14%), Piha (12%), the
                    Waitākeres (11%), Muriwai (9%) and Warkworth (9%) comprising their top 6 destinations.

                 • By contrast, visitors from out of Auckland are looking for city-based experiences, with the CBD (25%), the Sky
                    Tower (14%), Auckland Zoo (13%), shopping malls (12%) and Auckland Museum (9%) comprising their top 5 favourite
                    places within Auckland.

                 • There are some differences between drive and fly visitors that are consistent: fly visitors being more likely to be
                    here for holiday/leisure purposes; and drive visitors being more likely to be visiting family.

       26        D E ST I N AT I O N A K L ST R AT E GY - S U P P O RT I N G D O C U M E N TAT I O N | S U RV E YS
Table 2: Favourite places to visit in Auckland

      Auckland residents                               %                   Domestic residents                    %       Drive   Fly
      Waiheke Island                                   19%                 The Auckland CDB/City Centre/         25%      22%    28%
                                                                           Queen St
      Beaches/Beach lands (unspecific)                 14%
                                                                           Sky Tower                             14%      12%    16%
      Piha Beach                                       12%
                                                                           Auckland Zoo                          13%      12%    13%
      Waitakere                                        11%
                                                                           Malls/Shopping Centres (unspecific)   12%      13%    11%
      Muriwai Beach                                    9%
                                                                           Museum (unspecific)                   9%       11%    6%
      Warkworth                                        9%
                                                                           Viaduct Harbour                       8%       5%     12%
      The Auckland CDB/City Centre/                    8%
      Queen St                                                             North Shore                           8%       5%     10%
      Mission Bay                                      8%                  Beaches/Beach lands (unspecific)      7%       8%     6%
      Parks/Gardens (unspecific)                       8%                  Kelly Tarltons                        7%       8%     5%
      Matakana                                         7%                  Auckland Waterfront                   6%       3%     10%
      Orewa Beach                                      7%                  Waiheke Island                        6%       4%     8%
      Museum (unspecific)                              6%                  Restaurants (unspecific)              6%       6%     5%
      Auckland Zoo                                     5%                  Family and Friends                    5%       7%     3%
      Devonport/Devonport Beach                        5%                  Rainbow's End                         5%       7%     3%
      Takapuna Beach                                   4%                  Airport (unspecific)                  5%       6%     3%
      Base                                             368                 Base                                  405      201    204

     FAVOURITE ACTIVITIES
     Both Aucklanders and domestic visitors were asked their favourite activities when they visit Auckland.

     • The favourite activities of Aucklanders reflect that they like to get out of the city and enjoy outdoor activities such
        as walking (34%), swimming (17%), beach walking (14%) and hiking (12%). Aucklanders also enjoy eating out (18%).

     • Shopping (36%) is clearly the favourite activity of domestic visitors, followed by eating out (22%), visiting friends
        and relatives (11%) and walking (11%). There is little difference in favourite activities between drive and fly visitors.

     Table 3: Favourite activities to do in Auckland

      Auckland residents                         %                   Domestic residents                    %     Drive     Fly
      Walking                                   34%                  Shopping/Markets                    36%      35%      37%
      Eating Out/Dinner Out                      18%                 Eating Out/Dinner Out               22%      21%      22%
      Swimming                                   17%                 Visit Friends and Family            18%      18%      18%
      Beach Walk                                 14%                 Sightseeing                          11%      8%      14%
      Hiking                                     12%                 Walking                              11%     11%      10%
      Shopping/Markets                           11%                 Concerts                            10%      11%       9%
      Sightseeing                                10%                 Zoo                                   6%      7%       4%
      Relaxing                                   9%                  Beach Walk                           5%       7%       4%
      Fishing                                    7%                  Movies/ Shows/ Theatre               5%       6%       4%
      Visit Friends and Family                   7%                  Casino/ Gambling                     5%       4%       6%
      Bush Walk                                  5%                  Visiting Sky Tower/Sky City          5%       4%       6%
      Camping                                    5%                  Museum                               5%       5%       4%
      Wine Tour/Testing                          4%                  Rainbow's End                        4%       3%       6%
      Movies/ Shows/ Theatre                     4%                  Sports                               4%       3%       3%
      Picnic                                     4%                  Art Galleries                        4%       3%       3%
      Base                                       368                 Base                                406      201      205

27   D E ST I N AT I O N A K L ST R AT E GY - S U P P O RT I N G D O C U M E N TAT I O N | S U RV E YS
LIKE TO DO THE MOST, OR RECOMMENDED                                           Table 4: Things Auckland residents like to do
     Auckland residents were asked the things they                                 most with visitors or recommend they do
     like to do most with visitors or they recommend
     visitors do while in Auckland.                                                 Auckland residents                    %
                                                                                    Beaches                               24%
     • Recommendations reflect a mixture of                                         Auckland Museum                       21%
        activities and places that residents like to do                             Sky Tower                             17%
        themselves and things that visitors tend to                                 Auckland Zoo                          15%
        favour.                                                                     Waiheke Island                        15%
                                                                                    Eating Out/Dinner Out                 13%
     • Beaches (24%) are the most popular
                                                                                    Shopping                              11%
        recommendation followed by key attractions
                                                                                    Sightseeing                           8%
        including the Auckland Museum (21%), the Sky
                                                                                    Walking                               8%
        Tower (17%), Auckland Zoo (15%) and Waiheke
                                                                                    Ferry Trip                            7%
        Island (15%).
                                                                                    Restaurants                           7%
                                                                                    Kelly Tarltons                        6%
                                                                                    West Coast Beaches                    5%
                                                                                    Waterfront                            5%
                                                                                    Devonport                             4%
                                                                                    Base                                  336

     THINGS LIKED LEAST ABOUT AUCKLAND                                             Table 5: Things domestic visitors like least about Auckland
     Domestic visitors were asked the things they like
     least about the Auckland region as a place to visit.                           Domestic visitors                           %     Drive   Fly
                                                                                    Busy/Lots of traffic/Congestion             65%    68%    63%
     • Clearly the busyness of Auckland – particularly                              Crowded City/Too much people                28%    27%    29%
        in relation to traffic and traffic congestion –                             Cost of living/Expensive City               9%     9%     8%
        is the number one thing that visitors like least                            Better parking facility                     5%     5%     4%

        about Auckland, mentioned by two thirds (65%).                              Better/Reliable public transport            4%     4%     4%
                                                                                    Better roads/Infrastructure                 4%     3%     4%
     • The crowdedness of the city (28%) is the second                              Cheaper accomodation                        4%     2%     5%
        most mentioned dislike, followed by cost (9%).                              Need more friendly people/character         4%     6%     1%
                                                                                    Beggars/Homeless on the street              3%     4%     3%
     • Perceptions are very similar across drive and fly
                                                                                    Don't know/None                             3%     3%     4%
        visitors.
                                                                                    Humidity/ Humid weather/Better              3%     2%     3%
                                                                                    weather/Atmosphere

                                                                                    Difficulty in getting around/Easier         2%     3%     2%
                                                                                    access to places

                                                                                    Pollution                                   2%     2%     2%
                                                                                    Free parking                                2%     3%     0%
                                                                                    Base                                        406    201    205

28   D E ST I N AT I O N A K L ST R AT E GY - S U P P O RT I N G D O C U M E N TAT I O N | S U RV E YS
WHAT AUCKLAND LACKS
     Both Auckland residents and domestic visitors were asked what Auckland lacks as a place to visit compared to
     other cities they had been to.

     • Better/reliable public transport is the key thing considered lacking by both residents and visitors to Auckland
        (both 19%).

     • Beyond public transport, residents feel that Auckland lacks attraction type offerings such as tourist attractions/
        sightseeing (4%), more entertainment/activities (4%) and theme/water/amusement parks (4%). Cheaper transport
        (4%) is also mentioned.

     • Among visitors, the view differs, with the most frequently made comments more focussed around the need for
        better transport infrastructure and improved accessibility.

     • Again, there is little difference between the views of drive and fly visitors.

     Table 6: What Auckland lacks as a place to visit

      Auckland residents                                   %                  Domestic visitors                     %     Drive   Fly
      Better/Reliable public transport                    19%                 Better/Reliable public transport      19%    19%    19%
      Tourist attractions/Sightseeing                      4%                 Busy/Lots of traffic/Congestion       9%     9%     8%
      Cheaper transport/Travel                             4%                 Need more friendly people/character   7%     6%     7%
      Lack of entertainment/Activities                                        Better roads/Infrastructure           4%     4%     4%
                                                           4%
      (Events/Concerts/Shows)
                                                                              Crowded City/Too many people          3%     4%     2%
      Theme parks/Water parks/
                                                           4%                 Difficulty in getting around/Easier
      Amuesments parks                                                                                              3%     2%     3%
                                                                              access to places
      Busy/Lots of traffic/Congestion                      3%
                                                                              Cheaper accomodation                  3%     3%     2%
      Historical places                                    3%
                                                                              Better greenery/Nature                3%     1%     4%
      Better parking facility                              2%
                                                                              Better parking facility               2%     2%     2%
      Gardens/Parks                                        2%
                                                                              Railway from Airport                  2%     3%     1%
      Better shopping options                              2%
                                                                              Humidity/ Humid weather/Better
                                                                                                                    2%     1%     3%
      More food outlets/Cafe shops                         2%                 weather/Atmosphere
      Better roads/Infrastructure                          2%                 More cultural activities/Kiwi vibes   2%     2%     1%
      Need more friendly people/character                  2%                 Cheaper transport/Travel              2%     2%     1%
      Cheaper accomodation                                 2%                 Cost of living/Expensive City         2%     2%     1%
      Cost of living/Expensive City                        2%                 Free parking                          1%     2%     0%
      Base                                                403                 Base                                  406    201    205

29   D E ST I N AT I O N A K L ST R AT E GY - S U P P O RT I N G D O C U M E N TAT I O N | S U RV E YS
ONE THING TO CHANGE
                Both domestic visitors and Auckland residents were asked to name the one thing that Auckland could change to
               make it a more attractive destination for visitors.
ng Auckland could change to make it more attractive to visitors.
                • For visitors, the key things Auckland should look to change are reducing traffic congestion (22%) and improving
                    public transport (21%).

                • Local residents also agree that these are the key things to change, but are much stronger on public transport
                    being the key area of focus (56%).

                Table 7: The one thing Auckland could change to make it more attractive to visitors.

                  Reduce traffic congestion                                                           22%
                                                                                                                27%

                                                                                                    21%
                       Better public transport                                                                                                  56%

                                                                        6%
                 Better roads/infrastructure                             7%

                                                                       5%
                                    Too crowded                  3%

                                                                       5%
                          Railway from airport                         5%

                                                                 3%
                                   Better parking                      5%

                                                                  3%
                        Cheaper cost of living                                   10%

                                                                 3%
                   Cheaper transport/travel                                 7%

                                                                 3%
                                       Cleanliness                     5%

                                                               2%
                                 Light rail/trams             1%

                                                        0%                   10%              20%                    30%     40%          50%     60%

                                                                                            Domestic visitors              Auckland Residents

       30        D E ST I N AT I O N A K L ST R AT E GY - S U P P O RT I N G D O C U M E N TAT I O N | S U RV E YS
6. Auckland As A Competitive
                    Destination City
                    6.1.           DEFINING COMPETITIVENESS
                    Definitions of city competitiveness tend to focus on liveability and economic performance attributes.
                    To be relevant to this strategy, Auckland’s competitiveness as a global city needed to be assessed.
                    This included assessing Auckland as a destination for not only visitors, but investors, industry and the
                    host community. The competitiveness of Auckland against other global relevant cities is important
                    from a destination management perspective for ensuring Auckland retains and grows its competitive
                    edge, especially as a destination to attract major events, business events and international students.

                    Figure 17 provides a summary of the 54 metrics applied to assess how Auckland ranks as a competitive
                    destination as well as for liveability, environment, education and research.

     Figure 17: Comparative metrics

                    Economic                                   Physical                                     Education                                  Economic
                    Strength                                   Capital                                      & Research                                 Strength

     Annual Household Income; GDP                     Internet Speed (average);                Adult Literacy Rate; Education                  Arcadis' Sustainable Cities
     per capita; Unemployment Rate;               Number of unique IPv4 Addresses              level (degree level or higher) %             Index; Arthur D LIttle's Mobility
       Working Age Population per                 per capita; Public transport daily            of population; Research and                  Index; Glocal Cities Index by
                  capita                          ridership (Public bus) per capita;            Dvelopment Investment % of                 A.T. Kearney; IESE's Cities Motion
                                                   Public transport daily ridership               GDP; Top 200 Universities                Index; Mercer's Quality of Living
                                                    (Rail including MRT & LRT) per                                                          Rankings; Monocle Magazines
                                                      capita; Quality of Trade &                                                              Top 25 Lveable Cities; Mori's
                                                    Transport Infrastructure (WB)                                                          Global Power City Index; World
                                                                                                                                                   Happiness Report

                    Environment                                 Inclusivity                                 Governance                                  Liveability

        Air Quality; CO2 Emissions                  Ethnic Fractionalisation Index;            Corruption Perceptions Index;                 Global Liveability Score (EIU);
      Equivalent per capita (tCO2e/                 Freedom in the World Survery;             Ease of doing Business; Number               Cost of Living Index; Crime rate
          capita); Environmental                            Gini Coefficient                     of Embassies/Consulates                  (homocides per 100,000 people);
     Performance Index; Public green                                                                                                       Healthcare Access and Quality;
     space (m2) per capita; Recycling                                                                                                       Housing Affordability (Median
                   Rate                                                                                                                       Multiple); Life expectancy -
                                                                                                                                           female; Life expectancy - male;
                                                                                                                                               Purchasing Power (UBS)

                    Cultural                                     Global
                   Character                                     Appeal

           Number of museums;                      International visitation; 3* plus
       Restaurants per capita; Retail             hotels; 5* Star Hotels; Number of
       Space (m2) per capita; Value              Airlines Flying In' Number of Cruise
       of Cultural Goods Exports (per                Ship Port Calls; Fortune 500
      captia); Value of Cultural Goods           Company Headquarters; Number
                Exports (total)                   of hotel rooms per international
                                                   visitor; Number of international
                                                               students

31   D E ST I N AT I O N A K L ST R AT E GY - S U P P O RT I N G D O C U M E N TAT I O N | A C O M P E T I T I V E D E ST I N AT I O N C I T Y
You can also read