ALEXANDRIA TRANSIT COMPANY (DASH) TRANSIT DEVELOPMENT PLAN - FY 2021 - FY 2026 - ADOPTED BY ATC BOARD OF DIRECTORS ON MAY 27, 2020 - DASH Bus
←
→
Page content transcription
If your browser does not render page correctly, please read the page content below
FY 2021 – FY 2026
ALEXANDRIA TRANSIT COMPANY (DASH)
    TRANSIT DEVELOPMENT PLAN

ADOPTED BY ATC BOARD OF DIRECTORS ON MAY 27, 2020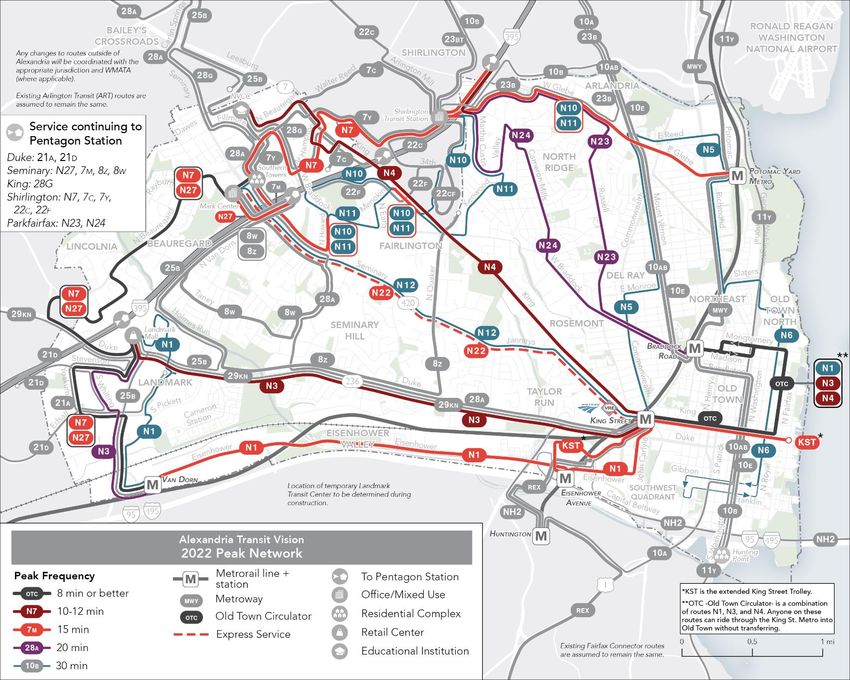
FY 2021 - FY 2026 ATC TRANSIT DEVELOPMENT PLAN
                                                 TABLE OF CONTENTS

1.0 / Executive Summary .................................................................................................................... 1
          1.1 System Performance .................................................................................................................. 1
          1.2 FY 2021 Service & Fare Changes ................................................................................................ 1
          1.3 FY 2022 – FY 2026 Service & Fare Changes ............................................................................... 3
          1.4 ATC Capital Program .................................................................................................................. 3
2.0 / TDP Background......................................................................................................................... 5
          2.1 Purpose & Format ...................................................................................................................... 5
          2.2 Process & Timeline ..................................................................................................................... 5
          2.3 Alexandria Transit Vision Plan.................................................................................................... 7
3.0 / System Summary ....................................................................................................................... 8
          3.1 Service Area ............................................................................................................................... 8
          3.2 Routes ........................................................................................................................................ 8
          3.3 Other Transit Providers ........................................................................................................... 12
          3.4 Passenger Facilities .................................................................................................................. 12
          3.5 Bus Fleet ................................................................................................................................... 13
          3.6 Fares ......................................................................................................................................... 14
          3.7 Funding .................................................................................................................................... 14
4.0 / System Performance ................................................................................................................ 16
          4.1 Service Provided....................................................................................................................... 16
          4.2 System Ridership...................................................................................................................... 16
          4.3 Ridership by Route .................................................................................................................. 18
          4.4 Cost Efficiency .......................................................................................................................... 20
          4.5 Operating Ratio ........................................................................................................................ 21
          4.6 Service Reliability ..................................................................................................................... 21
          4.7 Access & Mobility ..................................................................................................................... 22
          4.8 System Performance Summary................................................................................................ 25
5.0 / Service & Fare Recommendations ............................................................................................ 26
          5.1 FY 2021 Service Recommendations ......................................................................................... 26
          5.2 FY 2021 Fare Recommendations ............................................................................................. 28
          5.3 FY 2022 – FY 2026 Service & Fare Recommendations ............................................................ 29
6.0 / ATC Capital Program ................................................................................................................ 39

0 | FY2021 – FY2026 ATC Transit Development Plan (FINAL)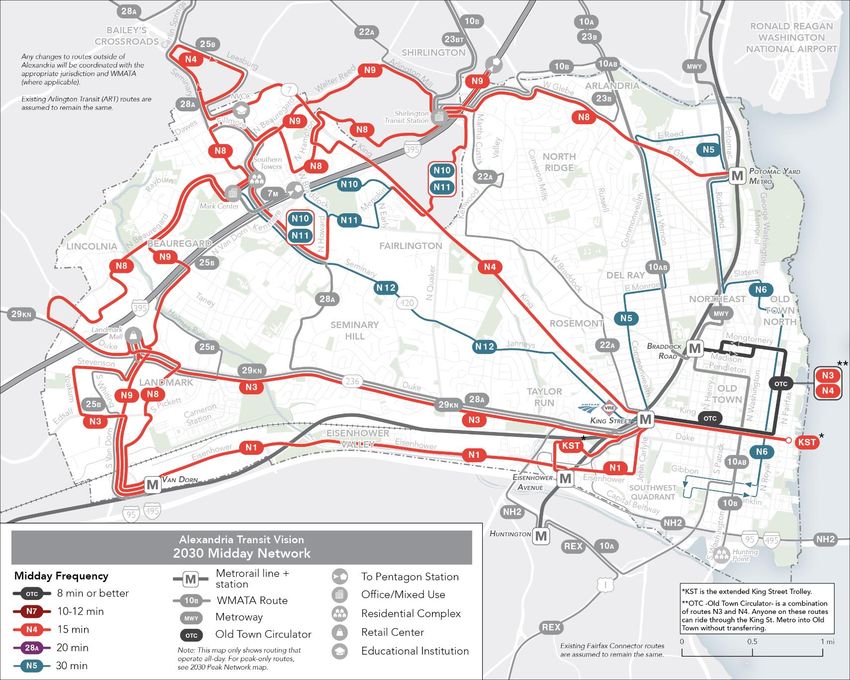
6.1 FY 2021 – FY 2030 Capital Improvement Plan (CIP)................................................................. 39
           6.2 Fleet Replacement Plan ........................................................................................................... 39
           6.3 Fleet Expansion ........................................................................................................................ 41
           6.4 Battery Pack Replacement ....................................................................................................... 41
           6.5 Electric Bus Program ................................................................................................................ 43
           6.6 DASH Facility Expansion ........................................................................................................... 44
           6.7 Technology Improvements ...................................................................................................... 44
           6.8 Other Capital Outlay Items ...................................................................................................... 46
7.0 / Public Outreach ....................................................................................................................... 47
           7.1 Feedback Summary .................................................................................................................. 47
           7.2 TDP Changes ............................................................................................................................ 48

0 | FY2021 – FY2026 ATC Transit Development Plan (FINAL)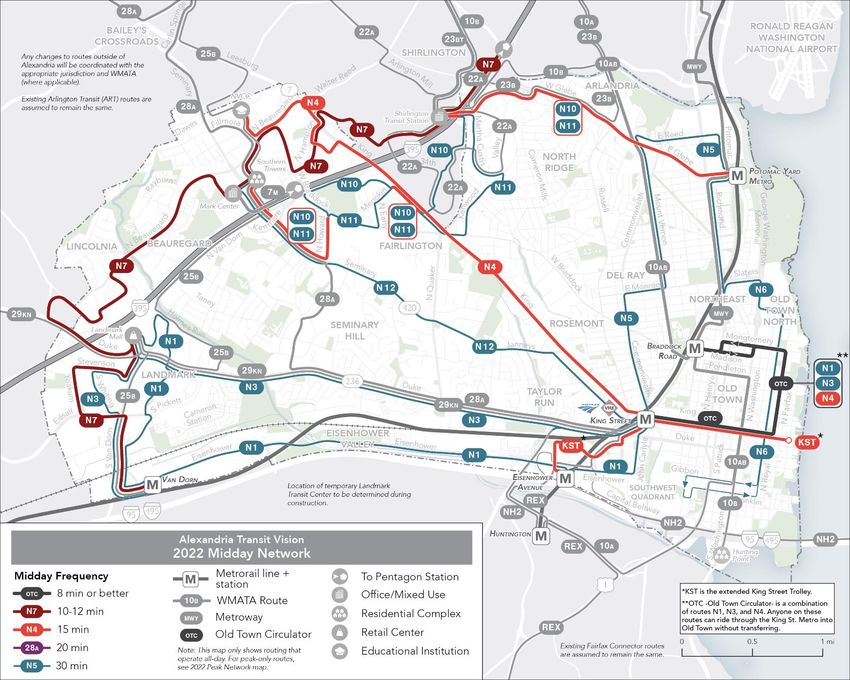
1.0 / Executive Summary

This document represents the FY 2021 – FY 2026 Transit Development Plan (TDP) for the Alexandria
Transit Company (ATC). The Alexandria Transit Company is responsible for the management, operation
and maintenance of the DASH bus system in Alexandria, Virginia.

The Transit Development Plan (TDP) provides a comprehensive vision of future service development,
fare adjustments, and capital investments based on recommendations from the General Manager, ATC
Board of Directors and DASH staff. More specifically, it evaluates current DASH system performance,
outlines projected service levels for the fiscally-constrained FY 2021 operating budget, and provides
fiscally-unconstrained guidance on future service changes and capital improvements for the remaining
five years of the six-year plan cycle (FY 2022 – FY 2026). The TDP is updated each year by DASH staff and
is subject to annual review, amendment, and adoption by the ATC Board of Directors. The document
also serves as a resource for the city staff as they consider future ATC requests for financial assistance.

The FY 2021 Transit Development Plan addresses the period beginning July 1, 2020 and ending June 30,
2026. The document has been prepared in accordance with board-adopted procedures and is divided
into four main sections – System Overview (Section 3), System Performance (Section 4), Service & Fare
Change Recommendations (Section 5), and Capital Budget (Section 6).

The key findings and recommendations of these four sections are summarized below:

1.1 / System Performance

    •   In FY 2019, DASH operated over 215,000 revenue hours of regular DASH service, which was a 1.5
        percent decrease as compared to the amount of revenue hours operated in FY 2018.

    •   DASH recorded nearly 3.8 million boardings in FY 2019, a 2.8 percent decrease from FY 2018.
        Excluding the months during the Metrorail Platform Improvement Project (PIP), the total
        decrease was only 1.2 percent from FY 2018. For comparison purposes, Metrobus average daily
        ridership in Northern Virginia was down by 4.7 percent during the same period.

    •   The DASH Operating Ratio, which measures the portion of total annual operating costs that are
        covered by revenues was 36.8 percent in FY 2019, or 4.6 percent higher than FY 2018. This
        increase is due to revenue earned in providing contract service to WMATA during the Metrorail
        Platform Improvement Project.

    •   DASH On-Time Performance was 85.2 percent in FY 2019, which represent a 3.1 percent
        improvement from FY 2018, when 82.1 percent of service was provided on time.

1.2 / FY 2021 Service & Fare Change Recommendations

    •   The following DASH service changes are proposed for FY 2021:

            o   FY 2021 Service Levels. For annual budgeting purposes, DASH projects that FY 2021
                service levels for regular DASH routes and the King Street Trolley will be roughly 241,000
                platform hours and 2,028,000 platform miles. These totals represent overall service
                decreases of 1.4 percent and 2.6 percent, respectively, from projected FY 2020 levels

1 | FY2021 – FY2026 ATC Transit Development Plan (Final)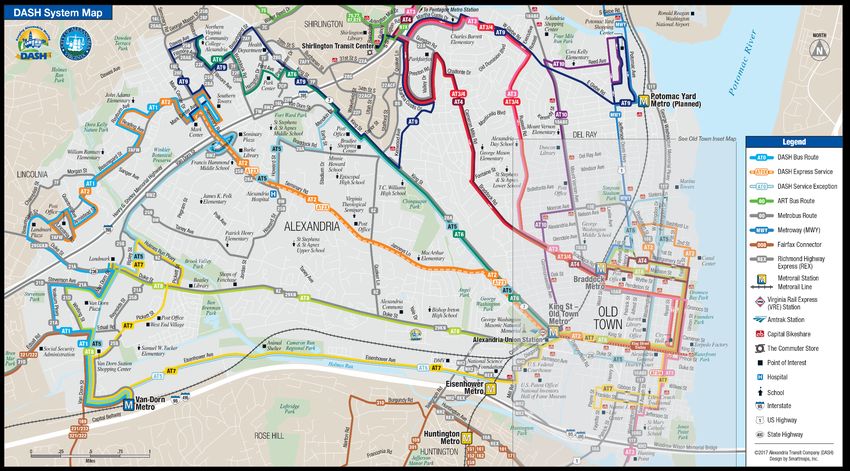
exclusive of the Commuter Choice and Platform Improvement Project service
               enhancements. The total annual service provided for FY 2021, including the I-395
               Commuter Choice improvements, is estimated to be 272,000 platform hours and
               2,359,000 platform miles.

               NOTE: Above estimates are for budgeting purposes and do not account for reduced
               service levels resulting from the COVID-19 pandemic. The actual FY 2021 total service
               levels could be significantly lower, depending on when DASH is able to return to regular
               weekday service levels.

           o   AT-4 Old Town Service Discontinuation. DASH will remove the southernmost segment
               of the AT-4 routing so that the route ends at the Braddock Road Metro Station instead
               of continuing into Old Town (Effective Fall 2020)

           o   Season Trolley Re-Route. The King Street Trolley will be re-routed as part of the King
               Street Place project, which will partially shut down the 100 block of King Street to
               vehicle traffic during certain days and times. The Trolley will continue to serve the
               Waterfront stop via a modified routing along North Lee Street, Cameron Street, and
               North Union Street.

           o   Holiday Service Plan Changes. DASH will modify its holiday operating plan so that DASH
               runs Sunday service on Thanksgiving Day, Christmas Day, and New Year’s Day instead of
               operating no regular service. This change is consistent with other regional operators
               and will benefit customers who still need to make bus trips on those days.

   •   The following DASH fare-related actions are planned for FY 2021:

           o   Fare Changes. No changes to the base fare or DASH Pass will be made in FY 2021.

           o   WMATA Regional Pass Products. If WMATA expands its regional pass offerings, DASH
               will begin allowing DASH passengers to use any WMATA pass product as valid fare
               payment, in accordance with recommendations from WMATA’s Bus Transformation
               Project. Currently, DASH accepts the 7-Day Regional Bus Pass and participates in a
               regional revenue sharing agreement that distributes funds based on pass usage. This
               planned change would expand this agreement to include all current and future WMATA
               regional passes for both bus and rail.

           o   DASH-Metrorail Transfer Discount. Contingent upon final FY 2021 WMATA budget
               decisions, DASH is planning to increase the fare discount for passengers transferring
               from Metrorail to DASH from $0.50 to $1.00. This would be a reciprocation of a
               proposed transfer discount for DASH passengers who transfer to WMATA.

           o   Free Student Rides. DASH staff will continue the “Free Student Rides” program for
               Alexandria high school students for its fourth year. This program promotes transit
               awareness and ridership among young adults who can become future DASH users.

           o   Fare-Free Days. DASH staff will explore the possibility of operating fare-free service on
               selected days to promote public transit awareness and usage. Eligible days could

2 | FY2021 – FY2026 ATC Transit Development Plan (Final)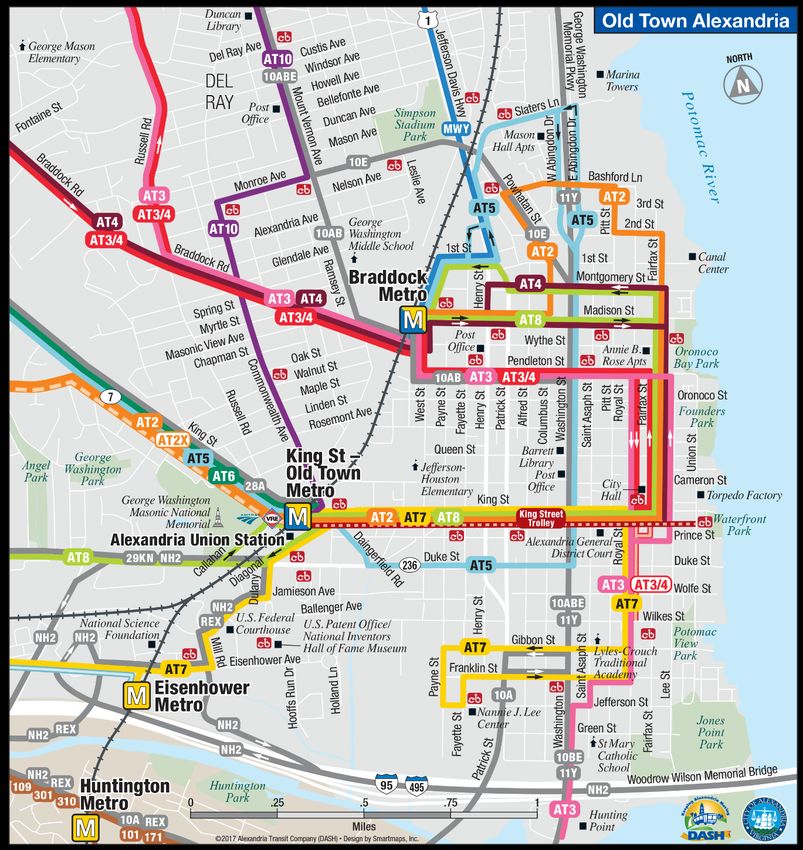
include but are not limited to holidays, election days, air quality alert days, or the
introduction of major service changes such as the new ATV network.
o Mobile Ticketing Pilot. The DASH Bus app was launched in Spring 2019 as a one-year
pilot with options for contract extensions in subsequent years. DASH staff will be
extending the pilot period through April 2021. This will allow DASH additional time to
evaluate the app and to coordinate with regional partners on potential next steps.
• I-395 Commuter Choice Program. DASH will continue the service enhancements on the AT-1
Plus and the AT-9 as part of the inaugural I-395 Commuter Choice program through the end of
FY 2021. The selected improvements are the first step towards the Alexandria Transit Vision
Plan networks and a precursor to the future West End Transitway service. DASH will apply for
additional service enhancements as identified through the Alexandria Transit Vision Plan for the
FY 2022 – FY 2023 I-395 Commuter Choice project cycle.
1.3 / FY 2022 – FY 2026 Service & Fare Change Recommendations
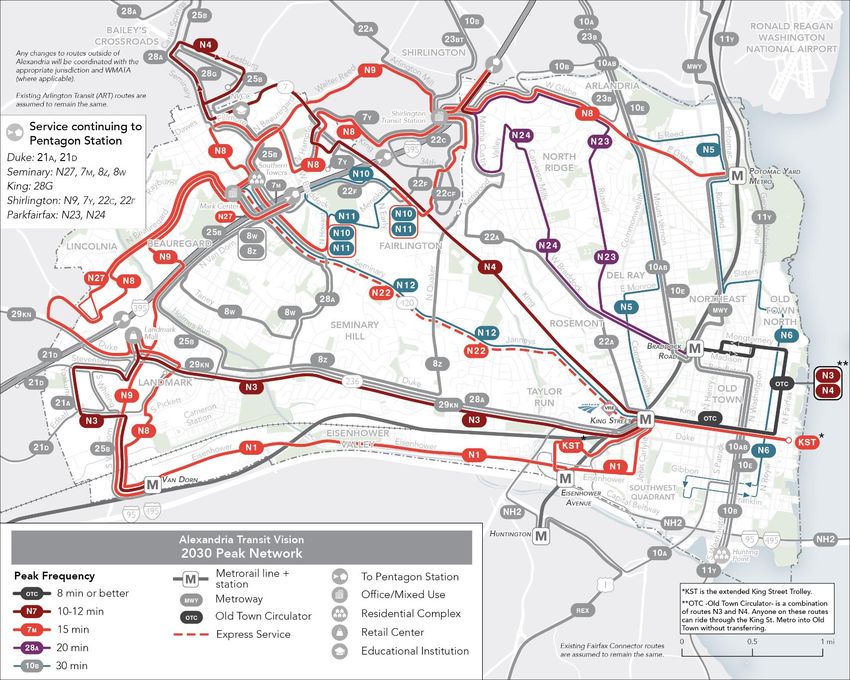
• Alexandria Transit Vision Plan:
o In FY 2022, DASH is planning to implement the new 2022 Alexandria Transit Vision (ATV)
Plan network, which is the first major step towards the final 2030 ATV Plan. As shown in
Section 5-3, the new 2022 network features a series of frequent, all-day routes running
along key corridors that will provide a significant increase in access to useful transit for
most Alexandria residents. The network was adopted by the ATC Board of Directors in
December 2019 and will be included in the FY 2022 Transit Development Plan (TDP) and
will be taken under consideration by City Council as part of the FY 2022 city budget
approval process.
o Between FY 2022 and FY 2030, DASH is planning to implement the 2030 ATV Plan
Network. As shown in Section 5-3, these recommendations include route realignments
in West Alexandria and major frequency and span improvements. Two corridors –
Eisenhower Avenue and Duke Street – have been identified as the top priorities among
the 2030 changes in the hopes that they can be implemented by FY 2024 – FY 2025.
• No additional fare changes for FY 2022 or beyond are being proposed at this time.
1.4 / ATC Capital Program Summary
• As of the start of FY 2021, the current DASH bus fleet includes 99 active buses, and five
emergency contingency spares:
o In FY 2020, DASH purchased and took delivery of 8 new New Flyer clean diesel buses to
improve the agency’s spare ratio and increase service reliability. The buses were
delivered in December 2019 and began operating in revenue service in February 2020.
o In FY 2021, DASH will be taking delivery of its first six battery electric buses through the
VW Mitigation Trust program. These buses will replace the six remaining Orion diesel
3 | FY2021 – FY2026 ATC Transit Development Plan (Final)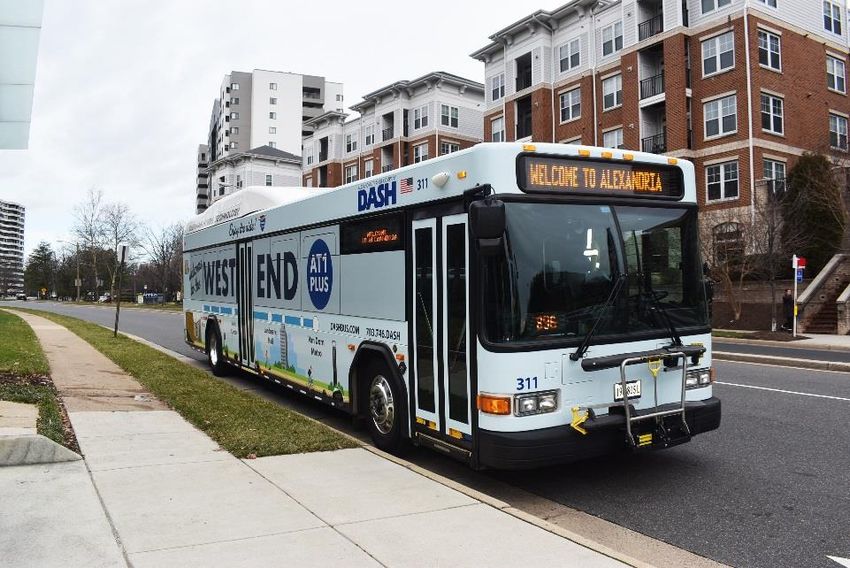
buses. The installation of the charging equipment and the corresponding facility
               upgrades will be completed by Summer 2020 and are funded by NVTA.

           o   In order to operate the AT-1 Plus and AT-9 service enhancements, DASH made the
               decision to keep six of the articulated buses that DASH used to operate the Blue Line
               Shuttle during the Summer 2019 WMATA Platform Improvement Project.

           o   DASH has also kept five additional coaches – including two Gillig Phantoms and three
               MCI’s – that were purchased as part of the Platform Improvement Project. These buses
               are intended to help supplement the DASH charter fleet, but may also be used as
               emergency contingency buses, if needed.

   •   Fleet Replacement. The City of Alexandria’s FY 2021 – FY 2030 Capital Improvement Plan (CIP)
       includes substantial funding for DASH replacement buses that will allow DASH to maintain its
       State of Good Repair (SGR), however, due to a gap in bus purchases between 2007 and 2011,
       DASH is not slated to receive any CIP funding for replacement buses in FY 2021 or FY 2022. The
       total approved FY 2021 – FY 2030 CIP funding for replacement bus purchases – including a
       gradual transition to zero-emission fleet – is $80.2 million.

   •   Zero-Emission Fleet Planning. DASH recently worked with the Center for Transportation & the
       Environment (CTE) to complete a Zero-Emission Fleet Feasibility Study. In 2020, DASH will be
       conducting a Zero-Emission Fleet Implementation Plan to determine the path forward towards a
       zero-emission bus fleet.

   •   DASH Facility & Fleet Expansion Project. DASH is entering the solicitation phase for a major
       facility expansion project that will be funded by the state’s Smart Scale program. The project
       will allow DASH to expand its facility onto the existing city impound lot that is located
       immediately west of the existing DASH garage. The expansion will include capacity for up to 45
       additional buses and electric charging equipment and infrastructure in support of a future zero-
       emission bus fleet. It also includes six expansion buses by FY 2023.

   •   Other Capital Improvement Projects. Additional FY 2021 – FY 2030 CIP funds are allocated for
       hybrid powertrain replacement, electronic fare payment, farebox upgrades, and other DASH
       technology needs.

   •   Additional COVID-Related Costs. Additional capital and operating costs will be necessary in FY
       2021 to purchase supplemental cleaning and safety equipment, and to implement additional
       COVID-related safety and cleaning protocols. Many of these costs will be eligible for federal
       reimbursement under the CARES Act.

4 | FY2021 – FY2026 ATC Transit Development Plan (Final)
2.0 / TDP Background

The Transit Development Plan is prepared each year to document and present the General Manager’s
recommendations relating to service, fares and the capital budget for the upcoming fiscal year. The plan
also serves as a planning and budgetary road map for the following five years. To this end, the TDP
provides an evaluation of the existing DASH bus service and a corresponding outline for future service
development and capital investment. The plan aligns with the budgetary assumptions for the upcoming
fiscal year (FY 2021) and will be used as a starting point for budget discussions in future fiscal years (FY
2022 – FY 2026).

2.1 / Purpose & Format

The Transit Development Plan (TDP) is designed to provide a comprehensive vision of future service
development, fare adjustments, and capital investments based on recommendations from the General
Manager, ATC Board of Directors and DASH staff. More specifically, it evaluates current DASH system
performance, outlines projected service levels for the fiscally-constrained FY 2021 operating budget, and
provides fiscally-unconstrained guidance on future service changes and capital improvements for the
remaining five years of the six-year plan cycle (FY 2022 – FY 2026). The TDP is updated each year by
DASH staff and is subject to annual review, amendment, and adoption by the ATC Board of Directors.
The document also serves as a resource for the city staff as they consider future ATC requests for
financial assistance

2.2 / Process & Timeline

The TDP approval process is designed to run in parallel with the City of Alexandria’s annual budget
timeline. As shown in Table 2-1, the basic TDP assumptions are developed by DASH management in the
late fall and early winter. A preliminary draft of the TDP is typically submitted to the Board of Directors
and released for public review in March. This release marks the beginning of a month-long public
comment period that culminates with a formal public hearing at the April meeting of the ATC Board.
The public comment period includes multiple community meetings, online engagement and the
opportunity for comments to be submitted via phone, email, or in person at the Board of Directors
meeting in April. DASH staff reviews all feedback and modifies the document as needed to incorporate
feedback and align with the final city budget. The final ATC Transit Development Plan is then reviewed
and adopted by the ATC Board of Directors in May so that the plan may be implemented for the
subsequent fiscal year on July 1st.

5 | FY2021 – FY2026 ATC Transit Development Plan (Final)

Table 2 – 1 / Annual ATC Transit Development Plan (TDP) Timeline

             Month                        ATC/DASH Activity                        City Activity
               July                               No Actions                          No Actions
              August                              No Actions                          No Actions
                                          DASH Finance Department
            September                   Develops and Distributes Budget               No Actions
                                            Process to internal staff
                                                                            City Manager releases Priorities
                                         Draft ATC Budget Presented to      and Instructions Memorandum,
              October
                                                     Board                 Current Services Budget Submitted
                                                                                      to City OMB
                                       Board Acts to Approve or Amend
                                                                             Supplementals and Reductions
            November                       Draft Budget, including
                                                                                Submitted to City OMB
                                        Supplementals and Reductions
             December                             No Actions                          No Actions
                                                                            City Manager Finalizes Proposed
              January                             No Actions
                                                                                    Budget and CIP
                                                                            City Manager Releases Proposed
             February                             No Actions
                                                                             Budget and CIP to City Council
                                       Draft TDP and Budget Presented to
              March                    Board and released for month-long         City Budget Hearings
                                             public comment period
                                        Board holds Public Hearings for
               April                                                         City Budget Hearings ongoing
                                              Draft TDP and Budget
               May                       Board Adopts TDP and Budget       City Council Adopts Budget and CIP
               June                                 No Actions                          No Actions

2.3 / Alexandria Transit Vision Plan

6 | FY2021 – FY2026 ATC Transit Development Plan (Final)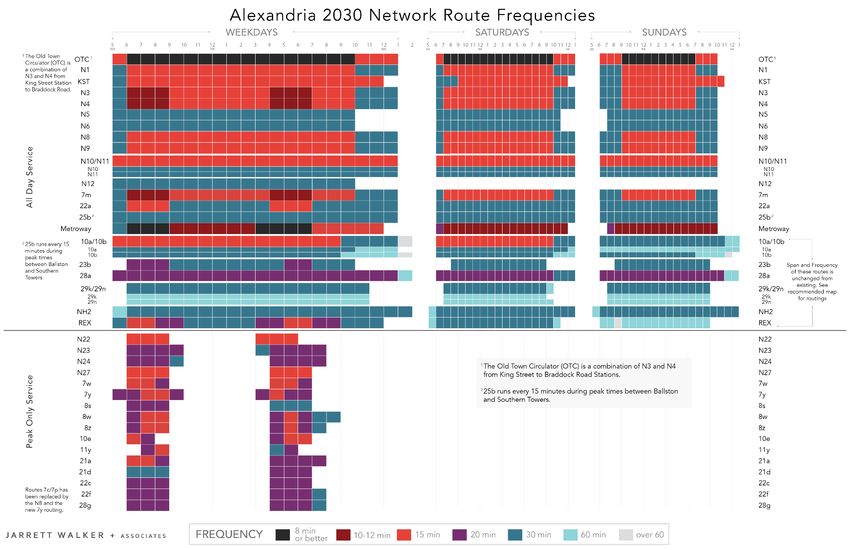
The Alexandria Transit Vision (ATV) Plan is an ambitious bus
network redesign study by DASH and the City of Alexandria
that takes a community-driven approach to re-designing the
city’s transit network from scratch. The ultimate goal of the
ATV – as determined through community outreach – is to
create a more useful bus network that encourages more people to go more places at more times using
transit. Similar transit network redesigns have been successfully implemented in Houston, Seattle, San
Jose and Richmond.

                                After three rounds of public engagement and nearly two years of
                                discussion, the final 2022 and 2030 Alexandria Transit Vision Plan
                                networks were adopted by the DASH Board of Directors in December
                                2019. The networks were designed based on the policy guidance that
                                DASH should dedicate 85 percent of its annual revenue hours to
                                ridership maximization, and 15 percent to coverage-oriented service.
                                The resulting 2030 ATV recommendations would create a network of
                                frequent, all-day bus routes across the City of Alexandria that will
                                provide significant improvements in mobility options for most
                                Alexandria residents and encourage additional transit usage, which
                                benefits the City as a whole. Additional information, maps and tables
                                for the 2022 and 2030 ATV networks are provided in Section 5-3 of this
                                plan and on the ATV website (www.dashbus.com/transitvision).

The 2022 ATV Network is planned for implementation in July 2021 and will therefore be included in the
DASH subsidy request in the City of Alexandria’s FY 2022 budget cycle. Through this process, city staff
and City Council will have the ultimate discretion on the amount of funding that will be made available
for the implementation of the 2022 ATV Network. Consequently, the service, fare, and capital
improvement recommendations for FY 2021 include very few changes, but the FY 2022 – FY 2027
recommendations are guided almost exclusively by the final network recommendations in the
Alexandria Transit Vision (ATV) Plan. The one service change that is proposed for FY 2021 – the
elimination of AT-4 service between the Braddock Road Metro and City Hall – is consistent with the
future ATV Plan network.

One of the major discussion items during the DASH Board of Directors’ consideration of the Final ATV
Network was the decision to continue local AT-2 bus service along Seminary Road and Janneys Lane
between Howard Street and King Street. While the Board ultimate decided that the local bus service
should be continued, it recommended that the ridership along that segment should be monitored on an
annual basis to ensure that the ridership was sufficient to warrant the continuation of the service. As a
result, the ridership on this segment will be provided in Section 4 of each annual TDP until FY 2025 to
determine if the benchmark of a 20% increase in average weekday boardings is being met.

Lastly, one of the biggest themes of the ATV Plan was the idea of increasing freedom of mobility, which
in turn, increases access to opportunities ranging from jobs to education, from health care to childcare,
and from social activities to civic involvement. To this end, future DASH Transit Development Plans will
include performance measures that calculate the number of city residents who have access to useful,
frequent, all-day transit, and the number of people and jobs that are within a 30-minute transit trip of
key destinations around the city.

7 | FY2021 – FY2026 ATC Transit Development Plan (Final)
3.0 / System Summary DASH operates traditional fixed-route bus service on eleven regular bus routes, and the King Street Trolley. The primary DASH service area covers approximately 15 square miles and generally aligns with the jurisdictional boundaries of the City of Alexandria. A map of the DASH bus system is included as Figure 3-1. An inset map depicting bus service in Old Town Alexandria is shown as Figure 3-2. 3.1 / Service Area The majority of DASH service operates within the City of Alexandria, however, two routes – the AT-3 and AT-4 – also provide service along Interstate 395 between Alexandria and the Pentagon during weekday peak hours. As shown in Figures 3-1 and 3-2, the DASH bus system design follows a modified hub-and- spoke network design model with Old Town as the “hub”, and the major east-west arterials (King Street, Seminary Road, Duke Street, and Eisenhower Avenue) serving as the “spokes”. Several “crosstown routes” also provide connections between outlying areas and major trip generators on the West End and northern Alexandria. All but one of the twelve DASH routes connect to at least one of the four Metrorail Stations within the City of Alexandria. Based on a geospatial analysis of the DASH network, approximately 146,000 Alexandria residents (96% of all residents) are within short walking distance (¼ mile) of a DASH or WMATA bus stop. Roughly 82,000 jobs (91% of all jobs) in or around Alexandria are within short walking distance of a DASH or WMATA bus stop. 3.2 / Routes The DASH bus system consists of 11 regular bus routes and the King Street Trolley. The basic characteristics of each route are summarized in Table 3-1. All twelve bus routes operate on weekdays, however, only eight routes run on Saturdays and Sundays. On most routes, weekday service runs from roughly 6:00 AM to 10:00 PM, Saturday service from 7:00 AM to 10:00 PM, and Sunday service from 8:00 AM to 8:00 PM. Weekday peak service for most routes runs every 15-30 minutes. Weekday off- peak service typically runs every 30-60 minutes during mid-days and evenings. Of the eight Saturday routes, five run every 30 minutes or less, while on Sundays, six of the eight routes only run once every hour. DASH also operates the iconic King Street Trolley, a free tourist-oriented service running between the King Street Metro and the Old Town Waterfront. The trolleys run every 10-15 minutes, 365 days per year. Daily service starts at 10:30 AM and typically ends at 10:30 PM, with extended late-night service on Thursdays, Fridays, and Saturdays. Additional information on the destinations, service levels and operating characteristics for specific DASH routes is provided in Table 3-1. 8 | FY2021 – FY2026 ATC Transit Development Plan (Final)
Figure 3 – 1 / DASH System Map

9 | FY2021 – FY2026 ATC Transit Development Plan (Final)
Figure 3 -2 / Old Town Alexandria Inset Map

10 | FY2021 – FY2026 ATC Transit Development Plan (Final)
Table 3-1 / DASH Service Characteristics by Route
Span/Frequency Peak Vehicle Req's Avg. Daily Boardings Daily Rev. Hours
Route Route Description Weekday Saturday Sunday (Approx) (November 2019) (November 2019)
Span Peak Off-Peak Night Span Freq. Span Freq. Wky Sat Sun Wky Sat Sun Wky Sat Sun
Seminary Plaza to Van Dorn Metro via 6am - 7am - 8am -
AT1 Beauregard & Duke 11pm
10 20 60
11pm
30
11pm
30 14 5 4 2,049 1,056 786 148.8 75.8 63.9
6am -
Lincolnia to Braddock Road Metro via Seminary,
AT2 King Street Metro & Old Town
10pm (6 - 20/30
30 60
8am -
60 8am - 8pm 60 12 3 2.5 1,341 420 345 90.0 34.2 28.8
(2X) 9am & (10/20) 11pm
(2X - Mark Center Express)
3 - 6pm)
Hunting Point to Pentagon Metro via Old Town, 6 - 9am &
AT3 Braddock, Russell, Glebe and I-395 4 - 8pm
20 - - - - - - 5 - - 592 - - 37.8 - -
City Hall to Pentagon Metro via Old Town, 6 - 9am &
AT4 Braddock Road Metro, Cameron Mills, and I-395 4 - 7:30pm
20 - - - - - - 5 - - 501 - - 38.8 - -
10:30am -
City Hall to Parkfairfax Loop via Old Town, 3pm &
AT3/4 Braddock Road Metro, Braddock, Glebe & Russell 8:30 -
- 60 60 9am - 8pm 60 9am - 6pm 60 0 1 1 38 56 57 11.9 11.9 10.9
10:30pm
Van Dorn Metro to Braddock Road Metro via 6am - 7:30am -
AT5 Landmark Mall, Van Dorn, King & Old Town 10:30pm
20/30 30 60
10:30pm
30 8am - 8pm 60 7 6 2.5 1,354 797 349 90.8 93.3 36.3
6am -
AT6 King Street Metro to NVCC via King
10pm
15 30 30 - - - - 5 - - 692 - - 55.6 - -
Landmark Mall to Lee Center via Van Dorn Metro, 6am -
AT7 Eisenhower Metro, King Street Metro & Old Town 10pm
30 60 60 - - - - 5 - - 606 - - 58.3 - -
Braddock Road Metro to Van Dorn Metro via Old 5:30 am - 7am - 7am -
AT8 Town, King Street Metro, Duke & Landmark 12 am
10/20 30 60
11:30pm
30
11pm
20/40 10 4 3 2,371 1,116 873 119.7 76.8 65.9
Potomac Yard to Mark Center via Glebe, 7am - 7:30am - 7:30am -
AT9 Shirlington, King & NVCC 11pm
20 30 60
11pm
30
10:30pm
30 4 4 4 789 357 273 78.1 63.0 63.0
Potomac Yard to King Street Metro via Mt. Vernon, 7am - 7am -
AT10 Del Ray & Commonwealth 10pm
30 30 60
10pm
30 9am - 7pm 60 2 2 1 389 272 132 29.9 29.9 10.8
10:30am -
10:30pm 10am - 10am -
KST King Street Trolley
(12am Th,
10-15 10-15 10-15
12am
10-15
10:15pm
10-15 4/5 4/5 4/5 1,418 2,328 1,559 44.1 53.3 56.3
Fri & Sat)
11 | FY2021 – FY2026 ATC Transit Development Plan (Final)3.3 / Other Transit Providers
The DASH bus network in Alexandria provides a local complement to the regional transit network.
Regional operators that provide service to/from Alexandria include:
• Metrorail (WMATA). Metrorail operates heavy rail service to 91 stations throughout the
Washington, DC region, carrying over 620,000 passengers per weekday. The City of Alexandria
is served by the Blue and Yellow lines at four different Metrorail Stations – Braddock Road, King
Street, Eisenhower Avenue, and Van Dorn. DASH also provides service to the Pentagon Metro
Station during weekday peak periods. The new Potomac Yard Metrorail Station – an in-fill
station in northern Alexandria on Potomac Avenue – is slated to open in 2022.
• Metrobus (WMATA). In addition to Metrorail, WMATA also operates a regional bus network
that carries about 350,000 passengers per weekday. Metrobus runs 28 routes that provide
service within the City of Alexandria. This includes the “Metroway” rapid bus service between
Pentagon City and Braddock Road Metro, and the Richmond Highway Express (REX), which
provides frequent, limited-stop service from Mount Vernon to Old Town via Route 1.
• Amtrak/Virginia Railway Express. Intercity and commuter rail services such as Amtrak and VRE
stop at Alexandria Union Station, before crossing the Potomac River into Washington, DC.
• Private Shuttles. Several dozen private shuttles operate within the City of Alexandria to provide
connections to Metrorail Stations. Examples include the Carlyle/PTO Shuttle, and the Van Dorn
Exchange shuttle, which connects the Van Dorn Exchange apartment complex with the Van Dorn
Metro.
• Accessible Service. Accessible paratransit options are provided through the City of Alexandria’s
DOT program and the WMATA MetroAccess service.
3.4 / Passenger Facilities
DASH buses provide service to five Metrorail Stations, five non-Metrorail transit centers (Landmark Mall,
Mark Center, Southern Towers, NVCC-Alexandria and Potomac Yard), and over 700 local bus stops.
Roughly 22 percent of these stops are shared by Metrobus or another provider. City staff estimates that
roughly 90 DASH bus stops have shelters, while another 200 have amenities such as benches and/or
trash cans. Approximately 100 stops (14 percent) have route schedules mounted on the bus stop poles.
The distribution of stop amenities is based primarily upon daily ridership, with shelters, benches and
trash cans generally installed at any stop with over 40 daily boardings.
In 2018, DASH began installing real-time bus arrival information
kiosks and tablets at various high-ridership locations throughout the
city. Major kiosks have been installed at City Hall, Southern Towers,
NVCC-Alexandria and NSF with additional screens planned for the
King Street Metro and Mark Center Transit Center. An additional
kiosk is planned for the new King Street Metro bus loop, while real-
time tablet displays are currently being installed along the AT-1 Plus
and AT-9 routes with I-395 Commuter Choice funds. With this
increase, over 50 stop locations will have real-time signage.
12 | FY2021 – FY2026 ATC Transit Development Plan (Final)All DASH bus stops that have been installed or updated since 2006 are compliant with ADA design
standards for individuals using wheelchair or other mobility devices. DASH also coordinates closely with
city staff during the site plan review process to ensure any proposed developments include adequate
considerations for existing and future bus stops.
3.5 / Bus Fleet
For the start of FY 2021, the DASH will be comprised of a core bus fleet of 99 active buses for use in daily
revenue service. The current peak service requirement in 81 vehicles, which translates to a current
spare ratio of approximately 22 percent. As part of the Summer 2019 Metrorail Shutdown, DASH
purchased over 40 used buses from other transit agencies. Though most of these buses have since been
retired, five of the buses have been retained as a contingency fleet that can also be used for charter
service. The remaining 2002 Orions will be replaced by the six electric buses that are scheduled to arrive
by late 2020. A summary of the active and contingency bus fleets are shown in Table 3-2.
Table 3-2 / FY 2021 DASH Bus Fleet Summary
ACTIVE BUS FLEET
Vehicle ID's Year Make Type Length # of Vehicles
77, 78, 85, 86, 89, 90 2002 Orion Diesel 35' 6
200-206 2011 Gillig Hybrid 35’ 7
300-302 2011 Gillig Hybrid 40’ 3
400-404 2011 Gillig (Trolley) Hybrid 29’ 5
207-211 2012 Gillig Hybrid 35’ 5
303-307 2012 Gillig Hybrid 40’ 5
212-216 2014 Gillig Hybrid 35’ 5
308-309 2014 Gillig Hybrid 40’ 2
217-229 2015 Gillig Hybrid 35’ 13
405 2015 Gillig (Trolley) Hybrid 35' 1
230-233 2017 Gillig Hybrid 35’ 4
310-311 2017 Gillig Hybrid 40’ 2
501-514 2018 Gillig Clean Diesel 35’ 14
515-527 2019 New Flyer Clean Diesel 35' 13
528-530 2019 New Flyer Clean Diesel 35’ 3
601-603, 612-614 2002 Neoplan Diesel 60' 6
515-527 2019 New Flyer Clean Diesel 40' 5
TOTAL ACTIVE FLEET 99
CONTINGENCY BUS FLEET
Vehicle ID's Year Make Type Length # of Vehicles
101-102 2005 Gillig (PRTC) Diesel 40' 2
103-105 2002 MCI Diesel 35’ 3
TOTAL CONTINGENCY FLEET 5
TOTAL FLEET SIZE (ACTIVE + CONTINGENCY) 104
13 | FY2021 – FY2026 ATC Transit Development Plan (Final)In order to maintain State of Good Repair, DASH is required to replace each bus once it reaches the end of its 12-year useful life cycle. A more detailed discussion of bus fleet replacement, expansion plans and the “DASH Capital Budget Program” is included in Chapter 6. 3.6 / Fares The current DASH base fare is $2.00 for a single trip with a four-hour DASH-to-DASH transfer window. DASH allows free transfers from most other bus providers with SmarTrip, and provides a $0.50 discount for transfers to and from Metrorail. Disabled persons with valid Alexandria DOT or MetroAccess cards may board DASH buses for free. Two routes – the King Street Trolley and the Mark Center Express (AT- 2X) – do not require fares as the operating costs are covered by dedicated external subsidies. For frequent riders, DASH also offers the monthly DASH Pass, which costs $45.00 and entitles the cardholder to unlimited rides on DASH buses during the specified month. DASH continues to accept SmarTrip cards for rapid, automated fare payment. Roughly 80 percent of DASH boardings are made using SmarTrip cards. Riders who use a Senior SmarTrip card to ride DASH during off-peak hours receive a $1.00 discount to their fare. DASH is working closely with WMATA as they continue to upgrade their fare technologies in the hopes of further increasing passenger convenience and overall operational efficiency. In 2019, DASH launched the DASH Bus app, a mobile ticketing pilot program which allows customers to purchase their DASH fare products on smartphones using debit cards, credit cards and selected e-wallet platforms. During the pilot period, passengers have been required to show the validation screen on their phone to the operator, but the long-term goal is to implement electronic fare validation where small readers attached to the farebox can validate mobile fare payments. DASH has extended the pilot period to April 2021 to further evaluate the program and determine what the next steps will be. In FY 2018, DASH started a pilot program to allow T.C. Williams High School students to ride for free using their student identification cards. The program is designed to introduce students to DASH and improve their perceptions of public transit to promote future transit usage. Since its inception, the “Free Student Rides” program has been expanded to include four additional schools – Bishop Ireton High School, Episcopal High School, St. Stephens & St. Agnes School and Fusion Academy. DASH was also able to introduce Smartrip-enabled Student ID cards at each of the schools in 2018, and in 2019, two of the schools were migrate to the new DASH bus mobile payment app. Additional free fares on DASH buses are available to disabled passengers through the WMATA MetroAccess and City of Alexandria’s DOT Paratransit program. 3.7 / Funding DASH service is operated by the Alexandria Transit Company (ATC), which is an independent public service corporation that is owned by the City of Alexandria. The City provides extensive input and guidance via the Transportation Planning Division of the city’s Department of Transportation & Environmental Services. City staff play an integral role in supporting the DASH annual budget request and managing a wide variety of state and regional grant programs. The majority of annual DASH operating funds comes from an operating subsidy that is allocated each year from the City of Alexandria’s General Fund. The City also provides funding for operations through 14 | FY2021 – FY2026 ATC Transit Development Plan (Final)
the Transportation Improvement Program (TIP) and for capital investments through the biennial Capital
Improvement Program (CIP) process.

Additional external sources of DASH funding include the Virginia Department of Rail and Public Transit
(DRPT), the Northern Virginia Transportation Authority (NVTA), and the Northern Virginia Transportation
Commission (NVTC) I-395 Commuter Choice Program.

DASH also relies upon subsides to operate specific services such as the free King Street Trolley for the
City of Alexandria, and the Mark Center Express for the Department of Defense. Additional revenue is
also generated by bus charters for both public and private events.

Passenger fare revenues typically cover between 20 and 25 percent of the annual DASH operating costs
and are used to reduce the DASH operating subsidy from the city.

For FY 2021, DASH will be receiving over $6 million in federal recovery funding from the CARES Act.
These funds are designed to maintain public transit service and jobs through the COVID-19 pandemic
and will be used to offset anticipated revenue losses and subsidy decreases. This funding is being
provided from WMATA to the City of Alexandria as a subsidy credit for the first quarter of FY 2021.

15 | FY2021 – FY2026 ATC Transit Development Plan (Final)
4.0 / System Performance

The following section uses FY 2019 data to review DASH service performance at both the system and
route levels. The overall performance of a bus system is typically measured in terms of service provided
(revenue hours), service consumed (ridership), cost efficiency (boardings per revenue hour, operating
ratio), and service reliability (on-time performance, missed trips, road calls and customer feedback).
Additional metrics such as access and mobility that were highlighted during the ATV Plan are also
important in determining how well the transit network is meeting the needs of the community.

4.1 / Service Provided

In FY 2019, DASH operated approximately 215,000 hours of revenue bus service. This represents a 1.5
percent decrease as compared to FY 2018 service levels. A graph showing the historic trend in DASH
annual revenue hours for the last ten years is shown in Figure 4-1.

                                Figure 4-1 / DASH Annual Revenue Hours (FY 2009 - FY 2019)

                                           250,000

                                           200,000
                    Annual Revenue Hours

                                           150,000

                                           100,000

                                            50,000

                                                -
                                                     FY09 FY10 FY11 FY12 FY13 FY14 FY15 FY16 FY17 FY18 FY19

4.2 / System Ridership

As shown in Figure 4-2, annual ridership has fluctuated dramatically over the last decade. After a steep
decline between FY 2009 and FY 2011, ridership numbers increased dramatically in FY 2012 and FY 2013.
In the last three years, however, ridership has again shown a distinct downward trend. In FY 2019,
DASH recorded just under 3.8 million passenger boardings, which was down roughly 2.8 percent from FY
2017, and down 12 percent from FY 2015.

The ridership decrease in FY 2019 can be largely attributed to decreasing ridership on the free King
Street Trolley. Annual ridership for all regular DASH routes, excluding the Trolley, was virtually identical
to FY 2018 and down by only one percent from FY 2017. Ridership decreases resulting from the WMATA
Platform Improvement Project (PIP) =in May and June 2019 also negatively impacted the FY 2019 totals.

In terms of daily boardings in FY 2019, DASH drew an average of 12,800 boardings on weekdays, just
over 6,500 boardings on Saturdays, and approximately 4,500 boardings on Sundays. This translates to
an approximately 2.4 percent decrease in weekday boardings from FY 2018. Average Saturday and
Sunday boardings were also down by 7.1 percent and 5.2 percent, respectively.

16 | FY2021 – FY2026 ATC Transit Development Plan (Final)
Figure 4 -2 / DASH Annual Ridership (FY 2009 - FY 2019)
5,000,000
4,500,000
4,000,000
Annual Boardings
3,500,000
3,000,000
2,500,000
2,000,000
FY09 FY10 FY11 FY12 FY13 FY14 FY15 FY16 FY17 FY18 FY19
The recent DASH ridership decreases are part of a larger trend affecting agencies throughout the
Washington, DC region, and across the country. A combination of low fuel prices and the growth of
ridesharing services like Uber and Lyft have led to reduced transit ridership across the country. Within
the Washington, DC area, Metrorail ridership was flat for FY 2019, however, Metrobus service in
Northern Virginia saw a 4.7 percent decrease in average weekday boardings. Similar decreases were
reported by ART (-5.3%) and PRTC/Omniride (-2.1%). Other agencies such as Fairfax Connector, Fairfax
CUE, and Loudoun County Transit reported flat ridership for FY 2019 as compared to FY 2018.
Figure 4 -3 / Average Weekday Boardings for Northern Virginia Transit Agencies (FY 2019 vs. FY 2018)
17 | FY2021 – FY2026 ATC Transit Development Plan (Final)Ridership Promotion Programs. In an effort to attract additional ridership, DASH has initiated programs like the “Free Student Rides” program for high school students, the introduction of free rides for MetroAccess and DOT paratransit program participants, and reduced fares for senior riders who use their Senior SmarTrip cards during off-peak periods. The DASH “Free Student Rides” program has been particularly successful in its first two full years in encourage transit awareness and usage among Alexandria high school students. In FY 2018, the first year the program was offered, DASH recorded approximately 1,000 student boardings on a typical weekday. In FY 2019, the program ridership grew to 1,200 average weekday boardings, due in part to the expansion of the program to Bishop Ireton, St. Stephens & St. Agnes, and Episcopal high schools. In FY 2018, DASH also launched a program to allow free rides for DOT and MetroAccess paratransit cardholders. Although the program includes both DOT and MetroAccess participants, the vast majority of program participants – more than 99 percent – are DOT paratransit users. In FY 2019, DASH recorded approximately 2,900 DOT/MetroAccess boardings per month, which was up by 42 percent from FY 2018. Lastly, at the start of FY 2019, DASH introduced a discounted fare of $1.00 for Senior/Disabled SmarTrip cardholders during off-peak periods. During the program’s first 12 months, Senior/Disabled SmarTrip ridership increased by 6 percent as compared to the previous year, including a 9 percent increase in off- peak boardings. The biggest increase (19 percent) occurred during weekday evenings after 6pm. 4.3 / Ridership by Route At the route level, Figure 4-4 shows that while many DASH routes have declined in weekday ridership over the last three years, several have modest gains in FY 2019. The AT-5, AT-6 and AT-7 each increased by 2 - 5 percent as compared to FY 2018. Weekday ridership on the AT-9 showed the biggest increase (13 percent), which does not the more recent ridership increases on that route resulting from the I-395 Commuter Choice improvements. The largest weekday declines in FY 2019 were on the AT-2X (-19%), AT-10 (-15%), and the King Street Trolley (-12%). As noted previously, the decreasing Trolley ridership was the largest factor in the overall FY 2019 ridership decline and is attributed in part to decreasing tourism activity in Old Town. Weekend ridership has decreased on most DASH routes since FY 2017. As shown on Figure 4-5, average Saturday boardings on the AT-1 and AT-9 have increased by 2 and and 10 percent, respectively since FY 2018. The AT-5, AT-8 and AT-10 have experienced decreases of 3 - 9 percent in FY 2019. King Street Trolley ridership on Saturdays was down by 12 percent from the previous year. 18 | FY2021 – FY2026 ATC Transit Development Plan (Final)
Figure 4-4 / Average WEEKDAY Ridership by Route (FY17-FY19)

                                   3,000
                                                                                                                                       2,589
    Average Weekday Boardings

                                   2,500
                                                                                                                                                                   1,894
                                   2,000
                                                 1,534
                                                         1,408                                               1,381
                                   1,500

                                   1,000                                    670                                       762
                                                                                         531                                     615                545
                                                                                                                                                            394
                                    500
                                                                     118                         58
                                      0
                                             AT1         AT2     AT2X      AT3      AT4        AT3-4     AT5         AT6     AT7       AT8      AT9       AT10 Trolley

                                                                           FY 2017              FY 2018              FY 2019

                                                    Figure 4-5 / Average SATURDAY Ridership by Route (FY17-FY19)

                                   3,000                                                                                               2589
       Average Weekday Boardings

                                   2,500
                                                                                                                                                                   1,894
                                   2,000
                                                 1534     1408                                               1381
                                   1,500
                                   1,000                                    670                                       762
                                                                                         531                                     615                545
                                                                                                                                                            394
                                     500                             118                          58
                                       0
                                             AT1         AT2     AT2X      AT3      AT4        AT3-4     AT5         AT6     AT7       AT8     AT9        AT10 Trolley

                                                                           FY 2017              FY 2018              FY 2019

                                                     Figure 4-6 / Average SUNDAY Ridership by Route (FY17-FY19)

  3000
  2500                                                                                                                                                            2,249
  2000
  1500
  1000                                                                                                                       813
                                             470                 427                                     359
   500                                                                                                                                          126
                                                                                     48
          0
                                           AT1                 AT2               AT3-4                 AT5                 AT8               AT10            Trolley

                                                                                  FY 2017       FY 2018         FY 2019

19 | FY2021 – FY2026 ATC Transit Development Plan (Final)
On Sundays, overall ridership on regular DASH routes is down by roughly five percent due to decreasing
ridership on the King Street Trolley. As shown on Figure 4-6, Sunday ridership on all regular DASH routes
has gone up from FY 2018 to FY 2019. The AT-1 and AT-2 have demonstrated the largest growth with
increase of 15 percent and 8 percent, respectively. Average Sunday boardings on the King Street Trolley
ridership were down by almost 15 percent in FY 2019.
Several external factors may have influenced the ridership numbers provided above. First, WMATA’s
Platform Improvement Project (PIP) led to a sharp ridership decrease in May and June 2019. Second, an
extended shutdown of the Federal Government that began in mid-December 2018 and lasted to late
January 2019 also led to significantly lower ridership during that period.
Seminary Road & Janneys Lane Ridership
One of the key decisions made by the ATC Board of Directors as part of their decision to adopt the
Alexandria Transit Vision Plan was to maintain local bus service on Seminary Road and Janneys Lane
between Howard Street and King Street. As a condition to this decision, the Board recommended that
the average weekday ridership on this corridor should be monitored on an annual basis over the
subsequent five years to ensure that the service was being sufficiently utilized to warrant its continued
operation. To this end, the Board identified a target increase of 20 percent for average weekday
boardings along this segment. The AT-2 recorded approximately 100 weekday boardings in FY 2019, so
the ridership target of 120 average weekday boardings along the segment will be monitored in each of
the next four Transit Development Plan documents.
4.4 / Cost Efficiency
Total ridership data alone only tells part of the story. In order to determine the cost efficiency of the
system, ridership numbers must be compared to revenue hours to determine how efficiently the system
and its routes are operating. This metric is typically expressed in boardings per revenue hour. In FY
2019, the DASH bus system drew 22.3 boardings per revenue hour. This was a slight decrease from the
23.4 boardings per revenue hours that were recorded in FY 2018.
Figure 4-7 / Average Boardings per Revenue Hour by Route and Day (FY 2019)
60.0
50.0
40.0
30.0
20.0
10.0
0.0
AT1 AT2 AT2X AT3 AT4 AT3-4 AT5 AT6 AT7 AT8 AT9 AT10 Trolley
Weekday Saturday Sunday
20 | FY2021 – FY2026 ATC Transit Development Plan (Final)Route-by-route boardings per revenue hour for weekdays, Saturdays and Sundays in FY 2019 are shown
in Figure 4-7. Routes with the highest weekday productivity include the King Street Trolley and the AT-8.
The least productive weekday routes are the AT2X and the AT3-4, which both draw eight boardings per
hour or fewer. On weekends, the AT-1, AT-8 and King Street Trolley maintain an average productivity at
or above 15 boardings per revenue hour. The AT-3/4 is the least productive route on weekends with
less than five boardings per revenue hour.
4.5 / Operating Ratio
One other common measure of cost efficiency in transit planning is the Operating Ratio, which measures
the percent of total operating costs that are covered by revenues, including passenger fares.
Presumably, an efficient, well-designed transit system will generate higher ridership and greater fare
revenues per unit cost of operating expense than a less efficient system. Based on FY 2014 and FY 2016
NTD data, the normal range for operating ratios is 15 to 25 percent. For FY 2019, DASH recorded an
operating ratio of 36.8 percent, which represented an increase from 32.2 percent in FY 2018. The
annual DASH operating ratios for the last five years are shown in Figure 4-8.
Figure 4-8 / Annual DASH Operating Ratio (FY15 - FY19)
4.6 / Service Reliability
DASH is working to identify and address service reliability deficiencies that may have a negative impact
on ridership and customer satisfaction. Service reliability can be measured by on-time performance,
missed trip percentage, average miles per road call and customer feedback. It is important to note that
service reliability is invariably tied to service frequency since the consequences of a missed trip are far
less significant if the next bus is only 10 or 15 minutes away instead of 60 minutes away.
The most common indicator for service reliability is on-time performance (OTP), which measures the
percentage of trips that are arriving at each timepoint within five minutes of their scheduled arrival
time. In FY 2019, approximately 85.2 percent of all DASH trips arrived on time. This a 3 percent increase
from FY 2018, and it is roughly equal to the industry OTP standard of 85 percent.
21 | FY2021 – FY2026 ATC Transit Development Plan (Final)A chart showing FY 2019 weekday on-time performance by route is included as Figure 4-9. The most
reliable routes in the system are the AT-1 (88%), AT-6 (87%), AT-10 (87%) and the King Street Trolley
(91%). The least reliable routes are the AT-3 (79%), AT-4 (81%), AT-7 (81%) and AT-8 (80%).
The most challenging time of day for on-time performance is the weekday afternoon peak period.
Overall on-time performance during the PM peak is roughly 78 percent, compared to 85 percent for the
rest of the day. Although all routes are less reliable during the afternoon peak hour, the AT-3, AT-5, AT-
7, and AT-8 are all below 75 percent due to volatile traffic conditions on Interstate 395, the Telegraph/I-
495 interchange, and Old Town South.
Service reliability is also often impacted by the performance of the DASH maintenance department,
which is responsible for ensuring that buses are maintained in good operating shape to minimize the
chances for breakdowns and missed trips. In FY 2019, DASH averaged over 15,100 miles per road call,
which was an improvement from 14,700 miles per road call in FY 2018 and well above the industry
average (11,500 miles per road call). The FY 2019 total missed trip percentage was 0.047 percent,
which was a significant increase from the 0.028 percent of trips that were missed in FY 2018.
Figure 4-9 / Weekday On-Time Performance by Route and Time Period (FY 2019)
95.0%
90.0%
On-Time Performance
OTP Industry Standard (85%)
85.0%
80.0%
75.0%
70.0%
65.0%
60.0%
55.0%
50.0%
AM Peak Midday PM Peak
Another, more indirect measure of service reliability is customer feedback. The DASH Customer Service
Department is responsible for documenting and categorizing all calls and e-mails that are received from
passengers. In FY 2019, DASH received 26 valid complaints relating to schedule adherence. This
represented a significant decrease from the 40 similar complaints that were registered in FY 2018. In
total, 172 valid customer complaints were received in FY 2019 as compared to 224 valid complaints in FY
2018.
22 | FY2021 – FY2026 ATC Transit Development Plan (Final)4.7 / Access & Mobility
As discussed extensively in the Alexandria Transit Vision Plan, two of the most important performance
measures for a bus system are transit access and mobility. These metrics can measure how well a
transit system serves the community, and the extent to which transit provides access to opportunities
(e.g. jobs, housing, schools, shopping centers, day cares, civic centers, etc).
In order for transit to be effective, it must be accessible to large numbers of residents, jobs and activity
centers. It must also be useful and convenient. Figure 4-10 provides a summary of access to the current
DASH bus network for all residents, non-white residents, residents in poverty, and jobs in Alexandria.
Access is measured by the percentage of each group that are within a quarter-mile walking distance of
transit service at 12pm on a weekday, or the baseline off-peak service.
As shown below, the current DASH bus network does an exceptional job of providing access to basic
transit for each of the groups identified below, however, the access to frequent all-day transit among
these groups is relatively low. This is a common theme that was identified during the Alexandria Transit
Vision Plan process. With the new ATV Network Plan, the percentages of each group with access to
frequent, all-day transit will increase dramatically.
Figure 4-10 – Access to Transit & High-Frequent Transit
The second metric, mobility, can be derived from the isochrone maps that are included as Figures 4-11,
4-12 and 4-13. Each map assumes that a transit user – represented as a stick figure – is at a selected
location at a certain day and time. The colored isochrone shapes represent the area that can be reached
from that specified location on the specified day and time using transit or walking based on an average
trip times of five minutes (white), 10 minutes (blue), 20 minutes (teal), and 30 minutes (red). The trip
time calculation accounts for both travel time, and average waiting time based on route frequencies.
The larger the isochrone shape, the more access to locations with different types of “opportunities”
described above.
23 | FY2021 – FY2026 ATC Transit Development Plan (Final)You can also read