Amazon and Orinoco River Plumes and NBC Rings: Bystanders or Participants in Hurricane Events?
←
→
Page content transcription
If your browser does not render page correctly, please read the page content below
316                                             JOURNAL OF CLIMATE                                                          VOLUME 20

   Amazon and Orinoco River Plumes and NBC Rings: Bystanders or Participants in
                               Hurricane Events?
                                                          AMY FFIELD
                                     Earth and Space Research, Upper Grandview, New York

                                  (Manuscript received 25 July 2005, in final form 5 May 2006)

                                                            ABTRACT

               The Amazon and Orinoco River plumes and North Brazil Current (NBC) rings are investigated during
            the 1 June through 30 November Atlantic hurricane season to identify their impact on upper-ocean tem-
            peratures in the region and to draw attention to their potential role in hurricane maintenance and inten-
            sification. The analysis uses ocean temperature and salinity stratification data, infrared and microwave
            satellite-derived sea surface temperature (SST) data, and Atlantic tropical storm and hurricane tracks data.
            The Amazon–Orinoco River plume spreads into the western equatorial Atlantic Ocean forming an exten-
            sive (0°–20°N, 78°–33°W) 10–60-m-thick buoyant surface layer associated with the warmest surface tem-
            peratures (up to ⫹3°C) in the region due to the freshwater barrier layer effect. At times the warm
            Amazon–Orinoco River plume is bisected by cool-surface NBC rings. For the 1960 to 2000 time period,
            68% of all category 5 hurricanes passed directly over the historical region of the plume, revealing that most
            of the most destructive hurricanes may be influenced by ocean–atmosphere interaction with the warm
            plume just prior to reaching the Caribbean. Statistical analyses of tropical Atlantic SSTs and tropical
            cyclone wind speeds reveal a significant and unique relationship between warm (cool) SSTs in the Amazon–
            Orinoco River plume and stronger (weaker) tropical cyclone wind speeds between 35° and 55°W. This
            implies that warmer (cooler) plume SSTs due to increased (decreased) river discharge may directly con-
            tribute to a more (less) vigorous hurricane season.

1. Introduction                                                     per-ocean heat content on tropical cyclones continues
                                                                    to be studied from many perspectives (Free et al. 2004;
  Energy supplied by underlying warm ocean water is
                                                                    Goni et al. 2004; Perrie et al. 2004; Shay et al. 2004; Lin
fundamental to the development of deep atmospheric
                                                                    et al. 2003). Underscoring the potential importance of
convection of tropical cyclones and at times is possibly
                                                                    the processes controlling ocean surface temperatures
a pivotal factor in the maintenance and intensification
                                                                    during a tropical cyclone event, a statistical study of 23
of hurricanes [tropical cyclones that attain wind speeds
                                                                    Atlantic hurricanes correlated the change of the SST
greater than 33 m s⫺1 (64 kt or 74 mph)]. Yet, there are
                                                                    from before an event to during an event, to the change
many oceanic and atmospheric processes controlling
                                                                    in hurricane intensity (Cione and Uhlhorn 2003).
ocean surface temperatures, before and during a tropi-
                                                                       In this paper, two distinct ocean processes are pre-
cal cyclone event, that if better understood might help
                                                                    sented from the perspective of how they define the
advance our ability to forecast the evolution of tropical
                                                                    early southernmost oceanic conditions experienced by
cyclones, or more specifically, the likelihood of hurri-
                                                                    more than half of all Atlantic hurricanes just prior to
cane intensification. For example, in the Atlantic
                                                                    reaching the Caribbean Sea: 1) the spreading of fresh-
Ocean upper-ocean warm core rings are thought to
                                                                    water discharges from the Orinoco and Amazon Rivers
have played a role in hurricane intensification (Goni
                                                                    out into the western equatorial Atlantic Ocean, and 2)
and Trinanes 2003; Bosart et al. 2000; Shay et al. 2000).
                                                                    the periodic movement of North Brazil Current (NBC)
The impact of sea surface temperature (SST) and up-
                                                                    rings through the river plumes. At the sea surface the
                                                                    freshwater discharges from the Amazon and Orinoco
                                                                    Rivers spread outward, forming extensive low-salinity
  Corresponding author address: Dr. Amy Ffield, Earth and
Space Research, 290 Clausland Mountain Road, Upper Grand-           plumes. The ⬃0.2 ⫻ 106 m3 s⫺1 discharge from the
view, NY 10960-4113.                                                Amazon River is the world’s largest and the ⬃0.03 ⫻
E-mail: ffield@esr.org                                              106 m3 s⫺1 discharge from the Orinoco River is the

DOI: 10.1175/JCLI3985.1

© 2007 American Meteorological Society

 JCLI3985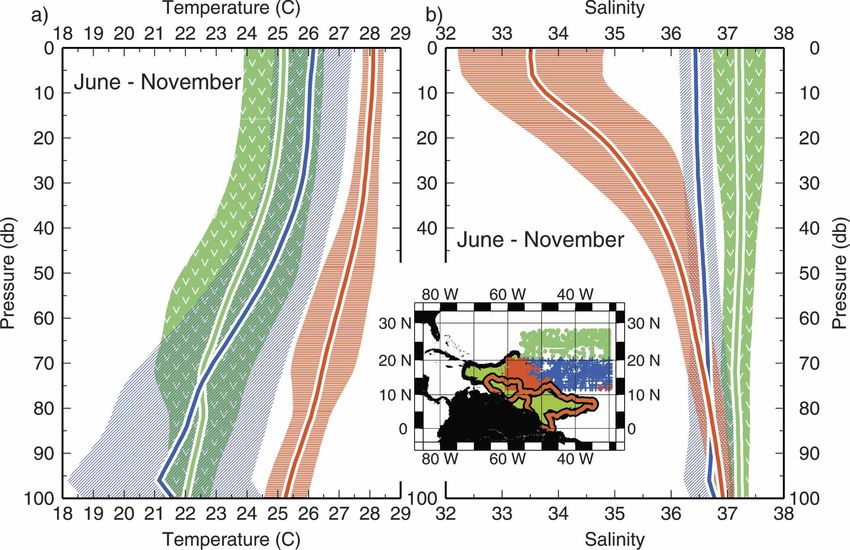
15 JANUARY 2007                                      FFIELD                                                       317

world’s third largest (Dagg et al. 2004; Perry et al.       ity to penetrate clouds, whereas the more traditional
1996). Pailler et al. (1999) map the freshwater barrier     infrared-based satellite SST measurements are blocked
layer of the Amazon and Orinoco River plumes that           by cloud cover. In general the 0.25° ⫻ 0.25° gridded
can trap heat in the surface layer (0–30 m) of the ocean,   TRMM daily dataset has at least one measurement
resulting in warm SST anomalies, especially in August       listed every 3 days at each grid point, and often there
through October, and they discuss associated ocean–         are two measurements listed per day at each grid point,
atmosphere exchange climate implications. In the same       although the true resolution is actually less than this.
region, Ffield (2005) describes the SST signatures of       Satellite sampling limitations of the TRMM data are
anticyclonic NBC rings as they pass northwestward           primarily associated with the aliasing of the diurnal so-
through the Amazon–Orinoco River plume with rela-           lar heating cycle. While there is typically an SST mea-
tively cool SSTs during July through December in com-       surement listed at least once every 3 days in the TRMM
parison to the warm SSTs associated with the plume.         dataset at each grid point, it actually takes about 46.7
   The Amazon–Orinoco River plume and NBC rings             days to repeat an SST measurement at approximately
are assessed in this paper specifically during the 1 June   the same time of day due to the orbit of the satellite.
through 30 November Atlantic hurricane season, to           Therefore, the diurnal SST cycle is manifested within
identify their impact on the upper-ocean temperatures       the SST time series as a 46.7-day signal. In this region
in the region, as well as to determine their proximity to   the highest aliasing (and therefore the largest diurnal
passing hurricanes. The goal of this study is to provide    cycles) is contained along the coast (Ffield 2005).
the foundation for future oceanic boundary layer hur-          Infrared satellite–derived SST measurements are
ricane modeling studies, as well as for more systematic     from the 7-day averaged Reynolds optimal interpola-
observational studies. Ultimately, the goal is to deter-
                                                            tion SST dataset beginning in November 1981 and
mine if the Amazon–Orinoco River plume and NBC
                                                            provided by the National Oceanic and Atmospheric
rings are active participants, rather than passive by-
                                                            Administration–Cooperative Institute for Research in
standers, to the evolution of hurricanes, either by con-
                                                            Environmental Sciences (NOAA–CIRES) Climate Di-
tributing to their maintenance or by impacting changes
                                                            agnostics Center (Boulder, Colorado; www.cdc.noaa.
in their intensity.
                                                            gov).
                                                               In general, in situ “SSTs” may be cooler than the
                                                            satellite-derived SSTs, as a result of the in situ data
2. Data
                                                            incorporating the top meter or so of the ocean, whereas
   Historical in-situ ocean temperature and salinity pro-   the satellite data measures the top centimeter or so of
file data are provided by the National Oceanographic        the ocean.
Data Center (NODC, released in 2002).
   “Atlantic Tropical Storm and Hurricane Tracks”
data are from the National Hurricane Center (http://        3. Background and analysis
www.nhc.noaa.gov/). The dataset includes tropical           a. Amazon and Orinoco River plumes
storms [tropical cyclones that attain wind speeds
greater than 17 m s⫺1 (34 kt or 39 mph)] and hurricanes        The freshwater discharges from the Amazon and
[as noted above, tropical cyclones that attain wind         Orinoco Rivers spread outward into the western equa-
speeds greater than 33 m s⫺1 (64 kt or 74 mph)], but        torial Atlantic Ocean while continually mixing with sur-
does not include tropical depression data [tropical         rounding salty ocean surface water. The geographical
cyclones with wind speeds less than 17 m s⫺1 (34 kt or      distribution of the low-salinity signatures of the Ama-
39 mph)].                                                   zon and Orinoco River plumes can be revealed with
   Microwave satellite–derived SST measurements are         historical in situ surface salinity data. The low salinity
from the Tropical Rainfall Measuring Mission                from the Amazon River freshwater plume flows to the
(TRMM) Microwave Imager (TMI) beginning in early            northwest along the coast (Ou 1989) from January to
December 1997. TMI data are produced by Remote              June (Ffield 2005) until it reaches the eastern edge of
Sensing Systems and sponsored by the National Aero-         the Guiana Plateau (52°W), where it spreads broadly
nautics and Space Administration (NASA) Earth Sci-          northward. From July to December (Ffield 2005) the
ence Research, Education and Applications Solution          Amazon River freshwater signal is also observed to
Network (REASoN) Project (data are available online         flow to the northwest along the coast, but then at the
at www.remss.com). The advantage of the TRMM Mi-            eastern edge of the Guiana Plateau it extends north-
crowave Imager (Wentz and Meissner 2000) is its abil-       ward, and then both westward (merging with the Ori-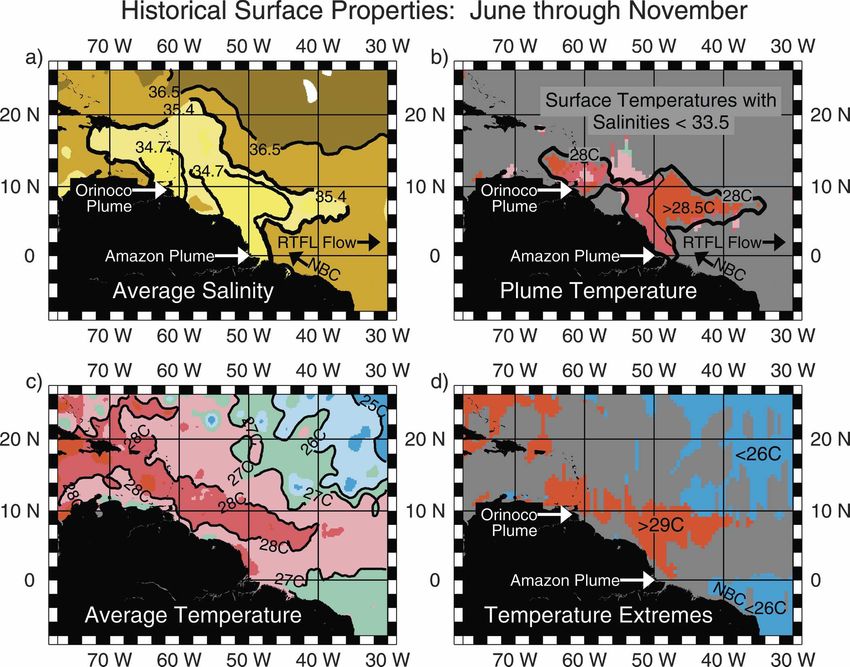
318                                             JOURNAL OF CLIMATE                                                      VOLUME 20

   FIG. 1. The June through November hurricane season: (a) average surface salinity highlighting the Amazon–Orinoco River plume
signature, (b) surface temperature for only profiles with surface salinities less than 33.5 to isolate the temperature signal of the
Amazon–Orinoco River plume, (c) average surface temperature, and (d) surface temperature extremes with only temperatures greater
than 29°C (primarily located in the plume region) and less than 26°C (found in the NBC and the northeastern quadrant) plotted.

noco River plume) and eastward (Lentz and Lime-                    tropical convection (Wang and Enfield 2001). The an-
burner 1995; Lentz 1995).                                          nual cycle of tropical Western Hemisphere warm pool
   The spreading of the Amazon and Orinoco River                   intensity and areal extent is associated with the annual
plumes into the western equatorial Atlantic Ocean is               development of tropical storms and hurricanes (Wang
the topic of numerous papers (e.g., Gonzalez-Silvera et            and Enfield 2001).
al. 2004; Astor et al. 2003; Hellweger and Gordon 2002;
Kelly et al. 2000; Signorini et al. 1999; Muller-Karger et
                                                                      1) SALINITY    SIGNATURE OF THE PLUME
al. 1988), and the plumes are pertinent to a host of
chemistry (Koertzinger 2003; Cutter et al. 2001; Ternon               Coinciding with the Atlantic hurricane season, the
et al. 2000), biology (Carpenter et al. 2004), fisheries           plumes from both the Amazon and Orinoco Rivers
(de Moura et al. 2001), and geology (Warne et al. 2002)            combine and spread to their average maximum histori-
studies. The SST in the region is linked to Amazon                 cal extent during 1 June through 30 November, as re-
Basin rainfall (Fu et al. 2004; Labat et al. 2004; Ron-            vealed by the 35.4 salinity contour of the averaged his-
chail et al. 2002; Wang and Fu 2002; Fu et al. 2001;               torical surface salinity data (Fig. 1a) reaching north-
Liebmann and Marengo 2001) and the intertropical                   ward (22°N, 58°W), westward (15°N, 77°W), and
convergence zone (Chang et al. 2000). In addition, the             eastward (7°N, 34°W). The average surface salinity in-
plumes spread into the region classified as the tropical           side this 35.4 salinity contour is less than 35.4 and is
Western Hemisphere warm pool, defined by SSTs                      freshest closest to the river outlets. The 35.4 salinity
greater than 28.5°C, and associated with increased                 contour is subsequently used in this study to define the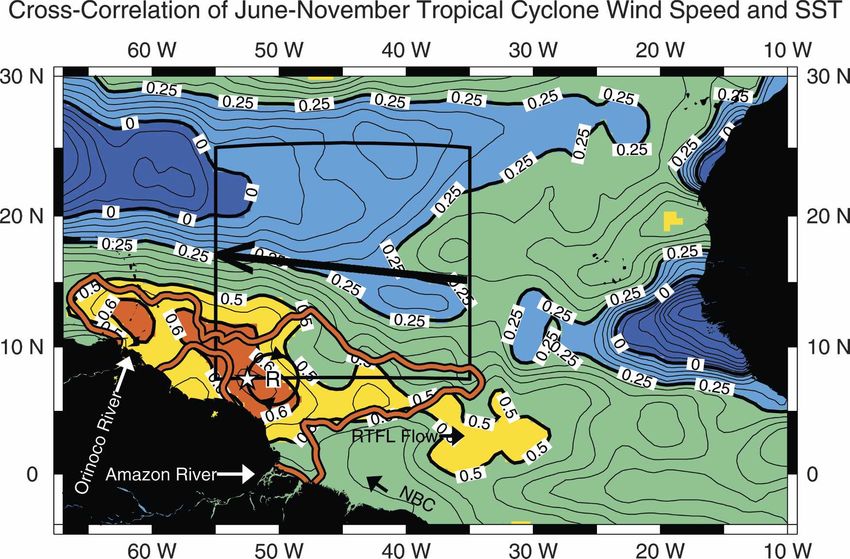
15 JANUARY 2007                                       FFIELD                                                         319

historical average extent of the Amazon–Orinoco River        anomalous salinity signature, in this case 35.4 salinity.
plume during hurricane season.                               Or considered in a different way, 0.23 Sv [1 Sverdrup
   The Amazon–Orinoco River plume is farthest east-          (Sv) ⬅ 1 ⫻ 106 m3 s⫺1] of Amazon and Orinoco fresh-
ward simultaneous with the height of the hurricane sea-      water river discharges mixed with 36 salinity ocean
son from mid-August through mid-October. The maxi-           water can “produce” 13.6 Sv “flow” of 35.4 salinity
mum monthly Amazon River discharge is in May and             plume water, a volume transport comparable to the
June (Hellweger and Gordon 2002). The maximum                upper 50-m-layer flows of the ocean’s major western
monthly Orinoco River discharge is in August (two to         boundary currents.
three months after the Amazon; note that the
                                                               2) TEMPERATURE       SIGNATURE OF THE PLUME
Orinoco’s maximum flow is less than the seasonal mini-
mum flow of the Amazon) (Hellweger and Gordon                   The Amazon and Orinoco River plumes are poten-
2002). In the eastern extension of the plume (7°N,           tially important to tropical cyclone evolution, because
34°W), the seasonal cycle of the river-influenced, low-      the plume is associated with the warmest temperatures
salinity ocean surface waters is from July to October,       in the region (Pailler et al. 1999; Ffield 2005). Pailler et
with a minimum salinity of 32.8 (an extremely low            al. (1999) reveal the dynamics of the temperature asso-
open-ocean value) in August, which is two to three           ciation by mapping the barrier layer connected with the
months after the maximum in the Amazon River dis-            freshwater discharge of the Amazon River as it spreads
charge and coincides with the height of the hurricane        into the western equatorial Atlantic Ocean, inhibiting
season; during the rest of the year, November to June,       mixing between surface and subsurface waters and
the salinity averages 36.0 in that region (a typical open-   trapping solar heating within the 3–30-m ocean surface
ocean value), indicating that there is no freshwater         layer due to the sharp vertical contrast in density. Here,
river discharge influence at that location during those      the temperature signal associated with the low-salinity
months (Ffield 2005). For the westward extension of          waters of the plume is isolated by averaging the surface
the plume (15°N, 77°W), low salinities are observed          temperatures of only stations with surface salinities less
entering the Caribbean, and a high inverse correlation       than 33.5 (a relatively restrictive cutoff because the av-
(R2 ⫽ 0.92) is found between the annual cycle of ocean       erage plume extent was defined above using the saltier
surface salinity near Barbados (approximately located        35.4 salinity contour). This restricts nearly all the re-
at 13°N, 59°W) and the 2-month lagged Amazon River           maining data to the region within the plume boundaries
discharge, which is concluded to predominate over the        (as defined by the 35.4 salinity contour), and the core of
Orinoco River discharge (Hellweger and Gordon                warmest temperatures associated with the plume is re-
2002). The ocean surface salinity near Barbados is mini-     vealed by the 28.0°C contour (Fig. 1b) reaching north-
mum in June (34.24), the beginning of the Atlantic hur-      ward (15°N, 64°W), westward (14°N, 66°W), and east-
ricane season, and maximum in January (35.48), two           ward (7°N, 34°W) during the June through November
months after hurricane season is finished (Hellweger         hurricane season months. Inside the 28.0°C tempera-
and Gordon 2002).                                            ture contour, average plume surface temperatures
   The large size of the plume is the result of the tre-     greater than 28.5°C are revealed in the eastern exten-
mendous freshwater outflows from the Amazon and              sion of the plume. The mapping of the river plume
Orinoco Rivers that discharge almost 20% of the total        barrier layer (Pailler et al. 1999) is similar to this map-
annual global freshwater river outflow directly to the       ping of the core of warmest temperatures associated
surface waters of the western equatorial Atlantic and        with the plume. (Note that even higher SSTs are ob-
Caribbean. While the Amazon River influence is prob-         served in the Caribbean Sea, which is not included in
ably most important—its discharge is nearly 10 times         this study.)
larger than the Orinoco’s discharge—in this study both          In comparison to the warm temperatures associated
rivers are generally referred to because signatures from     with the plume, the ocean surface temperatures to the
each river are clearly observed just offshore of their       north and to the northeast are much cooler, averaging
respective deltas, but it is beyond the scope of this pa-    between 25° and 27°C during hurricane season (Fig.
per to distinguish between the two signals farther off-      1c). By extracting only the extreme temperature values
shore where they appear merged. The combined fresh-          during hurricane season from the dataset, the locations
water river discharge can affect a considerable ocean        of the potentially warmest versus coolest regions are
volume, because, as in this case, the regional ocean with    exposed: ocean surface temperatures warmer than 29°C
salinities generally greater than 36 can be diluted by       are found in the plume region versus cooler than 26°C
just a tiny portion of zero-salinity river water to form     both to the northeast and to the southeast (in the
modified plume waters with a dynamically significant         NBC), a contrast of more than 3°C (Fig. 1d).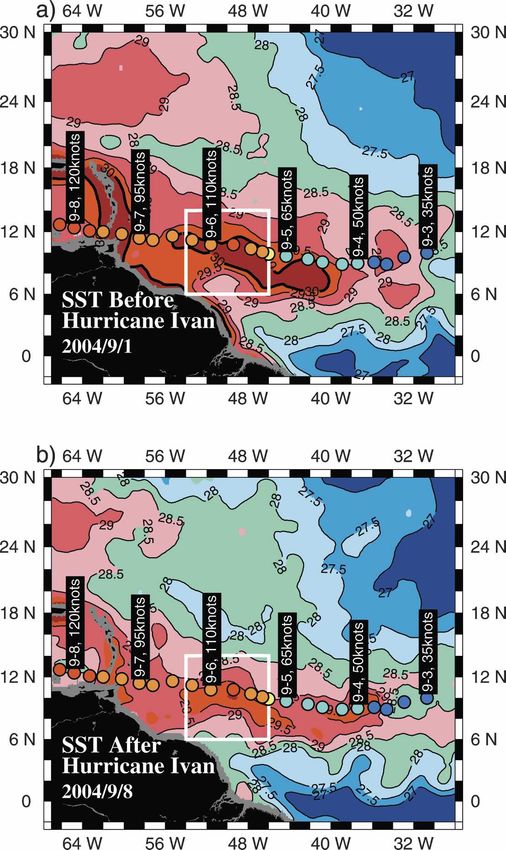
320                                            JOURNAL OF CLIMATE                                                  VOLUME 20

                     FIG. 2. The 1960 to 1965 hurricane tracks for tropical cyclones that attained maximum wind
                  speeds of 83 kt or greater (category 2 hurricane or higher). The historical average extent of
                  the Amazon–Orinoco River plume during hurricane season (Fig. 1a) is shown in green.
                  Hurricane tracks passing through (outside) the plume are indicated by thick yellow (thin blue)
                  lines. The tropical cyclones initially travel westward. The southernmost hurricane track is
                  Hurricane Flora, 1963, a category 4 hurricane. The historical average extent of the warmest
                  temperatures of the Amazon–Orinoco River plume during hurricane season (Fig. 1b) is shown
                  in red. Schematic positions of the NBC, the NBC retroflected flow (RTFL), and a recently
                  shed NBC ring (R) are indicated on the map.

   3) BUOYANCY SIGNATURE OF THE PLUME                             sive ⬃33-m-thick plume. Therefore, seasonal and inter-
   The plume’s pool of buoyancy contributes to its per-           annual variability in the temperature, stability, area,
sistence to remain as a distinct surface layer and inhibits       and depth of the plume are probably important factors
the potential for deep-reaching wind mixing due to its            to consider, but all are outside the scope of this paper.
high stability. The average salinity profile for the east-
                                                                     4) HISTORICAL       TROPICAL CYCLONES TRACKS
ern extension of the plume (not shown) reveals the
low-salinity signature reaching to 50-m depth in con-                Examples of individual hurricane tracks reveal that
trast to the much higher salinities in the upper 50 m in          hurricanes often pass directly through the northern sec-
the neighboring regions. Viewed in terms of density               tion of the Amazon–Orinoco River plume. In Fig. 2, the
(combining the buoyancy effects of temperature and                tracks for tropical cyclones that at some point attain
salinity; not shown), even in the far offshore northern           maximum wind speeds of 83 kt or greater (i.e., category
section of the plume the density in the surface (22.3             2 hurricanes and greater) for the 1960 to 1965 time
sigma theta) and in the upper 50 m (22.9 sigma theta) is          period are shown, as an example, revealing that 14 of
far more buoyant (and therefore stable) than the sur-             the hurricanes pass over the historical region of the
rounding waters (surface and upper 50-m densities all             plume (yellow lines) and 12 do not (thin blue lines). In
23.7 sigma theta and denser). During hurricane season             fact, as hurricane strength increases, an increasing per-
the plume varies from 10- to 60-m depth, with an aver-            centage of hurricanes pass through the plume region:
age of 33 m, defined by restricting salinities to less than       for the 1960 to 2000 time period 68% of the 19 hurri-
35.4 at the sea surface and less than 35.8 at depth; the          canes that attained maximum wind speeds greater than
average minimum (maximum) plume depths are 10 to                  135 kt (i.e., category 5 hurricanes) passed directly over
20 m (20 to 60 m) deep. However, it is likely that the            the historical region of the plume, whereas only 32%
plume is patchy at times, both in ocean–atmosphere                never passed over the plume (Table 1). This reveals
area contact and in depth, varying from thin patches of           that most of the most destructive hurricanes may be
insignificant ⬃2- to 5-m slicks, to a continuous, exten-          directly influenced by ocean–atmosphere interaction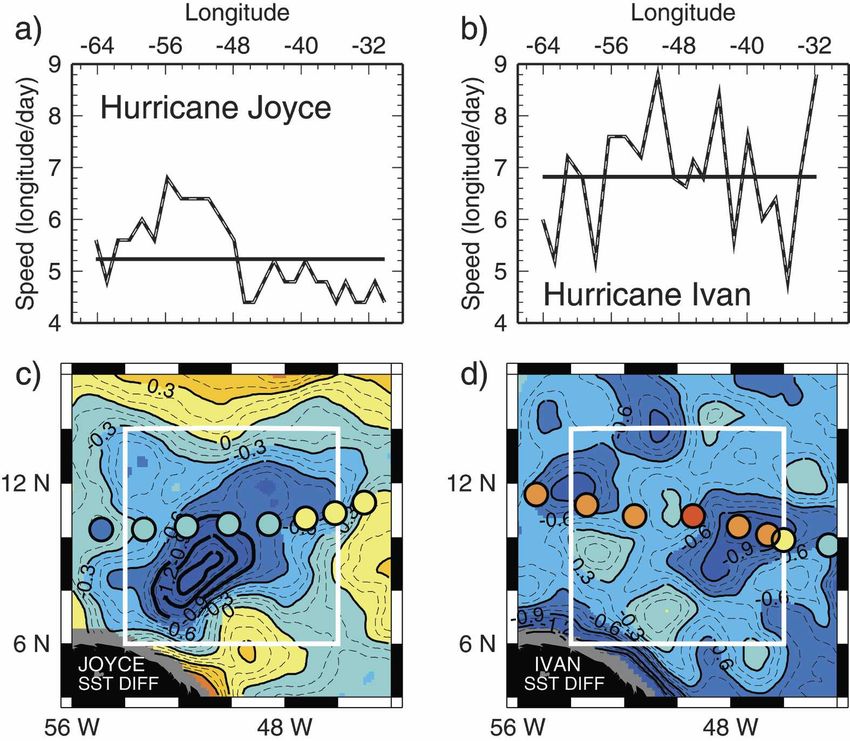
15 JANUARY 2007                                                FFIELD                                                            321

  TABLE 1. The distribution of 1960–2000 hurricanes by location.       TABLE 2. The distribution of 1960–2000 hurricanes by category
With increasing category (hurricane strength), an increasing (de-   within each location. With increasing category (hurricane
creasing) percentage of hurricanes pass through (outside) the       strength), the percentage of hurricanes passing through (outside)
plume region. For example, for category 5 hurricanes, 68% passed    the plume region remains relatively similar (decreases). For ex-
through the plume region, while only 32% passed outside the         ample, for hurricanes passing through the plume region, 16% are
plume region.                                                       category 5 and relatively similarly, 22% are category 1, whereas
                                                                    for hurricanes passing outside the plume region, only 4% are
Hurricanes     Through plume     Outside plume     All hurricanes   category 5 and significantly more, 54%, are category 1.
1960–2000      No.   No./total   No.   No./total       Total
                                                                    Hurricanes     Through plume     Outside plume     All hurricanes
Category   1   17      17%       84      83%            101
                                                                    1960–2000      No.   No./total   No.   No./total   No.   No./total
Category   2   13      29%       32      71%             45
Category   3   18      45%       22      55%             40         Category   1   17      22%        84     54%       101     43%
Category   4   18      60%       12      40%             30         Category   2   13      16%        32     21%        45     19%
Category   5   13      68%        6      32%             19         Category   3   18      23%        22     14%        40     17%
                                                                    Category   4   18      23%        12      8%        30     13%
                                                                    Category   5   13      16%         6      4%        19      8%
with the plume just prior to reaching the Caribbean.                Total          79                156               235
Tallied within subregions, of all 1960 to 2000 hurri-
canes, 16% of those passing over the warm plume ulti-               much warmer ocean water when they reach the Ama-
mately attain category 5 strength, whereas only 4% of               zon–Orinoco River plume. Warm SSTs in the northern-
those passing outside of the plume ultimately attain                most reach of the plume (22°N, 58°W), north of the
category 5 strength (Table 2). In contrast, the weakest             core of warmest plume temperatures, are also linked to
hurricanes (category 1) typically do not pass over the              the freshwater discharge of the rivers, but a less restric-
plume (only 17%), and instead most (83%) miss the                   tive salinity cutoff must be used in order to allow for the
warm plume temperatures and pass outside (i.e., north)              reduced intensity of the freshwater river signal with
of the plume (Table 1). Hurricanes are cyclonic and                 distance from shore due to vertical mixing with subsur-
typically have 300- to 1000-km diameters; therefore the             face saltier waters as well as horizontal mixing with
ocean–atmosphere contact between the hurricanes and                 regional saltier surface waters (evaporation may also be
the plume is much larger than the one-dimensional hur-              a factor). Pailler et al. (1999) show this temperature
ricane track lines convey. The southernmost hurricanes,             association with a temperature–salinity diagram. In a
those with tracks south of 14°N, are likely to be most              similar fashion, by contrasting stations with surface sa-
directly influenced by the warmest core temperatures                linities less than 35.8 versus those with surface salinities
of the plume.                                                       greater than 35.8 during the June through November
   Using all the hurricane track data reveals that Atlan-           hurricane season, the temperature–salinity scatterplot
tic tropical cyclones historically pass just north of the           for data within the 12° to 20°N latitude band indepen-
core of the warmest surface temperatures of the Ama-                dently reveals the warm temperature signal and geo-
zon–Orinoco River plume and directly over the north-                graphical position of the Amazon–Orinoco River
ernmost portion of the low-salinity reach of the plume.             plume at these more northern latitudes (Fig. 4). In this
By binning all tropical storm and hurricane tracks from             case, the average surface temperatures first encoun-
1950 through 2003 in one-degree squares, the historical             tered by tropical cyclones moving westward between
tropical cyclone corridor is revealed along approxi-                12° and 20°N is only 26°C (Fig. 4, blue symbols), but
mately 12° to 20°N (Fig. 3). As suggested above by the              upon reaching the Amazon–Orinoco River plume,
hurricane track examples (Fig. 2), this corridor passes             identified by the lower salinities, the average surface
through the northernmost portion of the average his-                temperature encountered by tropical cyclones is 2°C
torical position of the Amazon Plume defined by the                 warmer, 28°C (Fig. 4, red symbols). Seasonal and inter-
35.4 salinity contour (Fig. 3, green contour) and asso-             annual variability in the northward spreading of the
ciated with 2°C on average warmer surface tempera-                  Amazon–Orinoco River plume may also be an impor-
tures (Fig. 4, red circle symbols). The corridor also               tant factor controlling the ocean temperatures encoun-
passes alongside, just north of, the ⬎28°C maximum                  tered by hurricanes in the 12° to 20°N latitude band at
temperatures associated with the plume for a distance               this location.
of about 3300 km (Fig. 3, red contour).
                                                                      6) UPPER-OCEAN         TEMPERATURES AND SALINITIES
  5) SSTS      ENCOUNTERED BY HURRICANES                            ENCOUNTERED BY HURRICANES

  As hurricanes move westward across the Atlantic in                  In outlining the SST conditions during hurricane sea-
the 12° to 20°N latitude band they abruptly encounter               son, the ocean characteristics below the air–sea bound-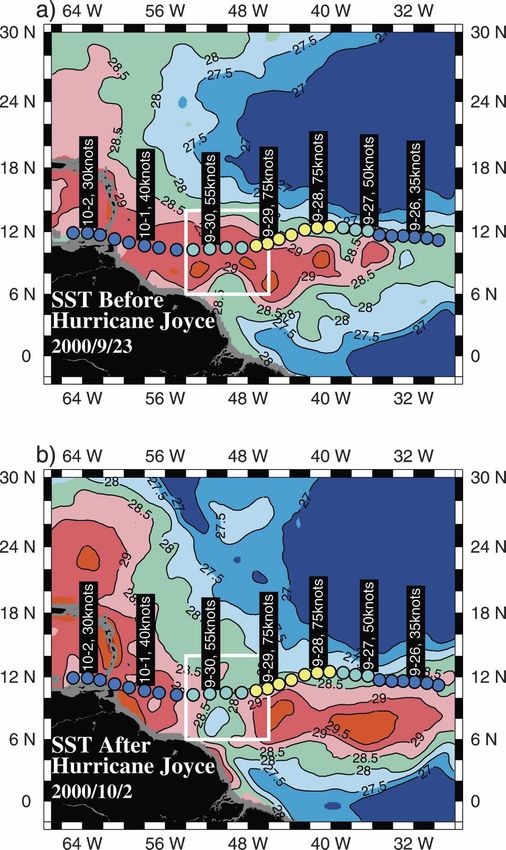
322 JOURNAL OF CLIMATE VOLUME 20
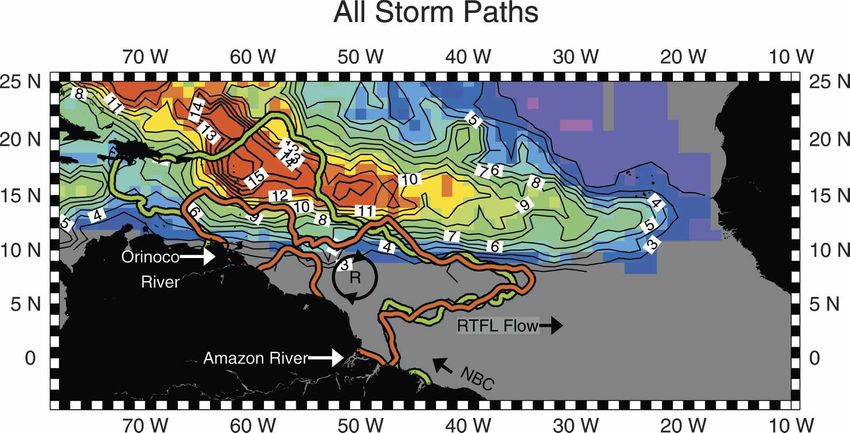
FIG. 3. The number of 1950 through 2003 “best track” tropical storms and hurricanes per
one degree square (smoothed by a 3° ⫻ 3° block average). The tropical cyclones initially
travel westward.
ary also need to be considered, because warm SSTs northwesterly along the coast of Brazil, retroflects near
during a tropical cyclone event can be cooled quickly by 6°N, 48°W, and then flows easterly; at the retroflection
vertical mixing with colder subsurface water. In general the NBC periodically sheds 300–500-km-diameter anti-
the subsurface temperatures mirror the SST trends, cyclonic rings that translate toward the Caribbean Sea
such that regions with warmer (cooler) SSTs also have (Goes et al. 2005; Fratantoni and Richardson 2006; Fra-
relatively warmer (cooler) subsurface temperatures. tantoni and Glickson 2002; Garraffo et al. 2003; Garzoli
In the zonal strip that is frequently traversed by et al. 2003; Goni and Johns 2003; Johns et al. 2003;
tropical cyclones (same zonal strip as in Fig. 4), the Wilson et al. 2002; Limeburner et al. 1995). Historical
northern plume temperatures are consistently very salinity data during hurricane season highlight the jux-
warm during hurricane season throughout the upper taposition between the NBC retroflection, with high
ocean, averaging from 28°C at the sea surface down to surface salinities, and the Amazon–Orinoco River
25.5°C at 100-m (⬃db) depth, with a narrow standard plume, with low surface salinities (35.4 salinity contour;
deviation envelope (Fig. 5a, red). These warm tempera- 6°N, 48°W; Fig. 1a). During hurricane season, the NBC
tures are again associated with the river-influenced low- rings carry relatively cool ocean surface temperatures
salinity signature, which can be easily discerned from from the NBC (down to less than 26°C) directly
the ocean surface down to 50 m with salinities less than through the middle of the historical location of the
36 (Fig. 5b, red). In contrast, to the east in the strip warm Amazon–Orinoco River plume (up to more than
frequently traversed by tropical cyclones, as well as to 29°C; Fig. 1d). This is opposite to 1) the January to June
the north of the strip, the ocean temperatures through- time period when the SSTs of the rings and retroflec-
out the upper ocean during hurricane season are much tion are relatively warm in comparison to the regional
cooler, averaging between 25° and 26°C at the surface, ocean SSTs (Ffield 2005), and 2) the relatively warm
down to around 22°C at 100 m, with a large standard SSTs associated with NBC rings when they are in the
deviation envelope (Fig. 5a, blue and green), and the Caribbean Sea (Goni et al. 2004; Goni and Trinanes
salinities are all higher than 36 (Fig. 5b, blue and 2003). The NBC rings are on the order of half the di-
green). Consequently, even with deep-reaching mixing ameter of Atlantic hurricanes, and they are slow mov-
down to 100-m depth into the ocean, hurricanes passing ing, taking a month or so to move through the plume
over the plume region will abruptly encounter signifi- region. Therefore, the up to 3°C cooler surface tem-
cantly warmer, and more stable, ocean temperatures. peratures of the rings may cover a sufficiently large
ocean surface area, for a long enough time, to diminish
b. NBC retroflection and rings the warm temperature effect of the much larger and
To fully assess the impact of the warm Amazon– more visible pool of warm temperatures associated with
Orinoco River plume on hurricanes, or even to just the Amazon–Orinoco River plume.
properly interpret satellite SST images in the region, It is of particular importance to note that it takes
the role of NBC rings that periodically move through extra effort to identify the cool surface temperatures of
the plume region must be considered. The NBC flows NBC rings when using satellite SST data, because at the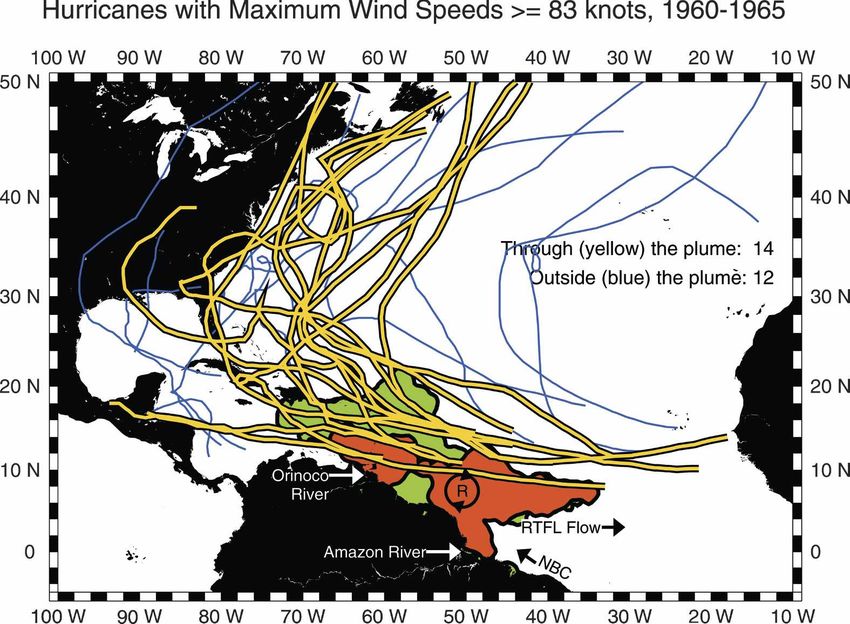
15 JANUARY 2007                                              FFIELD                                                       323

                     FIG. 4. Scatterplot of the June–November SST vs sea surface salinity for a zonal strip
                  frequently traversed by tropical cyclones. All points with salinities greater than 35.8 are
                  colored blue, and all points with salinities less than 35.8 are colored red. The saltier salinities
                  (blue) are found to the east (map inset) and on average they are 2°C cooler than the fresher
                  salinities, which are located to the west, associated with the Amazon–Orinoco River plume.
                  Tropical cyclones traversing this zonal strip may abruptly encounter considerably warmer
                  plume SSTs as they initially move westward. The historical average extent of the Amazon–
                  Orinoco River plume during hurricane season (Fig. 1a) is shown in green. The historical
                  average extent of the warmest temperatures of the Amazon–Orinoco River plume during
                  hurricane season (Fig. 1b) is contoured in red. Schematic positions of the NBC, the NBC
                  retroflected flow (RTFL), and a recently shed NBC ring (R) are indicated on the map.

sea surface warm Amazon–Orinoco River plume wa-                      spinning ring. At deeper levels the spinning ring carries
ters can partially or completely hide their presence.                the cooler and saltier South Atlantic water character-
Compounding the difficulty, there are only a few de-                 istic of the NBC. In this situation concurrent satellite
tailed oceanographic surveys of NBC rings, especially                SST observations will not reveal the presence of the
during hurricane season, which could help guide proper               cool near-surface NBC ring waters, because they are
interpretation of satellite data. In the following ex-               hidden just underneath the warm plume. [However, the
ample, Amazon–Orinoco River plume water is ob-                       ring can be successfully monitored by continuous track-
served to completely cover the surface of an NBC ring.               ing of the SST fields (“TMI-98-7”; Ffield 2005).] There-
In December 1998 (Fig. 6a), a ring was surveyed (Wil-                fore, the influence of the warm Amazon–Orinoco River
son et al. 2002) that probably shed from the NBC ret-                plume on hurricanes cannot be solely determined by a
roflection around October 1998 during hurricane sea-                 quick view of satellite SST observations, as relatively
son, and therefore may be characteristic of rings during             cool NBC rings hiding just underneath the warm plume
hurricane season. The ring displays warm (⬎28.4°C)                   can contribute to much faster cooling of SST as hurri-
and low-salinity, river-influenced (⬍35.4) plume water               canes pass by.
in the top-most 30–40 m, centered over the core of the                  Strong winds from the 300–1000-km-diameter cy-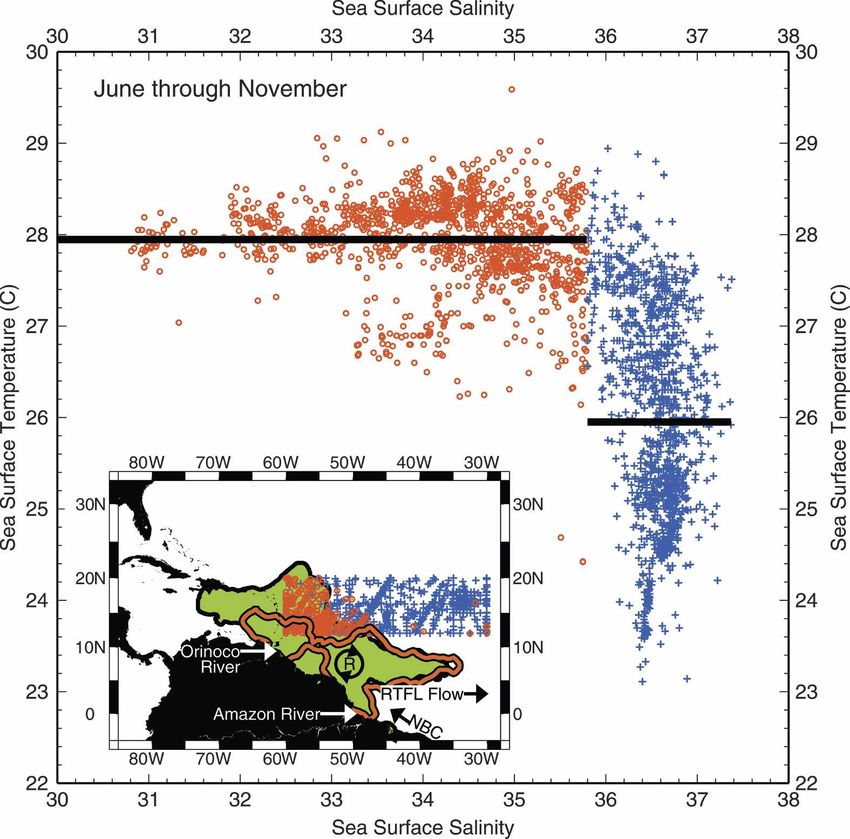
324                                                 JOURNAL OF CLIMATE                                                           VOLUME 20

   FIG. 5. Average hurricane season (a) temperature and (b) salinity ocean profiles, with one standard deviation envelopes, for a zonal
strip that is frequently traversed by tropical cyclones (same zonal strip as used in Fig. 4), and a region to the north (colored green).
Within the zonal strip, all profiles with surface salinities greater than 35.8 are colored blue, and all profiles with surface salinities less
than 35.8 are colored red (river-influenced plume water). The plume waters (red) are significantly warmer throughout the upper 100
db (⬃m) and clearly fresher down to 50 m than the cooler and saltier waters to the east (blue) and to the north (green). Therefore,
tropical cyclones can abruptly encounter considerably warmer upper-ocean temperatures in the plume, even if the ocean becomes well
mixed down to 100 m. On the inset station map, the historical average extent of the Amazon–Orinoco River plume during hurricane
season (Fig. 1a) is shown in green, and the historical average extent of the warmest temperatures of the Amazon–Orinoco River plume
during hurricane season (Fig. 1b) is contoured in red.

clonic hurricanes might quickly obliterate a thin plume,                retroflection around December 1998, just after hurri-
exposing several degrees cooler NBC ring water di-                      cane season ended. The ring reveals high-salinity
rectly to the atmosphere midstorm. Possibly there is a                  (⬎36.2) South Atlantic water throughout its upper lay-
relationship dependent on the translation speed of hur-                 ers, with low-salinity (⬍35.4) plume waters caught only
ricanes with slow and vigorous hurricanes most likely to                in the top-most 30 m at the edges of the spinning ring.
mix through to the cool temperatures of rings. Alter-                   The ring carries temperatures around 27°C throughout
natively, it is plausible that instead a slow hurricane                 the upper layers (which are actually warmer than the
may be able to intensify by continually drawing energy                  surrounding waters as this example is not during hur-
from a plume that is sufficiently deep and stable enough                ricane season). SSTs associated with this ring are easily
to shield the hurricane from any effect of cool ring                    observed in satellite SST observations (“TMI-99-1”;
waters hidden underneath.                                               Ffield 2005), in contrast to the previous example, dem-
   A second example of an NBC ring is shown to point                    onstrating the variability in the SST signature of NBC.
out how Amazon–Orinoco River plume water can also                       Therefore, while the potentially cooling effect of NBC
just partially hide the presence of a ring. In this case the            rings on the SSTs during hurricane season in the Ama-
plume water is entrained just at a ring’s edges, so con-                zon–Orinoco River plume region should be considered,
current satellite SST observations should detect most of                it is not necessarily an easy task, because a thin layer of
the near-surface temperature signal associated with the                 warm plume water can partially or completely hide the
ring. In February 1999 (Fig. 6b), a ring was surveyed                   potentially more substantive cool near-surface tem-
(Wilson et al. 2002) that probably shed from the NBC                    peratures of a ring.
15 JANUARY 2007 FFIELD 325
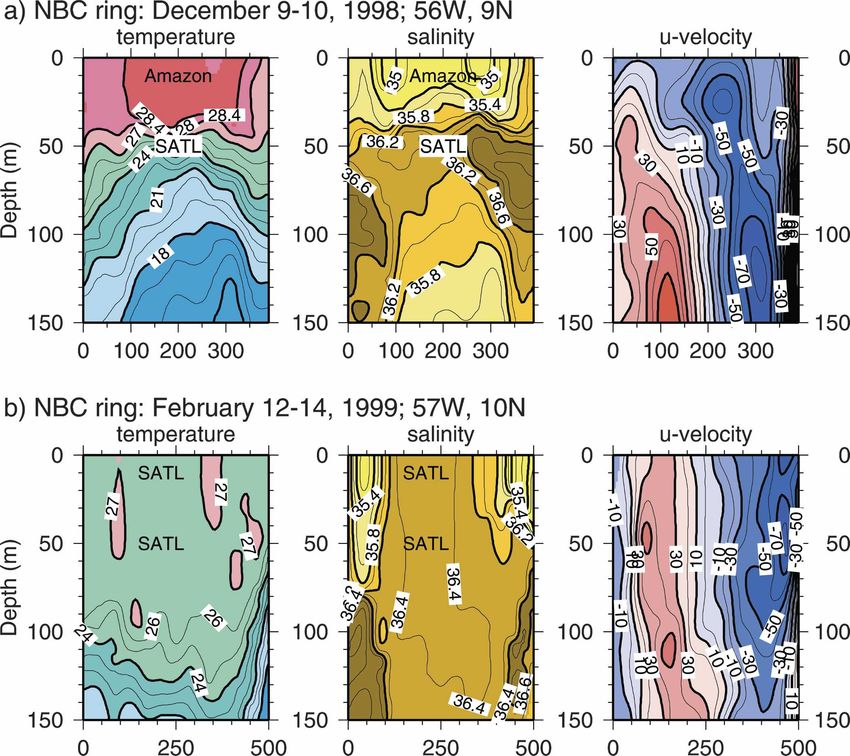
FIG. 6. Two contrasting examples of the anticyclonic (clockwise) NBC rings are shown with depth vs distance (km; northern end at
0 km) sections for temperature (°C), salinity, and velocity (cm s⫺1; westward: ⫺; eastward: ⫹). (a) A thermocline-intensified ring
observed in December 1998 that reveals maximum swirl velocities below 100 m, and (b) a surface-intensified ring observed in February
1999 that reveals maximum swirl velocities above 75 m. In (a) warm (⬎28.4°C) and low-salinity (⬍35.4) Amazon–Orinoco River plume
water is revealed in the topmost 30–40 m centered over the core of the spinning ring. In (b), high-salinity (⬎36.2) South Atlantic water
is observed throughout the ring’s upper layers with low-salinity (⬍35.4) plume waters caught only on the edges of the ring in the
topmost 30 m.
c. Two hurricane case examples sider in future, dedicated studies on the demise, in the
first case, and the maintenance/intensification, in the
Two hurricane case examples are shown to illustrate
second case, of hurricanes passing through the plume
the hypothesis of the possible role of the Amazon–
region.
Orinoco River plume ocean region as a participant in
the evolution of hurricanes. Microwave (cloud-
1) HURRICANE JOYCE, 2000
penetrating) satellite-derived SST data are used in jux-
taposition with wind-speed coded hurricane tracks. In The Amazon–Orinoco River plume SST conditions a
both examples, the warm SSTs of the plume and the few days prior to Hurricane Joyce were not particularly
intruding cool SSTs of the NBC retroflection from the extensive or warm for the time of year, and the cool
south are evident. However, the contrasting sizes and NBC retroflection had pushed relatively far northwest
temperatures of the plume and the presence of an NBC into the plume. In September–October of 2000, Hurri-
ring differentiate the two cases, and these factors are cane Joyce became a hurricane after passing west of
presented as examples of the possible influences to con- 38°W, attaining an 80-kt wind speed (category 1) at326 JOURNAL OF CLIMATE VOLUME 20
relatively cold (⬍28.5°C) NBC retroflection had
pushed northwestward to 8°N, 50°W, about 220 km
south of the future path of the center of the hurricane
(in the southern part of the white box in Fig. 7a). From
8 yr of altimetry data, the average northerly position of
the NBC retroflection is 6.7°N ⫾ 1.8° (Fonseca et al.
2004). Therefore, the NBC retroflection just prior to
Hurricane Joyce is more northerly than average.
Hurricanes passing through the western tropical At-
lantic Ocean can expose cool NBC rings concealed just
underneath the warm surface waters of the Amazon–
Orinoco River plume or they can contribute to keeping
the cool SSTs of a newly shed NBC ring exposed. The
SST image a few days after Hurricane Joyce passed
reveals that, between 52° and 48°W, the warm SSTs of
the plume were obliterated and a broad meridional
swath of cool SSTs was exposed (48°–53°W; Fig. 7b). In
addition, there is now, with SSTs less than 28°C, a char-
acteristic circular surface signature of a cool NBC ring
isolated within the warm surface waters of the Ama-
zon–Orinoco River plume (southern half of white box,
Fig. 7b). The cool SST features coincide, whether coin-
cidentally or causally, with the hurricane winds drop-
ping suddenly from their maximum levels, and subse-
quently dissipating altogether just to the west. While
directly over the swath of cool SSTs, the winds dropped
from 70 to 55 kt. The maximum SST contrast between
the warm plume (⬎29.5°C) and the ring feature
(⬍27.5°C) is 2°C. The SST difference map, calculated
as the difference between the “after” and “before” SST
images of Hurricane Joyce, and expanded for the NBC
ring generation region, clearly reveals the sharply de-
lineated ring feature with SSTs ⫺0.9° to ⫺1.5°C cooler
FIG. 7. Two microwave satellite-derived SST composite images
of the Amazon plume region revealing the SST conditions (a)
than before the hurricane (Fig. 8c).
before and (b) after the passing of Hurricane Joyce, a category 1 Hurricane Joyce was a relatively slow moving hurri-
hurricane that attained wind speeds of 80 kt in September– cane in comparison to the next case example, and this
October 2000. Color-coded circles mark the 6-h positions and may have enabled sufficient time for the cool SSTs of
wind speeds of the hurricane. A white outlined box centered at the NBC ring to be exposed to the surface by the hur-
10°N, 50°W highlights the NBC ring generation region and is
shown for easier cross comparison. Five days of data, centered on
ricane-strength winds. The westward translation speed
23 Sep 2000 in (a) and 2 Oct 2000 in (b), have been averaged to of Hurricane Joyce averaged around 5 degrees of lon-
construct the SST images, which are smoothed by a 2° ⫻ 2° block gitude per day (Fig. 8a). In addition, the relative cool-
average. ness, and therefore probably weak stability, of the
plume just prior to the hurricane passing may also have
12.2°N, 42.5°W, but then surprisingly dropped to lower contributed to the potential ease in exposing the NBC
wind speeds (⫺5 kt over 6 h) after passing west of ring to the atmosphere. It is concluded that the pres-
10.9°N, 46.1°W (Lawrence 2000; color-coded circles, ence of a large, cool NBC ring, suddenly exposed within
Fig. 7a). Before the hurricane, the warmest plume SSTs the warm plume waters during Hurricane Joyce, is an
were ⬎29.5°C, and were just to the south of the immi- important factor to consider in studies of the hurri-
nent center track path of Hurricane Joyce (Fig. 7a). In cane’s demise.
the region bounded by 5°–15°N, 55°–35°W, only 40% of
2) HURRICANE IVAN, 2004
the SSTs were warmer than 29.0°C, but 13% were
cooler than 28.0°C, quite cool conditions in comparison The Amazon–Orinoco River plume SST conditions a
to the next case example. Also before the hurricane, the few days before Hurricane Ivan were quite extensive15 JANUARY 2007 FFIELD 327
FIG. 8. The westward translation speed time series of (a) relatively slow-moving Hurricane
Joyce and (b) relatively fast-moving Hurricane Ivan, calculated as degrees of longitude per
day; the averages are indicated by the straight solid lines. (c), (d) The SST (°C) difference
maps, calculated as the difference in SST between the “SST after” and “SST before” maps of
the corresponding figures (Fig. 7 and Fig. 9). (c) For Hurricane Joyce, the SST difference map
reveals the sharply delineated cool NBC ring (⫺0.9° to ⫺1.5°C), and (d) for Hurricane Ivan,
the SST difference map reveals unstructured, yet overall cool temperatures (down to ⫺1.0°C).
In (c) and (d), the white outlined boxes centered at 10°N, 50°W highlight the NBC ring
generation region and are shown for easier cross comparison.
and warm, and the NBC retroflection was also warmer. However in this case the NBC retroflection is signifi-
In September 2004, Hurricane Ivan, ultimately a cat- cantly warmer, with its northernmost tip 1.0°C warmer
egory 5 hurricane and the strongest hurricane to be (29.5°C) than it was for Hurricane Joyce (28.5°C). SSTs
recorded so far south, continually intensified as it cooler than 28.5°C in the NBC retroflection are more
passed through the plume attaining a 115-kt wind speed than 660 km away from the future center track of Hur-
(category 4) at 10.6°N, 48.5°W, at which point its wind ricane Ivan, outside of its direct ocean–atmosphere
speeds dropped (⫺2.5 kt over 6 h), briefly decreasing to contact, whereas they were only 220 km away, most
90 kt at 11.3°N, 54.4°W, from whence they began to likely in direct ocean–atmosphere contact of Hurricane
increase again (Stewart 2005; Fig. 9a). Before the hur- Joyce.
ricane, the warmest SSTs (⬎29.5°C) in the core of the Depending on seasonal and interannual variability,
plume were directly in the center of the future path of the Amazon–Orinoco River plume may be warm, deep,
Hurricane Ivan (Fig. 9a). The size of the region with stable, and extensive enough such that the plume and
temperatures ⬎28.5°C was about twice as large (Fig. its associated warm ocean surface temperatures are sus-
9a) as it had been for Hurricane Joyce (Fig. 7a). In the tained as a hurricane passes. After Hurricane Ivan
region bounded by 5°–15°N, 55°–35°W, 78% of the passed, the SSTs in the region indicate that despite the
SSTs were warmer than 29.0°C and none were cooler hurricane-force winds, the Amazon–Orinoco River
than 28.0°C just before Hurricane Ivan, a much warmer plume retained its size and characteristically warm tem-
regime than it had been for Hurricane Joyce. Before peratures, with SSTs greater than 29.5°C (Fig. 9b). The
the hurricane, the NBC retroflection is also at about warm plume SST features coincide, whether coinciden-
8°N, 50°W (southern part of the white box, Fig. 9a). tally or causally, with the hurricane winds intensifying328 JOURNAL OF CLIMATE VOLUME 20
FIG. 10. (a) The time series of the June–November average
tropical cyclone wind speed (“⫹” symbols) with the time series of
the June–November average infrared satellite-derived SST (“䊊”
symbols) from 7.5°N, 52.5°W. The wind speed time series is av-
eraged from all the tropical cyclone track data in the 7.9°–25.0°N,
55.0°–35.0°W block. The SST time series is from the location at
the northern edge of the Guiana Plateau where the highest cross-
correlation coefficient, 0.67, is observed in Fig. 11. (b) The 1-yr
block filtered Niño-3 (5°N–5°S, 150°–90°W) SST index plotted to
show ENSO variability for comparison.
course of Hurricane Ivan, as there was for Hurricane
Joyce.
Hurricane Ivan was a relatively fast moving hurri-
cane, and this may have prohibited sufficient time for
cool ocean temperatures underneath the warm Ama-
zon–Orinoco River plume, if there were any, to ever be
exposed to the atmosphere. The westward translation
speed of Hurricane Ivan averaged around 7 degrees of
longitude per day (Fig. 8b). In addition, the extreme
FIG. 9. Two microwave satellite-derived SST composite images
warmness, and therefore probably strong stability, of
of the Amazon plume region revealing the SST conditions (a)
before and (b) after the passing of Hurricane Ivan, a category 5 the plume just prior to the hurricane passing may also
hurricane that attained wind speeds of 140 kt in September 2004. have contributed to the persistence of the warm plume
Color-coded circles mark the 6-h positions and wind speeds of the SSTs despite strong hurricane-force winds. It is con-
hurricane. A white outlined box centered at 10°N, 50°W high- cluded that the presence of a large, warm plume di-
lights the NBC ring generation region and is shown for easier
rectly under the path of Hurricane Ivan for five days is
cross comparison. Five days of data, centered on (a) 1 Sep 2004
and (b) 8 Sep 2004 have been averaged to construct the SST an important factor to consider in future studies on the
images, which are smoothed by a 2° ⫻ 2° block average. maintenance/intensification of Hurricane Ivan.
d. SST and tropical cyclone wind speed statistics
over the plume. While directly over the 30°C (Fig. 9a) Creating hurricane season time series with data just
core of warmest plume SSTs, the winds increased from from June through November months for each year
50 to 110 kt. The SST difference map, calculated as the reveals the known ENSO variability associated with
difference between the after and before SST images of both hurricanes and regional SSTs. All tropical cyclone
Hurricane Ivan, and expanded for the NBC ring gen- wind speed values falling within the 7.9°–25.0°N, 55.0°–
eration region, reveals unstructured, yet overall cool 35.0°W block are averaged together for each June
temperatures with SSTs down to ⫺1.0°C cooler than through November hurricane season, producing a
before the hurricane (Fig. 8d). This leads to the con- single time series with a single average wind speed
clusion that there is no evidence of an NBC ring im- value for each year (Fig. 10a, “⫹” symbols). For tem-
pacting ocean–atmosphere interaction during the perature, infrared satellite-derived SSTs are also aver-15 JANUARY 2007 FFIELD 329
FIG. 11. Map of the cross-correlation coefficient between the 1982–2003 June–November averaged
(one value per year) tropical cyclone wind speed time series for the region outlined by the black
rectangle and each 1982–2003 June–November averaged (one value per year) infrared satellite-derived
SST time series for each one-degree square. The solid black arrow is the average position of the tropical
cyclone track positions within the region used to create the wind speed time series (7.9°–25.0°N, 55.0°–
35.0°W; southernmost tropical cyclone track is at 7.9°N; the time series is shown in Fig. 10a; “⫹”
symbols). The historical average extent of the warmest temperatures of the Amazon–Orinoco River
plume during hurricane season (Fig. 1b) is contoured in red. The higher cross-correlation coefficients,
⬎0.5, are almost all located within the historical position of the plume. The highest cross-correlation
coefficient, 0.67, is located at 7.5°N, 52.5°W (marked with a white star), in the region where recently shed
NBC rings typically pass through.
aged for each June through November hurricane sea- correlations (⬎0.50) are all generally within the histori-
son, producing a time series at each one-degree square cal position of the plume (as defined previously by the
with a single average SST value for each year in 1988 average in situ 28.0°C surface temperatures; Fig. 1b),
through 2003. A single example of an SST time series and the highest correlations (⬎0.60) correspond to the
from within the Plume is shown in Fig. 10a (“䊊” sym- two locations associated with the freshest plume waters
bols). Both time series reveal the known association of stemming from the Orinoco River and the Amazon
hurricanes and regional SSTs with ENSO (Fig. 10b), River mouths (Fig. 1a, two separate 34.7 salinity con-
such that, in this rendition, stronger-than-average tropi- tours). In contrast, the correlations are quite low
cal cyclone wind speeds and warmer-than-usual SSTs (⬍0.25) to the north of the plume even though the wind
are observed during La Niña years (e.g., 1988, 1996, and speed data from that region are included in the average
1999) and weaker-than-average wind speeds and wind speed time series (northern half of the large
cooler-than-usual SSTs during El Niño (e.g., 1987 and “square” on Fig. 11). The region for the wind speed
1997). time series was chosen to simply encompass the corri-
A more general assessment of the association be- dor of historical tropical cyclones. Consequently, the
tween tropical cyclone wind speeds and SSTs in the geographic pattern of cross correlations with SST inde-
region of the Amazon–Orinoco River plume also iso- pendently, and with remarkably similar boundaries,
lates and identifies the plume as the most characteristic highlights the importance of the SST in the region of
feature defining the ocean surface conditions in the re- the historical Amazon–Orinoco River plume. In addi-
gion. The cross correlations between the hurricane sea- tion, the high correlations in the plume region imply
son time series of tropical cyclone wind speed (Fig. 10a) that warm plume SSTs may directly contribute to stron-
and SST at each one-degree square are calculated. The ger hurricane wind speeds. (A causal linkage cannot be
cross-correlation coefficients (Fig. 11) reveal that high proven with this type of analysis.) La Niña is associated330 JOURNAL OF CLIMATE VOLUME 20
with increased rainfall over the nearby continent, which
through river discharge is likely to correlate to a
warmer (and/or more extensive) plume in the same
year. La Niña is also associated with a more vigorous
hurricane season. Therefore, warmer (cooler) plume
SSTs due to increased (decreased) river discharge dur-
ing La Niña (El Niño) may directly contribute to a
more (less) vigorous hurricane season.
The highest cross correlation between the hurricane
season time series of tropical cyclone wind speed and
SSTs locates the center of the Amazon low-salinity
plume water, which also happens to be the within the
FIG. 12. The correlation coefficients for the linear regressions
core of the northwestward translation pathway of NBC (not shown) of all the lagged sets of 52 pairs of values of the
rings just after they shed from the NBC retroflection. average wind speed for each individual tropical storm and hurri-
The highest cross-correlation coefficient (0.67) is at cane passing through the 7.9°–25.0°N, 55.0°–35.0°W block for the
7.5°N, 52.5°W (Fig. 11), where the lowest sea surface years 1982 through 2003, and the infrared satellite-derived SST
salinities stemming from the Amazon River are ob- from 7.5°N, 52.5°W identified at the same time as each event, and
as a function of lagged time, for each event. The largest correla-
served as noted before (Fig. 1a, rightmost 34.7 con- tion coefficients are associated with SSTs 14.6 days earlier than
tour). The hurricane season SST time series for this wind speeds, possibly associated with the fortnightly tides and
location was shown as the SST example in Fig. 10a (“䊊” with SSTs 51.1–54.8 days earlier than the wind speeds, and pos-
symbols). The location is at the northern edge of the sibly associated with NBC rings.
Guiana Plateau, a prominent feature reaching out from
the coastline. The Guiana Plateau is commonly men- gestive of the role of NBC rings, because for a 1.6-yr
tioned in connection with the shedding of NBC rings, observation period, the characteristic number of days
and this connection is substantiated by all NBC ring between NBC retroflection shedding events was be-
drifter tracks for 10 rings clearly passing through the tween 45 and 55 days, with an average rate of 49.4 days
location (Fratantoni and Richardson 2006). (Ffield 2005). In addition, a high-resolution general cir-
More in-depth analysis of the tropical cyclone wind culation model with variable winds shows that the
speeds and SST at the northern edge of the Guiana North Equatorial Counter Current radiates Rossby
Plateau (7.5°N, 52.5°W) suggests that 53-day earlier waves with a period of 50 days that reflect at the Bra-
SSTs, possibly associated with the shedding of NBC zilian coast, producing NBC rings (Jochum and Malan-
rings, are most significantly related to passing tropical otte-Rizzoli 2003). So perhaps because of the similar
cyclones farther to the north. In this calculation, the timing the processes are related in some (not obvious)
average wind speed for each individual tropical cyclone way to the tropical cyclone wind speeds. Alternatively,
(whereas before all the cyclones for a year were aver- observations from a current meter mooring indicate
aged together) passing through the corridor of histori- that the NBC rings take about 1 month for the leading
cally intensifying tropical cyclones (the 7.9°–25.0°N, and trailing edges to pass across a longitude with an
55.0°–35.0°W block) is determined for the years 1982 average 12.5 km day⫺1 translation speed (Johns et al.
through 2003. For each of the 52 resulting values, the 2003). Therefore, over 53 days a new NBC ring might
infrared satellite-derived SST from 7.5°N, 52.5°W is move 634 km (equivalent to about 6°) northwestward
identified at the same time as each tropical cyclone, and into the more direct path of a westward-moving tropical
as a function of lagged time, for each tropical cyclone. cyclone, where the ring’s cool surface temperature
Linear regressions (not shown) for all the lagged sets of could more directly impact the evolution of the tropical
52 pairs of values are determined. The results (Fig. 12) cyclone on its southern half. However by that time the
reveal the most significant linear regression (r ⫽ 0.48) SST signal of the NBC ring could be masked by a thin
with SSTs that are 51.1 to 54.8 days earlier, such that— layer of warm plume water, possibly explaining why it
as with the annually averaged hurricane season time would be the more southern, earlier, and unadulterated
series—stronger (weaker) tropical cyclone wind speeds SST that shows the strongest linkage to the tropical
are associated with warmer (cooler) SSTs. (The second- cyclone wind speeds. For this reason, simply including
most significant linear regression is with SSTs that are the concurrent “skin-layer” SST field into hurricane
14.6 days earlier, suggestive of fortnightly tides with a prediction models might not be sufficient, as a hidden
14.76-day period, possibly linked to tidal currents re- ring with a few degrees cooler temperatures, over an
sponding to the Guiana Plateau.) The ⬃53 days is sug- area on order of 71 000 to 196 000 km2 just below the15 JANUARY 2007 FFIELD 331
Most importantly, a future study should consider the
size and exact position of the tropical cyclones, distin-
guishing between cases with large (small) diameter
tropical cyclones that may potentially have more (less)
direct contact with the warm Amazon–Orinoco River
plume and any cool-surface NBC rings in their path.
4. Conclusions
The freshwater discharges from the Amazon and
Orinoco Rivers spread into the western equatorial At-
lantic Ocean combining to form an extensive buoyant
plume at the ocean surface with the lowest salinities
and warmest temperatures in the region. The spreading
of the Amazon–Orinoco River plume exhibits a sea-
sonal cycle coinciding with the Atlantic hurricane sea-
son (1 June through 30 November) with river-
influenced minimum salinities observed farthest east-
ward in August during the height of the hurricane
season (mid-August to mid-October). For the 1960 to
FIG. 13. The four-year running Gaussian mean is removed from 2000 time period 68% of all category 5 hurricanes
the 7.5°N, 52.5°W infrared satellite-derived SST time series and passed directly over the historical region of the plume,
the values from 53 days earlier are paired with average tropical
cyclone track wind speed anomaly values from the 7.9°–25.0°N,
revealing that most of the most destructive hurricanes
55.0°–35.0°W region. The scatterplot of the anomaly pairs reveals may be influenced by ocean–atmosphere interaction
that earlier, warm SSTs at the northern edge of the Guiana Pla- with the plume just prior to reaching the Caribbean.
teau are associated with both weak and strong tropical cyclone Average ocean surface temperatures first encountered
wind speeds, but earlier, cool SSTs—possibly from recently shed by tropical cyclones moving westward between 12° and
NBC rings—are almost always (never) associated with weak
(strong) average tropical cyclone wind speeds.
20°N is only 26°C, but upon reaching the northern
reaches of the Amazon–Orinoco River plume, identi-
fied by its river-influenced low salinities, the average
ocean’s surface, with stabilities governed by both tem- ocean surface temperatures encountered by tropical cy-
perature and salinity, might be quickly reexposed with clones are 2°C warmer: 28°C. (These results are from in
the passing of the hurricane. situ data measuring the top few meters of the ocean;
Removing the interannual variability from the time satellite-derived SST values are generally warmer as
series presents an additional perspective to view the they measure the upper-most “skin” of the ocean.) On
data enabling a hypothesis on the impact of SSTs in the average, low salinities persist down to 80 m in the ocean
Amazon–Orinoco region on the evolution of passing and are associated with warmer temperatures up to
tropical cyclones. When the 4-yr Gaussian running ⫹4°C at depth. As warm ocean surface temperatures
mean is removed from the average wind speed for each may play a role in hurricane maintenance and intensi-
individual tropical cyclone passing through the corridor fication, understanding the processes and variability
of historically intensifying tropical cyclones (the 7.9°– controlling the temperatures of the plume may be im-
25.0°N, 55.0°–35.0°W block) and plotted as a function portant. In addition, the buoyant, and therefore stable,
of the 4-yr anomaly 7.5°N, 52.5°W SSTs from 53 days 10- to 60-m-thick layer of the plume can mask other
earlier, it is revealed that earlier, warm SSTs at the ocean processes and features just below the surface, in
northern edge of the Guiana Plateau are associated particular cool (during hurricane season) surface tem-
with both weak and strong tropical cyclone wind peratures carried by NBC rings. After shedding from
speeds, but earlier, cool SSTs—possibly from recently the NBC retroflection, the 300–500-km-diameter anti-
shed NBC rings—are almost always associated with cyclonic (clockwise) NBC rings pass northwestward
weak tropical cyclone wind speeds and never associated through the Amazon–Orinoco River plume toward the
with strong tropical cyclone wind speeds (Fig. 13). This Caribbean. The limited observations reveal that at
result is not robust, as the plot using 51-day earlier SSTs times the cool upper-layer temperatures of the NBC
(not shown) does not show as convincing a relationship rings are exposed to the atmosphere at the sea surface
(three points contradict). However, it does suggest the and at other times they are hidden just underneath
linkages that a more in-depth study might explore. warm plume water. Strong winds from the 300–1000-You can also read


