Amazon's HQ2 Site Selection Criteria: The New 'Gold Standard' in FDI Decision-Making - Cogitatio Press
←
→
Page content transcription
If your browser does not render page correctly, please read the page content below
Urban Planning (ISSN: 2183–7635)
                                                                                  2020, Volume 5, Issue 3, Pages 403–417
                                                                                            DOI: 10.17645/up.v5i3.3207

Article
Amazon’s HQ2 Site Selection Criteria: The New ‘Gold Standard’ in FDI
Decision-Making
Alfried Braumann 1,2
1 Economic Policy and EU-Affairs Executive Department, Vienna Business Agency, 1070 Vienna, Austria;
E-Mail: braumann@wirtschaftsagentur.at
2 Urban and Regional Research, TU Wien, 1040 Vienna, Austria

Submitted: 29 April 2020 | Accepted: 24 July 2020 | Published: 29 September 2020

Abstract
In 2017–2018, Seattle-based Tech behemoth Amazon executed a highly publicised location-finding process for a $5 bil-
lion investment project, dubbed ‘HQ2’. Owing to the combination of high investment volume and the company’s unique
public exposure, the HQ2 process is on course to becoming a basic yardstick for future foreign direct investment (FDI)
projects all over the world. This article compiles the company’s previously unpublished site selection criteria and develops
an evidence-based system of investment decision arguments which is employed to test the currently dominant approaches
in location decision theory—behavioural, neoclassical, and institutional. Our results identify gaps vis-à-vis this emerging
‘Gold Standard’ and we propose the addition of a fourth, project-oriented approach to theory to fill the detected shortcom-
ings. Furthermore, this system equips policymakers with a tool to evaluate their investment attraction strategies based on
the decision criteria extracted from the HQ2 process.

Keywords
Amazon; economic policy; foreign direct investment; HQ2; impact assessment; local economic development; location
decision; policy; urban development

Issue
This article is part of the issue “Planning for Local Economic Development: Research into Policymaking and Practice” edited
by Godwin Arku (University of Western Ontario, Canada) and Evan Cleave (Ryerson University, Canada)

© 2020 by the author; licensee Cogitatio (Lisbon, Portugal). This article is licensed under a Creative Commons Attribu-
tion 4.0 International License (CC BY).

1. Introduction                                                   velopment. Cities and regions that want to attract busi-
                                                                  ness investments from the tech-sector will have to deal
In a market-based economy, local economic develop-                with similar requests from potential investors.
ment depends on the potential to attract business invest-             Trying to add value to both research in location the-
ments from within or abroad. Location theory offers a             ory and local economic development practice, our cen-
way to describe and formalize this potential by propos-           tral research questions aim to extract and analyse this
ing a set of criteria, or ‘location factors’: They are where      project’s decision criteria: What were the decision crite-
place-based policies meet investors’ interests, where lo-         ria applied in the location-finding process of Amazon’s
cation theory meets business practice. This article will fo-      HQ2? How do they align with recent scholarly discus-
cus on those criteria.                                            sion? And what can policymaking learn from it?
    We base our analysis on one of the global tech-                   By answering these questions, we detect and address
nology sector’s largest and best-documented invest-               existing gaps in the literature on location decision the-
ment projects of the late 2010s, US e-commerce giant              ory and offer a tool to identify gaps in individual re-
Amazon’s quest for a location for its second headquar-            gions’ policy setup. First, we provide a literature review
ters (henceforth referred to as HQ2). Following Liu and           of location decision theory. Then we present the project
Muro (2017), we interpret this project as a signal of what        ‘Amazon HQ2,’ including a critical discussion. Next, we
investors consider state-of-the-art in urban economic de-         discuss in detail the criteria applied throughout the pro-

Urban Planning, 2020, Volume 5, Issue 3, Pages 403–417                                                                  403
cess. We develop a simple quantitative model that al-          shaped by society’s cultural institutions and value sys-
lows us to relate this process with location decision the-     tems. They accentuated the social and cultural context—
ory on a question-by-question basis. We use the results        institutions—in which behaviour is embedded over ob-
to comment on current literature and propose a concep-         jective decision-making (Ferreira et al., 2016, p. 988).
tual extension to fill the gaps detected. Policymakers are         Storper and Scott’s (2009) work on the causes of ur-
equipped with a tool to evaluate their investment attrac-      ban growth argues for the importance of locally agglom-
tion strategies based on the dataset we extracted.             erated systems of production and work. Glaeser (2005)
                                                               recommends that policymakers focus on education in-
2. Literature Review                                           vestment, low tax rates, crime reduction, and new hous-
                                                               ing development. Clark, Lloyd, Wong, and Jain (2002)
Discussion around the optimal location of business activ-      stress the importance of facilities that provide distraction
ities has a long history: Von Thünen (1826) delivered a        and amusement, while Florida (2004) advocates building
seminal work arguing for the importance of factor dis-         “diverse, tolerant communities.” Schmenner (1982) de-
tance to the definition of rent levels. Marshall (1890)        rives corporate location decisions from microdata. Bartik
pioneered the concept of industrial districts, a corner-       (2019) analyses the competition between local and re-
stone of regional economics. The first to explicitly intro-    gional governments in the USA with regard to incen-
duce and cluster location factors into theory was Weber        tives and offers propositions for policymakers on how
(1909). Focused on the potential of minimising costs, he       to deal with this situation. Important works based on
established the cost of transport, the cost of labour and      Hayter’s clustering include Arauzo-Carod, Liviano-Solis,
(positive) costs of economic agglomeration as driving          and Manjón-Antolín (2010), Brouwer, Mariotti, and van
forces behind economic specialisation. Christaller (1933)      Ommeren (2004) or Ferreira et al. (2016). Our analysis
built on this approach, deriving a concept for spatial hi-     follows Ferreira et al. (2016), who attribute 29 location
erarchy of locations and economic activities. The rela-        factors to Hayter’s three approaches (Table 1).
tionship between different locations was formalised by
Lösch (1944). Starting in the 1960s, several researchers       3. Amazon’s Quest: A Project Set to Become the ‘Gold
tried to consolidate location theory, including Böventer       Standard’ in Investment Location Decision
(1962) and Alonso (1964). However, no single dominant
paradigm has evolved over the last decades (Pellenbarg,        3.1. From Zero to Hero
van Wissen, & van Dijk, 2002).
     Hayter (1997) clustered competing strands of loca-        Much has been written about a company that has be-
tion theories into three approaches: behavioural, neo-         come a household name around the world: Amazon.com,
classical, and institutional. The neoclassical approach is     Inc. The venture that started in Seattle in the middle
based on explicit strategies to reduce costs and maximize      of the 1990s as an online bookstore, diversified over
profits. In integrating categories such as transport costs,    two decades into e-commerce, cloud computing, digi-
labour costs, or external economies, the neoclassical ap-      tal streaming, and artificial intelligence (Noe & Weber,
proach is heavily indebted to Weber (1909). Aiming to          2019). By the late 2010s, little more than 20 years af-
understand and define the ‘optimal’ behaviour of agents        ter its website was launched on July 16, 1995, Amazon
in economic terms, it is based on concepts of rational-        was one of the biggest companies worldwide (Figure 1).
ity and perfect information. The behavioural approach is       Total revenues in 2017 were reported as $178 billion and
situation-sensitive and embraces possibility. It does not      a gross profit of $65,9 billion; its employment rolls have
depart from the concept of perfect information, but its        expanded from 33,700 in 2010 to 566,000 in 2017, and all
agents usually have to tackle a situation defined by lack      these indicators were predicted to approximately double
of information or asymmetrical information. In this per-       by 2020 (Macrotrends, 2020). Against this backdrop, in
spective, factors of location are not uniform and differ be-   September 2017 the company launched the project that
tween locations (Arauzo & Manjón, 2004). However, deci-        would establish HQ2.
sions are based on non-economic factors. This approach
gives special importance to the person in charge of the        3.2. Request for Proposals
(location) decision—usually the entrepreneur (Ferreira,
Fernandes, Raposo, Thurik, & Faria, 2016, p. 988). The         On September 7, 2017, Amazon published an eight-page
neoclassical and the behavioural approach have one view        request for proposals (RFP; Amazon, 2017). It invited
in common: Companies choose actively from a number             cities and states in North America to come up with
of alternatives in an environment that is basically static—    proposals for a suitable site to host a major invest-
a surface of location factors, or a ‘bed of information’       ment project:
that is processed by the firm (Hayter, 1997). From the
1980s onward, this rather mechanical view of locational           The Project is a second corporate headquarters (HQ2),
behaviour was increasingly being questioned. A variety            at which Amazon will hire as many as fifty thousand
of strands in research converged on the common be-                (50,000) new full-time employees with an average an-
lief that economic processes in space are predominantly           nual total compensation exceeding one hundred thou-

Urban Planning, 2020, Volume 5, Issue 3, Pages 403–417                                                                 404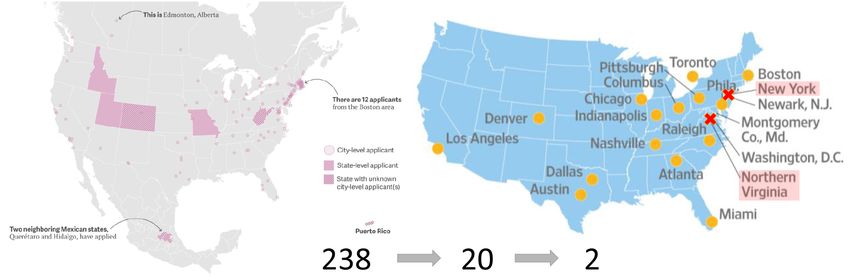
Table 1. Approaches to company location.
Behaviour (B)                              Neoclassical (N)                        Institutional (I)
B1. The founder, managers and              N10. Distance between the company       I22. Company incubator
employees want to live in this             and urban centres
                                                                                   I23. Access to knowledge generated
location
                                           N11. Distance to markets and the        by universities or research centres
B2. Proximity to the founder’s             cluster scale
                                                                                   I24. Location close to administrative
residence
                                           N12. Road infrastructures               centres
B3. Climate
                                           N13. Geographic specialisation          I25. Access to science parks
B4. Good housing standards
                                           N14. Human resource skills and          I26. R&D incentives, employment
B5. Local community attitude to            qualifications                          creation or other incentives
business
                                           N15. Industrial real estate costs       I27. Proximity to teaching institutions
B6. Recreational and leisure activities
                                           N16. Costs of labour                    I28. Technological fairs
B7. The founder was born in the
                                           N17. Population density                 I29. Renowned business leaders in
community
                                                                                   the region
                                           N18. Level of local economic activity
B8. Good means of access
                                           in the company location
B9. Entrepreneur financial capacity
                                           N19. Other physical infrastructures
                                           (railroads, airports,
                                           telecommunications, etc.)
                                           N20. Proximity to raw materials
                                           N21. Proximity to services
Source: Ferreira et al. (2016, p. 989).

Figure 1. Timeline of Amazon’s corporate development 1994/1995–2019. Source: “Can Amazon keep growing like a youth-
ful startup?” (2020, p. 15).

Urban Planning, 2020, Volume 5, Issue 3, Pages 403–417                                                                 405
sand dollars ($100,000) over the next ten to fifteen proposal for a Long Island site would gain special notori-
years, following commencement of operations. The ety later in the process.
Project is expected to have over $5 billion in capital
expenditures. (Amazon, 2017, p. 2) 3.3. A Shortlist of 20 Cities
After providing more technical and financial details on On January 8, 2018, Amazon sent out a press release
the project, the RFP finished with the following appeal (shown in Figure 3) communicating a shortlist of the
to US cities: 20 cities it intended to continue the selection pro-
cess with:
As this is a competitive Project, Amazon welcomes the
opportunity to engage with you in the creation of an Amazon evaluated each of the proposals based on the
incentive package, real estate opportunities, and cost criteria outlined in the RFP to create the list of 20 HQ2
structure to encourage the company’s location of the candidates that will continue in the selection process.
Project in your state/province. (Amazon, 2017, p. 7) In the coming months, Amazon will work with each of
the candidate locations to dive deeper into their pro-
So the game was on. Complying with the tight six-week- posals, request additional information, and evaluate
deadline set for October 19, 2017, the request resulted the feasibility of a future partnership that can accom-
in responses from 238 locations. Most proposals were modate the company’s hiring plans as well as benefit
of the type “glossy marketing pitches, with slick graph- its employees and the local community. Amazon ex-
ics and broad proposals for why Amazon should come to pects to make a decision in 2018. (Amazon, 2018a)
their regions” (Weise, 2018a). A dedicated open-source
project collects and presents these proposals, accessible The shortlist reveals two broad clusters of places: larger,
for those who are interested to dig deeper into the enor- more expensive coastal tech hubs and smaller, more
mous efforts that competing governments poured into affordable regional business centres in the middle of
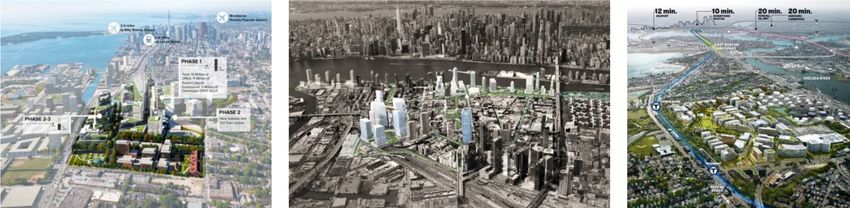
replying to this short invitation (reflect.io, 2020). Figure 2 the country (Parilla, 2018a). What exactly led the com-
shows three renderings of the proposed sites. New York’s pany to select these 20 cities is not known, thus en-
Figure 2. Examples of renderings of proposed sites. From left to right: Toronto (Toronto Global, 2017, p. 11), New York
(New York Metro Area, 2018, p. 72), Boston (City of Boston, 2017, pp. 63–64).
Figure 3. From left to right: Map of the 238 places that bid in the first round for Amazon’s next headquarters and Amazon’s
selection of 20 places for further negotiations with New York and Arlington, Virginia highlighted. Source: Authors’ own
processing based on Griswold (2017) and Stevens (2018).
Urban Planning, 2020, Volume 5, Issue 3, Pages 403–417 406gendering speculation. No regulation obliged the com- proved Amazon’s proposal for the construction of two
pany to make its reasons for any decision transparent to HQ2 towers in December 2019. Construction subse-
the public. quently started in early 2020 and is expected to be com-
pleted in 2023 (Graf & Salazar, 2019).
3.4. Request for Information
3.7. Critical Discussion of the HQ2 Process
After announcing the shortlist in January 2018, Amazon
presented the 20 candidate cities with a 29-page Request Much scholarly attention has been attributed to the
for Information (RFI) that was kept confidential by all shifting power balance between location and investor:
sides. Answering it “required far more precision and was Brenner and Theodore (2002) put an early focus on
more about practicalities than flash. It asked cities to re- the interplay between regulation and market-oriented
spond by early March with a huge text document punc- projects from a spatio-political perspective. Carr and
tuated only with a few maps” (Weise, 2018b). The de- Hesse (2020) analyse urban governance in the context of
tails of most proposals were therefore kept secret—as the ‘smart-city’ concept. Ioannou, Nicolaou, Serraos, and
was any information about the various incentives that Spiliopoulou (2019) highlight the interconnectedness of
were offered to Amazon. Probably by accident, New large urban developments, foreign direct investment,
York’s 253-page response to the RFI, code-named Project and a shifting power balance in urban development.
Clancy, was made public. Although the city administra- Othengrafen and Levin-Keitel (2019, p. 120) cluster
tion was quick to delete the document, it is still avail- the different roles of planners, and Cleave, Arku, and
able online (City of New York, 2018). We reconstructed Chatwin (2019) analyse the work of private sector con-
the original 29-page RFI from this proposal. It is available sultants in place-based economic development strate-
online as supplementary material to this article and con- gies: City representatives take on reactive or moderat-
stitutes, together with the original RFP, the basis of our ing roles. When those actors are confronted with a ‘task-
analysis of Amazon’s location decision criteria. able’ inquiry of the type Amazon presented, they tend to
show a tendency to comply which results in public insti-
3.5. Deciding on Two Cities tutions ceding the driving seat in urban planning to pri-
vate companies.
In November 2018, after concluding negotiations with Throughout the whole process of HQ2, Amazon sub-
the 20 cities on its shortlist, Amazon announced it would mitted its counterparts to extremely tight deadlines
open not one, but two new headquarters: (Figure 4). Parilla (2018b) interprets the six-week dead-
line as a stress test for local communities that would:
Amazon (NASDAQ: AMZN) today announced that it
has selected New York City and Arlington, Virginia, as Test which places could activate their institutional
the locations for the company’s new headquarters. networks to respond with speed and comprehensive-
Amazon will invest $5 billion and create more than ness.…The quick turnaround has limited the time and
50,000 jobs across the two new headquarters loca- space for public reflection and vetting of the bid.
tions, with more than 25,000 employees each in New Public transparency has been severely lacking in the
York City and Arlington. The new locations will join process, and the 20 shortlisted cities have all signed
Seattle as the company’s three headquarters in North non-disclosure agreements.
America. (Amazon, 2018b)
This view corresponds with Cleave et al.’s (2019) analysis
3.6. Leaving New York of how city representatives react to ‘taskable’ inquiries.
Others such as Florida (2018) and Gupta (2019) interpret
An intense debate took off when the agreement be- HQ2 primarily as an exercise in setting up a comprehen-
tween New York and Amazon was made public. After sive database on investment opportunities and frame-
three months of public discussions focussing on the use works in American cities.
of public subsidies, gentrification, and the rising cost of Public subsidies represent another specific arena for
living, Amazon cancelled its plans for HQ2 in New York. the power play between cities and private companies.
This decision was interpreted as a blow to the efforts of Depending on the estimate, annual expenditure from
diversifying the city’s economy by making it an inviting US local and state governments on incentives ranges be-
location for the technology industry (Goodman, 2019). tween $45 and $80 billion, depending on the estimate
However, Amazon did not completely turn away from the (Parilla, 2018b). The Website Citylab published a report
city: In December 2019, less than a year after cancelling on what cities actually offered Amazon, with incentive
its HQ2 investment there, the company announced the packages from local and state governments in Maryland
opening of a new, 1,500-employee office in Manhattan and New Jersey reaching up to $7 billion (Holder, 2018).
(Eugene, 2019). This sum is even more impressive when compared to the
The proposed investment in Arlington, Virginia went ‘merely’ $5 billion that the company was offering to in-
ahead as planned: Arlington County unanimously ap- vest over 15 to 17 years. Bartik (2019) advises policymak-
Urban Planning, 2020, Volume 5, Issue 3, Pages 403–417 4072017 2018 2019
September 7, 2017: End of March 2018: February 14, 2019:
RFP published probable deadline RFI investment in New York
cancelled
October 16, 2017: January 8, 2018:
deadline RFP 20 cies selected, November 13, 2018: New York and
RFI transmied Arlington, Virgina presented as
future investment desnaons
Figure 4. Timeline of the HQ2 decision process.
ers on how to deal with competition among local and re- strong focus on the description of the planned project.
gional governments when offering incentives. We reconstructed the originally 29-page long RFI from
a confidential document titled Project Clancy (City of
4. Decision Criteria Laid Out by Amazon New York, 2018).
We use a mixed-method qualitative content analysis
In this section, we briefly present documents and de- approach proposed by Mayring (2014) for the analysis of
cision criteria that potential investment locations were the two documents. This method is based on the assign-
confronted with by Amazon in the course of the HQ2 ment of categories to the text as a qualitative step, work-
process. Our hypothesis is that these criteria will, due ing through many text passages and the analysis of fre-
to Amazon’s global status as an example to follow, be- quencies of categories as a quantitative step (Mayring,
come standard among investment projects over the com- 2014, p. 10). For the execution of these tasks, we re-
ing years. This view is supported by a blog post for the ferred to QCAmap developed by Letz (2020), an open-
Harvard Business Review by Amy Liu and Mark Muro access web application for systematic text analysis in
from Brookings Institution: scientific projects based on the techniques of qualita-
tive content analysis. Fenzl and Mayring (2017) present
Amazon’s selection criteria, as described in the com- the application in detail. Using QCAmap, we extracted
pany’s request for proposal, sets out a compelling list a numbered total of 794 items from the two docu-
of the attributes cities must have if they aspire to be ments. Items that are of topic-setting quality (e.g., #219:
a serious part of the America’s growing digital econ- Describe the largest social challenges your community
omy.…Amazon is also signalling very clearly and pub- is facing) are defined as ‘question,’ while items that re-
licly what the market demands for modern, state-of- fer to content that depends on those questions are de-
the-urban economic development going forward. (Liu fined as ‘sub-question’ (e.g., #220: Describe success mea-
& Muro, 2017) sures for current and proposed programs). The complete
dataset is available online as supplementary material to
4.1. Methodology this publication. Table 2 provides an overview of the
two documents.
We will base our analysis on two documents prepared
by Amazon in the course of the HQ2 location decision: 4.2. Request for Proposals
the widely shared RFP (Amazon, 2017) and the confiden-
tial RFI (see supplementary material). The RFP is a rela- This is the principal document published on September 7,
tively short document of eight pages that still exhibits a 2017 (Amazon, 2017). Over eight pages it describes the
Table 2. Quantitative dimensions of documents RFP and RFI.
Document/Section Items Extracted Page Count
Total # # Questions # Sub-Questions Original document RFP/RFI/section of RFI
RFI total 607 236 371 29 253
1 Talent 139 65 74 n.n. 74
2 Growth 102 46 56 n.n. 36
3 Real Estate 255 103 152 n.n. 105
4 Taxes and Tax Policy 43 11 32 n.n. 14
5 Incentives 68 11 57 n.n. 24
RFP total 187 91 96 8 29
Total RFP+RFI 794 327 467 37 n.n.
Urban Planning, 2020, Volume 5, Issue 3, Pages 403–417 408company and provides basic details on its HQ2 project. It approaches the topic from both a rather individual
A special focus is dedicated to the requirements for the perspective (#156–16: Current Housing Stock [availabil-
future site, to specific characteristics of the metropoli- ity, mix of rental versus owned, granular details on a few
tan area where it shall be located, as well as the spe- example neighbourhoods if available, focus on [i] 3 bed-
cific conditions of the labour market for tech workers. room, 2 bath, single-family homes and [ii] 1 and 2 bed-
Questions and comments are mostly general in nature room apartments]) as well as from a macro-perspective
(#723: The Project requires an expeditious timetable for (#191: Data on hate crimes). Approaches to policymak-
the location decision and the commencement of con- ing (#241: Describe what your community has done to
struction; or #738: We want to invest in a community encourage STEM professional development in your im-
where our employees will enjoy living, recreational op- migrating and minority populations) are also important.
portunities, educational opportunities, and an overall
high quality of life), although some ask for detailed in- 4.3.3. Real Estate
formation (#736: We encourage testimonials from other
large companies). The section on real estate is the central piece of the
RFI. A total of 255 items were identified (103 questions,
4.3. Request for Information 152 sub-questions), representing 42% of all 607 items.
Furthermore, these questions are expected to be an-
The RFI (see supplementary material) was sent out by swered independently for every site proposed—in the
Amazon to the 20 locations selected in the first round. It case of New York for two sites (Long Island and Midtown
collected data and preliminary commitments from those West), covering a total page-count of 105 pages. The
locations, which would later serve as a basis for negotia- questions cover a wide range of topics associated with
tions. Locations were expected to reply to this document the proposed sites—location, infrastructure, availability,
within approximately ten weeks (Weise, 2018b). The RFI neighbourhood, accessibility, usability, topography, utili-
was organized in five sections. We extracted a total of ties, as well as the costs associated with all of these. The
607 items (236 questions, 371 sub-questions) from the company openly addresses incentives (#277: Will a gov-
document. Figure 5 gives a visual impression of the key- ernment agency make Site available to the Project at no
words used in the different sections. cost?). A special focus is put on practicalities such as data
on the reliability of existing infrastructure, ways to define
4.3.1. Talent commitment of public institutions, possibilities of future
extensions and several questions on the timeline of ex-
The first section of the RFI is dedicated to the labour pected interventions. The questions even become per-
market, education (with a focus on STEM), population sonal, asking for names, contact details, and term lim-
composition and development (with a focus on migra- its of officials and personnel in charge of individual tasks
tion and integration), as well as an ample field of policies. (#359: The person assigned to work with the Project; and
Questions are very detailed (#93: A comparison between #360: The relevant contact information for that person).
annual objectives and actual performance for each stu-
dent group) and frequently ask for both historical data 4.3.4. Taxes and Tax Policy
(#6: Changes in education level in your community over
the last five years) as well as information on or plans for The short section on Taxes (14 pages, 43 items) asks
future policies (#82: Describe how education programs for general information on the location’s tax regime. It
are funded). It covers 74 of Project Clancy’s 253 pages presents several individual cases, for which the tax bur-
(29%), its second-largest section. den should be calculated (#538: Describe in detail the
typical State/Commonwealth/Province and local tax bur-
4.3.2. Growth den that a company worker might anticipate if HQ2 were
built on Site and the worker lived in your community.
The second section is dedicated to general development Assume the worker earns $100,000 annually, excluding
issues, with a strong focus on housing and quality of life. benefits). Most questions relate, directly or indirectly, to
Figure 5. Word clouds of RFI’s 607 items, by section. From left to right: talent, growth, site, taxes and tax policy, incentives.
Urban Planning, 2020, Volume 5, Issue 3, Pages 403–417 409the possibility of reducing the existing tax burden. The Similar to the section on real estate, some questions
future development of the tax regime is also targeted become personal (#606: Project manager/ombudsman
(#539: Detail any State/Commonwealth/Province tax leg- to coordinate/expedite approvals).
islation that has been proposed).
5. Analysis
4.3.5. Incentives
In order to relate the documents to scholarly discus-
The final section is very forthcoming on the topic of in- sion, we submitted the 794 items to a further process of
centives, asking for detailed information (and commit- coding following the methodology proposed by Mayring
ment) on a wide range of possible incentives, even “of- (2014). We tried to relate all items to the 29 location fac-
fered by the State/Commonwealth/Province and Local tors proposed by Ferreira et al. (2016, p. 989). This re-
Community” (#540–541, 547: Detail each incentive by sulted in the attribution of one or more factors to a to-
real estate site. If the incentive is uncertain or is not guar- tal of 566 items (71,3% ‘attribution rate’). No meaning-
anteed, an explanation of the factors that contribute to ful attribution was possible for 228 items (28,7% ‘non-
that uncertainty and an estimate of the level of certainty). attribution rate’). Figure 6 lists the results by factor,
4 Taxes
3 Real 5
RFP+RFI RFP RFI 1 Talent 2 Growth and Tax
Estate Incentives
Policy
Factors \ number of items 794 187 607 139 102 255 43 68
Behaviour 183 (23%) 44 (23,5%) 139 (22,9%) 20 (14,4%) 64 (62,7%) 47 (18,4%) 7 (16,3%) 1 (1,5%)
B1: The founder, managers and employees
46 (5,8%) 16 (8,6%) 30 (4,9%) 3 (2,2%) 23 (22,5%) - 4 (9,3%) -
want to live in this locaon
B2: Proximity to the founder’s residence 2 (0,3%) 2 (1,1%) - - - - - -
B3: Climate - - - - - - - -
B4: Good housing standards 42 (5,3%) 4 (2,1%) 38 (6,3%) 1 (0,7%) 36 (35,3%) 1 (0,4%) - -
B5: Local community atude to business 33 (4,2%) 9 (4,8%) 24 (4,0%) 16 (11,5%) 5 (4,9%) - 3 (7,0%) -
B6: Recreaonal and leisure acvies 33 (4,2%) 6 (3,2%) 27 (4,4%) - 20 (19,6%) 7 (2,7%) - -
B7: The founder was born in the community - - - - - - - -
B8: Good means of access 50 (6,3%) 10 (5,3%) 40 (6,6%) - - 39 (15,3%) - 1 (1,5%)
B9. Entrepreneur financial capacity 10 (1,3%) 5 (2,7%) 5 (0,8%) 5 (3,6%) - - - -
Neoclassical 403 (50,8%) 92 (49,2%) 311 (51,2%) 108 (77,7%) 26 (25,5%) 144 (56,5%) 3 (7%) 30 (44,1%)
N10. Distance between the company and
19 (2,4%) 11 (5,9%) 8 (1,3%) - 1 (1%) 7 (2,7%) - -
urban centres
N11. Distance to markets and the cluster scale 9 (1,1%) 6 (3,2%) 3 (0,5%) 3 (2,2%) - - - -
N12. Road infrastructures 20 (2,5%) 14 (7,5%) 6 (1%) - - 6 (2,4%) - -
N13. Geographic specialisaon 48 (6,0%) 4 (2,1%) 44 (7,2%) 41 (29,5%) 1 (1%) 2 (0,8%) - -
N14. Human resource skills and qualificaons 130 (16,4%) 27 (14,4%) 103 (17%) 87 (62,6%) 6 (5,9%) 4 (1,6%) - 6 (8,8%)
N15. Industrial real estate costs 108 (13,6%) 29 (15,5%) 79 (13%) - 1 (1,0%) 51 (20%) 3 (7,0%) 24 (35,3%)
N16. Costs of labour 11 (1,4%) 9 (4,8%) 2 (0,3%) - 2 (2,0%) - - -
N17. Populaon density 19 (2,4%) 2 (1,1%) 17 (2,8%) 11 (7,9%) 6 (5,9%) - - -
N18. Level of local economic acvity in the
25 (3,1%) 5 (2,7%) 20 (3,3%) 19 (13,7%) - 1 (0,4%) - -
company locaon
N19. Other physical infrastructures (railroads,
126 (15,9%) 24 (12,8%) 102 (16,8%) - 1 (1,0%) 96 (37,6%) - 5 (7,4%)
airports, telecommunicaons, etc.)
N20. Proximity to raw materials - - - - - - - -
N21. Proximity to services 21 (2,6%) 4 (2,1%) 17 (2,8%) - 10 (9,8%) 7 (2,7%) - -
Institutional 195 (24,6%) 39 (20,9%) 156 (25,7%) 64 (46%) 7 (6,9%) 8 (3,1%) 9 (20,9%) 68 (100%)
I22. Company incubator 5 (0,6%) - 5 (0,8%) 5 (3,6%) - - - -
I23. Access to knowledge generated by
47 (5,9%) 10 (5,3%) 37 (6,1%) 34 (24,5%) - 1 (0,4%) - 2 (2,9%)
universies or research centres
I24. Locaon close to administrave centres 2 (0,3%) 1 (0,5%) 1 (0,2%) - - 1 (0,4%) - -
I25. Access to science parks 9 (1,1%) 1 (0,5%) 8 (1,3%) 3 (2,2%) 1 (1,0%) 3 (1,2%) - 1 (1,5%)
I26. R&D incenves, employment creaon or
110 (13,9%) 26 (13,9%) 84 (13,8%) 2 (1,4%) 2 (2%) 3 (1,2%) 9 (20,9%) 68 (100%)
other incenves
I27. Proximity to teaching instuons 50 (6,3%) 5 (2,7%) 45 (7,4%) 42 (30,2%) 1 (1%) 2 (0,8%) - -
I28. Technological fairs 5 (0,6%) 1 (0,5%) 4 (0,7%) 2 (1,4%) - 2 (0,8%) - -
I29. Renowned business leaders in the region 15 (1,9%) 2 (1,1%) 13 (2,1%) 10 (7,2%) 3 (2,9%) - - -
items without factor attribution 228 (28,7%) 42 (22,5%) 186 (30,6%) 25 (18,0%) 27 (26,5%) 106 (41,6%) 28 (65,1%) -
Figure 6. Analysis of location factors attributed to Amazon’s HQ2 location decision process.
Urban Planning, 2020, Volume 5, Issue 3, Pages 403–417 410approach, and document. The first column shows the 5.1. Finding I: Location Factors that Stood the HQ2-Test
29 criteria, grouped by the three respective approaches:
behavioural, neoclassical and institutional. The second Figure 7 ranks the 29 factors by attribution rate. Four
columns exhibit the results of our analysis, grouped by factors (N14. Human resource; N19. Infrastructure;
document(s) or sub-documents. Each cell shows the sum I26. Incentives; and N15. Real Estate costs) are visibly set
of items in the respective document that could be at- apart. Of these four, three stem from the neoclassical
tributed to the respective factor or approach, followed approach of location decision theory, one from the be-
by the percentage of total items in the respective docu- havioural approach.
ment in brackets. Cells with a percentage of over 10% are An interesting opposition can be seen when it comes
shaded green, cells with a percentage under 2% red. to the labour market. Whilst availability and qualifica-
These results provide us with ample material to dis- tion (N14) rank first among factors, their cost (N16)
cuss the practical relevance of those individual factors de- is ranked low with markedly reduced attribution rate
veloped by location decision theory. In our analysis, we (16,4% vs. 1,4%). This points to the fact that, in the dense
will concentrate on three specific findings: factors that labour market for tech talent, availability trumps cost.
were (1) widely applied in the course of HQ2; (2) factors
that were not or were only sporadically used; we also use 5.2. Finding II: Some Location Factors Have Been Widely
it as a basis to (3) contribute to the discussion about the Ignored
competing approaches in theory (behavioural, neoclas-
sical, institutional). Furthermore, we base two proposi- Three factors (B3. Climate; B7. Place where founder was
tions on these results: (1) We put forward a new group born; and N20. Raw Materials) are missing completely
of factors that should be integrated into location decision from Amazon’s set of questions. The non-attribution of
theory as a fourth approach and (2) we provide policy- N20 can be explained by the sector the company is op-
makers with a simple tool to evaluate and discuss their erating in—raw materials are not relevant to its head-
investment promotion strategies. quarters’ business processes. Also, the absence of B7
Abuon Rate of 29 Locaon Factors
Figure 7. Location factors ranked by attribution rate.
Urban Planning, 2020, Volume 5, Issue 3, Pages 403–417 411seems to have an obvious explanation: A company with tribution rate does not vary significantly among the two
a staff count slowly edging up to reach one million can documents, RFP and RFI.
be expected to be too big to base important decisions This result is noteworthy, especially for practitioners
on where its founder was born. However, there has in investment attraction. Although the criteria employed
been ample speculation about the implicit relevance of in the context of HQ2 do include ‘soft’ factors such as
this factor throughout the HQ2 process (Dement, 2018; quality of life, environmental quality, culture, or career
Nickelsburg, 2018). Less obvious is the absence of the opportunities, it is still the rationalist, objective neoclas-
third factor, B3 Climate. Recent discussions, especially sical approach which has been applied most extensively.
under the headline topic of sunbelt city development
(especially Glaeser, 2005) attribute high importance to 5.4. Finding IV: Detecting the Blind Spots
this factor. Future research around the importance of cli-
matic factors on business location decisions thus might Table 3 looks at factor attribution from a different an-
put more emphasis on the integration of empirical evi- gle: it shows in how far items from different documents
dence from individual decision processes. and their sections could not be attributed to any one of
the 29 location factors proposed by Ferreira et al. (2016).
5.3. Finding III: Neoclassical Wins the Approaches’ This is the case for a total of 228 out of 794 items, or
Contest 28,7%. The non-attribution rate is slightly lower for RFP
(22,5%), while the longer and more detailed RFI exhibits
We presented the historical development of location de- a non-attribution rate of 30,6%. Among the document’s
cision theory over the last two centuries that led to the parts, section 5 (Incentives) stands out with all items at-
currently dominant framework of combining the three tributed. On the other side of the spectrum, sections 3
competing approaches: behavioural, institutional, and (Real Estate) and 4 (Taxes and Tax Policy) also stand out
neoclassical. In our analysis, the neoclassical approach is with almost every second item not attributed (41,6% and
by far the most frequently employed by Amazon: More 65,1%, respectively). These findings give us a basis to de-
than 50% of all items can be attributed to at least one rive location decision factors that are missing in Ferreira
of this approach’s eleven factors (Figure 8). The other et al. (2016).
two approaches, behavioural and institutional, trail far As a next step, we ran an additional coding exercise
behind with an attribution rate of less than 25%. The at- for the 228 items not attributed to any single location
Abuon Rate, by Approach and Document
50,8%
Neoclassical 51,2%
49,2%
all items (n = 794)
24,6%
Instuonal 25,7% RFI (n = 607)
20,9%
RFP (n = 187)
23,0%
Behavioural 22,9%
23,5%
Figure 8. Attribution rate of different approaches.
Table 3. Non-attribution rates by document and section.
Document/Section Total # # Items Not Attributed Non-attribution Rate
RFI total 607 186 30,6%
of which
1 Talent 139 25 18,0%
2 Growth 102 27 26,5%
3 Real Estate 255 106 41,6%
4 Taxes and Tax Policy 43 28 65,1%
5 Incentives 68 0 0,0%
RFP total 187 42 22,5%
Total RFP+RFI 794 228 28,7%
Urban Planning, 2020, Volume 5, Issue 3, Pages 403–417 412factor: they were tested for several additional criteria as neighbourhood, infrastructure, etc. Based on these re-
shown in the left column of Figure 9. These ten additional sults, we propose formalizing it as an individual factor.
criteria were derived from (1) a clustering exercise of se- As to the difficulty of applying a common theo-
lected items (colour-coded items in the column ‘marked retical framework onto heterogeneous site conditions,
text’ in our dataset, available online as supplementary we suggest following the approach developed by Serra,
material to this publication) and (2) factors inspired by Psarra, and O’Brien (2018), who developed an inter-
literature (Clark et al., 2002; Florida, 2004; Glaeser, 2005; esting method to quantify defining aspects of develop-
Schmenner, 1982; Storper & Scott, 2009). The aim was to ment sites.
establish factors that would explain as many of the non-
attributed questions as possible. Figure 9 shows the attri- 5.5.2. Project-Management Related Criteria
butions that we obtained through this additional coding
exercise. Cells with an attribution rate of 25% or higher Our analysis showed that basic concepts of project man-
are shaded in green, cells with a rate below 10% are agement cannot be adequately attributed by Hayter’s
shaded in red. We will use these results to propose an three-pronged approach. This resulted in the non-
extension to theory. attribution of items related with aspects of project man-
agement such as the project’s timeline, the attribution
5.5. Proposition I: Extend Location Decision Theory by of responsibilities, the actual availability of resources in
Integrating a Fourth, Project-Oriented Approach a given moment, and the potential of a phased develop-
ment approach including the possibility of future exten-
Based on our results, we propose an extension of sions. Testing for these concepts (in the form of two addi-
the existing, three-dimensional paradigm: The three ap- tional criteria, T and R, see Figure 9) resulted in positive
proaches (behavioural, neoclassical, and institutional) attributions (25.0% and 18.4%, respectively). Building
should be broadened by a fourth approach in order to on Schmenner (1982) and Mesly (2017), we, therefore,
be able to include the gaps we detected. We term this propose the integration of the following additional deci-
approach ‘Project-Oriented.’ Individual factors that con- sion factors:
stitute this novel approach are described below.
• Possibility of phased development and future ex-
5.5.1. Site-Related Criteria tensions of the project
• Availability and accessibility of existing resources
Every communication during the HQ2 process put a fo- for the execution of the project
cus on the desired characteristics of available investment • Ability to comply with project timeline
sites. The 29 factors from Ferreira et al. (2016) are not • Actors carrying responsibility (individual, institu-
able to adequately account for this importance. When tional) and their commitment to the project
testing the 228 non-attributed items, the new criteria C:
characteristics of proposed site, was able to account for Table 4 sums up our proposal for an extended system of
42% of all items, including questions related to terrain, location decision approaches and related factors.
4 Taxes
3 Real 5
RFP+RFI RFP RFI 1 Talent 2 Growth and Tax
Estate Incentives
Policy
proposed new factors \ items not attributed 228 42 186 25 27 106 28 0
C: Characteriscs of proposed site 95 (41,7%) 24 (57,1%) 71 (38,2%) - - 71 (67%) - -
T: Timeline; actual availability of resources and
57 (25%) 17 (40,5%) 40 (21,5%) 1 (4%) - 39 (36,8%) - -
future extensions
P: Policies and Programs 43 (18,9%) 2 (4,8%) 41 (22%) 10 (40%) 15 (55,6%) 15 (14,2%) 1 (3,6%) -
R: Responsible actors (instuonal, personal);
ownership structure and their commitment for 42 (18,4%) 3 (7,1%) 39 (21%) - - 34 (32,1%) 5 (17,9%) -
the investment project
S: Sustainability / Environment and
31 (13,6%) 6 (14,3%) 25 (13,4%) - 3 (11,1%) 22 (20,8%) - -
environmental commitment of government
X: Taxes 29 (12,7%) 1 (2,4%) 28 (15,1%) - - - 28 (100%) -
E: Evaluaons, Studies; (internaonal) rankings 25 (11%) - 25 (13,4%) 8 (32%) 10 (37%) 7 (6,6%) - -
G: Grand challenges, big ideas 20 (8,8%) 6 (14,3%) 14 (7,5%) 5 (20%) 7 (25,9%) 2 (1,9%) - -
M: Migraon and integraon 13 (5,7%) 2 (4,8%) 11 (5,9%) 1 (4%) 10 (37%) - - -
F: Funding structures of public system 10 (4,4%) - 10 (5,4%) 4 (16%) 1 (3,7%) 5 (4,7%) - -
Figure 9. Attribution of ten additional criteria to 228 items previously not attributed.
Urban Planning, 2020, Volume 5, Issue 3, Pages 403–417 413Table 4. Proposed extension.
Behaviour (B) Neoclassical (N) Institutional (I) Project-Oriented (P)
B1. The founder, managers N10. Distance between the I22. Company incubator P30. Characteristics of
and employees want to live company and urban centres I23. Access to knowledge proposed site
in this location N11. Distance to markets generated by universities or P31. Possibility of phased
B2. Proximity to the and the cluster scale research centres development and future
founder’s residence N12. Road infrastructures I24. Location close to extensions of the project
B3. Climate N13. Geographic administrative centres P32. Availability and
B4. Good housing standards specialisation I25. Access to science parks accessibility of existing
resources for the execution
B5. Local community N14. Human resource skills I26. R&D incentives,
of the project
attitude to business and qualifications employment creation or
other incentives P33. Ability to comply with
B6. Recreational and leisure N15. Industrial real estate
project timeline
activities costs I27. Proximity to teaching
institutions P34. Actors carrying
B7. The founder was born in N16. Costs of labour
responsibility (individual,
the community N17. Population density I28. Technological fairs
institutional) and their
B8. Good means of access N18. Level of local I29. Renowned business commitment to the project
B9. Entrepreneur financial economic activity in the leaders in the region
capacity company location
N19. Other physical
infrastructures (railroads,
airports,
telecommunications, etc.)
N20. Proximity to raw
materials
N21. Proximity to services
5.6. Proposition II: Tool for Evaluation of Individual and approaches analysed in this article. Two output ta-
Locations bles (Figure 10) list the ten factors that the individual
location complies with most and least. This input can
As a support to policymakers, we developed our dataset provide practitioners with a quick route to an evidence-
into a simple tool to evaluate a location’s investment based discussion of how to interpret and further develop
attraction position. Based on self-assessment, it com- their location’s investment attraction policies. The com-
putes the position of the location vis-à-vis the factors plete dataset, including underlying formulas and a short
High level of compliance with HQ2 topics Low level of compliance with HQ2 topics
Aribuon Aribuon
Relave Relave
Approach / Factor rate of Approach / Factor rate of
Posion Posion
instuon instuon
1 B2: Proximity to the founder’s residence 100% 40 I22. Company incubator 20%
2 I24. Locaon close to administrave centres 100% 39 I29. Renowned business leaders in the region 33%
B1: The foucer, managers and employees want
3 83% 38 E: Evaluaons, Studies; (internaonal) rankings 36%
to live in this locaon
4 N16. Costs of labour 82% 37 P: Policies and Programs 37%
5 N12. Road infrastructures 80% 36 N13. Geographic specialisaon 38%
6 I28. Technological fairs 80% 35 I27. Proximity to teaching instuons 40%
N10. Distance between the company and urban
7 N11. Distance to markets and the cluster scale 78% 34 42%
centres
R: Responsible actors (instuonal, personal);
8 I25. Access to science parks 78% 33 ownership structure and their commitment for 43%
the investment project
N18. Level of local economic acvity in the
9 N15. Industrial real estate costs 77% 32 44%
company locaon
T: Timeline; actual availability of resources and
10 74% 31 N14. Human resource skills and qualificaons 49%
future extensions
Figure 10. Evaluation output of fictional location.
Urban Planning, 2020, Volume 5, Issue 3, Pages 403–417 414description, is available online as supplementary mate- the criteria applied by Amazon, highlighting areas of
rial to this publication. strength and weakness. It provides policymakers with ev-
idence for the evaluation of existing investment promo-
6. Conclusion tion strategies and the formulation of economic policy.
The tool is available online as supplementary material to
The overall goal of this work on Amazon’s HQ2 location this publication.
decision process was to develop recommendations for
both research in location theory and practice in local Acknowledgments
economic development. We argued that the formal cri-
teria applied by this highly visible investment project Rudolf Giffinger of TU Wien for support and guidance;
will become a new ‘gold standard’ for business location three anonymous reviewers and the editors in particular
decision-making. Policymakers will be confronted with for valuable comments and suggestions; Vienna Business
potential investors applying similar decision criteria. For Agency for providing a stimulating and enabling work en-
location theory, it is an opportunity to calibrate its dom- vironment; and colleagues from several European invest-
inant assumptions. ment promotion agencies for inspiring discussions, re-
Applying a mixed-method qualitative content analy- flections and their readiness for open exchange.
sis approach, we extracted Amazon’s requirements to po-
tential investment locations and set up a dataset of 794 Conflict of Interests
items. Those were attributed to formalized factors from
location decision theory following Ferreira et al. (2016). The author declares no conflict of interest.
The result led to four findings: First, our analysis shows
that criteria related to human resources, infrastructure, Supplementary Material
incentives, and real estate costs dominate the HQ2 pro-
cess. Second, criteria related to a location’s climate were Supplementary material for this article is available online
not present in the decision process. The higher attractive- in the format provided by the author (unedited).
ness of locations in warmer climates, as captured by dis-
cussions around ‘sun belt’ attractiveness, is thus not sup- References
ported by our analysis. Third, in the contest of Hayter’s
(1997) three approaches (behavioural, neoclassical, insti- Alonso, W. (1964). Location and land use: Toward a gen-
tutional), Amazon clearly took the side of the neoclassi- eral theory of land rent. Cambridge, MA: Harvard Uni-
cal approach. This is most visible in its list of questions versity Press.
dedicated to talent and real estate. Fourth, we were able Amazon. (2017). Amazon HQ2 RFP. Amazon. Re-
to detect gaps in contemporary location decision theory: trieved from https://images-na.ssl-images-amazon.
29% of items could not be attributed to any of Ferreira com/images/G/01/Anything/test/images/usa/
et al.’s (2016) criteria. Most of these items target ques- RFP_3._V516043504_.pdf
tions around real estate and taxes. Amazon. (2018a, January 18). Amazon announces
This gap led us to our first proposition. By introducing, candidates for HQ2 [Press release]. Retrieved from
testing and clustering, we developed a proposition for an https://www.businesswire.com/news/home/
addition to Hayter’s (1997) three approaches, called the 20180118005771/en/Amazon-Announces-
‘Project-Oriented Approach.’ It clusters two groups that Candidates-HQ2
our analysis proved were missing in the current three ap- Amazon. (2018b, November 13). Amazon selects New
proaches: the site-related criterion (P30. Characteristics York City and Northern Virginia for new headquar-
of proposed site) and the project-related criteria (P31. ters [Press release]. Retrieved from https://www.
Possibility of phased development and future extensions businesswire.com/news/home/20181113005798/
of the project; P32. Availability and accessibility of exist- en/Amazon-Selects-New-York-City-Northern-
ing resources for the execution of the project; P33. Ability Virginia
to comply with project timeline; P34. Actors carrying re- Arauzo, J. M., & Manjón, M. C. (2004). Firm size and
sponsibility (individual, institutional) and their commit- geographical aggregation: An empirical appraisal in
ment to the project). Those criteria are inherently unique industrial location. Small Business Economics, 22,
to each potential investment location, yet they proved 299–312.
decisive for the HQ2 decision process. Further research Arauzo-Carod, J. M., Liviano-Solis, D., & Manjón-Antolín,
is needed to examine ways to integrate those criteria M. (2010). Empirical studies in industrial location: an
into quantitative models covering a heterogeneous set assessment of their methods and results. Journal of
of locations. Regional Science, 50(3), 685–711.
Our second proposition is directed at policymak- Bartik, T. J. (2019). Making sense of incentives: Taming
ers. We developed a simple tool based on our dataset business incentives to promote prosperity. Kalama-
of 794 items derived from the HQ2 process. As a re- zoo, MI: W. E. Upjohn Institute for Employment Re-
sult, it shows an individual location’s position vis-à-vis search. Retrieved from https://research.upjohn.org/
Urban Planning, 2020, Volume 5, Issue 3, Pages 403–417 415up_press/258 it’s opening a new 1,500-employee office in NYC.
Böventer, E. V. (1962). Die Struktur der Landschaft. Business Insider. Retrieved from https://www.
Versuch einer Synthese und Weiterentwicklung der businessinsider.de/international/amazon-new-
Modelle J. H. von Thünens, W. Christallers und A. office-in-nyc-2019-12
Löschs [The structure of the landscape. Attempt to Fenzl, T., & Mayring, P. (2017). QCAmap: Eine inter-
synthesize and further develop the models by J. H. aktive Webapplikation für Qualitative Inhaltsanalyse
von Thünen, W. Christaller and A. Lösch]. In E. Schnei- [QCAmap: An interactive web application for quali-
der (Ed.), Optimales Wachstum und optimale Stan- tative content analysis]. Zeitschrift für Soziologie der
dortverteilung [Optimal growth and optimal loca- Erziehung und Sozialisation, 37, 333–340.
tion distribution] (pp. 77–133). Berlin: Duncker & Ferreira, J. J., Fernandes, C. I., Raposo, M. L., Thurik,
Humblot. R., & Faria, J. R. (2016). Entrepreneur location de-
Brenner, N., & Theodore, N. (2002). Cities and the geogra- cisions across industries. International Entrepreneur-
phies of “actually existing neoliberalism.” Antipode, ship and Management Journal, 12(4), 985–1006. Re-
34(3), 349–379. trieved from https://personal.eur.nl/thurik/
Brouwer, A. E., Mariotti, I., & van Ommeren, J. N. Research/Articles/Entrepreneur%20location%20
(2004). The firm relocation decision: An empirical decisions%20across%20industries%20IEMJ%20
investigation. The Annals of Regional Science, 38(2), 2016.pdf
335–347. Retrieved from https://www.researchgate. Florida, R. (2004). The rise of the creative class: And how
net/profile/Aleid_Brouwer/publication/24053608_ it’s transforming work, leisure, community and every-
The_Firm_Relocation_Decision_An_Empirical_ day life. New York, NY: Basic Books.
Investigation/links/53e892a00cf21cc29fdc7451/ Florida, R. (2018, May 10). The hypocrisy of Amazon’s
The-Firm-Relocation-Decision-An-Empirical- HQ2 process. Citylab. Retrieved from https://
Investigation.pdf www.citylab.com/equity/2018/05/the-hypocrisy-of-
Can Amazon keep growing like a youthful startup? amazons-hq2-process/560072
(2020, June 20). The Economist. Retrieved from Glaeser, E. L. (2005). Smart growth: Education, skilled
https://www.economist.com/briefing/2020/06/18/ workers, & the future of cold-weather cities. (Policy
can-amazon-keep-growing-like-a-youthful-startup Brief PB-2005-1). Cambridge, MA: John F. Kennedy
Carr, C., & Hesse, M. (2020). When Alphabet Inc. plans School of Government, Harvard University. Retrieved
Toronto’s Waterfront: New post-political modes of from https://www.hks.harvard.edu/sites/default/
urban governance. Urban Planning, 5(1), 69–83. files/centers/rappaport/files/skilledcities.pdf
https://doi.org/10.17645/up.v5i1.2519 Goodman, J. D. (2019, February 14). Amazon pulls out of
Christaller, W. (1933). Die zentralen Orte in Süddeutsch- planned New York City headquarters. The New York
land [The central places in southern Germany]. Jena: Times. Retrieved from https://www.nytimes.com/
Gustav Fischer. 2019/02/14/nyregion/amazon-hq2-queens.html
City of Boston. (2017). Amazon HQ2: Request for Graf, H., & Salazar, L. (2019, December 14). Arlington
proposal response. Boston, MA: City of Boston. Re- County approves Amazon’s proposal for HQ2 towers:
trieved from https://assets.documentcloud.org/ Construction to start 2020. ABC7 WJLA. Retrieved
documents/4113557/Boston-Amazon-HQ2- from https://wjla.com/news/local/arlington-county-
Proposal.pdf board-vote-amazon-hq2-project
City of New York. (2018). Request for information— Griswold, A. (2017, November 4). A nearly complete
Project Clancy. New York, NY: City of New York. list of the 238 places that bid for Amazon’s next
Retrieved from https://int.nyt.com/data/document headquarters. Quartz. Retrieved from https://qz.
helper/526-ny-amazon-proposal/03a603e8af6bbbc com/1119945/a-nearly-complete-list-of-the-238-
0272e/optimized/full.pdf places-that-bid-for-amazons-next-headquarters
Clark, T. N., Lloyd, R., Wong, K. K., & Jain, P. (2002). Gupta, P. S. (2019). The fleeting, unhappy affair of
Amenities drive urban growth. Journal of Urban Af- Amazon HQ2 and New York City. Transnational Le-
fairs, 24(5), 493–515. gal Theory, 10(1), 97–122. https://doi.org/10.1080/
Cleave, E., Arku, G., & Chatwin, M. (2019). Are they sur- 20414005.2019.1609785
geons? Or are they plumbers? Assessing the role Hayter, R. (1997). The dynamics of industrial location:
of private sector consultants in place branding and The factory, the firm and the production system. New
other place-based economic development strate- York, NY: Wiley.
gies. Public Organization Review, 19(2), 179–200. Holder, S. (2018, May 29). What did cities actually
https://doi.org/10.1007/s11115-017-0396-0 offer Amazon? Citylab. Retrieved from https://www.
Dement, D. (2018, June 22). Amazon HQ2 to Texas. citylab.com/life/2018/05/what-did-cities-actually-
The Higher Learning. Retrieved from http://the offer-amazon/559220
higherlearning.com/2018/06/22/amazon-hq2-texas Ioannou, B., Nicolaou, L., Serraos, K., & Spiliopoulou, G.
Eugene, K. (2019, December 7). Less than a year after (2019). Large urban developments as non-planning
abandoning HQ2 in New York City, Amazon says products: Conflicts and threats for spatial plan-
Urban Planning, 2020, Volume 5, Issue 3, Pages 403–417 416You can also read