AMERICA'S RENTAL HOUSING 2017 - Joint Center for Housing Studies of Harvard University - Harvard Joint Center ...
←
→
Page content transcription
If your browser does not render page correctly, please read the page content below

AMERICA’S RENTAL HOUSING 2017

Joint Center for Housing Studies of Harvard University

JOINT CENTER FOR HOUSING STUDIES OF HARVARD UNIVERSITY

HARVARD GRADUATE SCHOOL OF DESIGN
HARVARD KENNEDY SCHOOL

CO N TEN TS

1. Executive Summary                  1

2. Renter Households                  7

3. Rental Housing Stock             13

4. Rental Markets                   19

5. Rental Affordability             26

6. Rental Housing Challenges        32

7. Appendix Tables                  38

Online Tables and Exhibits: www.jchs.harvard.edu/americas-rental-housing

Funding for this report was provided by the John D. and Catherine T. MacArthur
Foundation and the Policy Advisory Board of the Joint Center for Housing Studies.

©2017 by the President and Fellows of Harvard College.

The opinions expressed in America’s Rental Housing 2017 do not necessarily represent
the views of Harvard University, the Policy Advisory Board of the Joint Center for Housing Studies
or the MacArthur Foundation.

1 | EXECUTIVE SUMMARY

After a decade of broad-based growth,                        RENTER HOUSEHOLD GROWTH IN A SLOWDOWN
                                                             Rental housing markets have seen an unprecedented run-up in
renter households are increasingly likely                    demand over the last decade, with growth in renter housholds aver-
                                                             aging just under one million annually since 2010. But the surge in
to have higher incomes, be older, and have                   demand now appears to be ending, with the three major government

children. The market has responded to this                   surveys reporting a sharp slowdown in renter household growth to
                                                             the 136,000–625,000 range in 2016. Early indications for 2017 sug-
shift in demand with an expanded supply                      gest a further deceleration, with one survey showing essentially no
                                                             increase and another posting a substantial decline (Figure 1). While
of high-end apartments and single-family                     these estimates are notoriously volatile from year to year, the con-
                                                             sistent trend across surveys provides some confidence that growth
homes, but with little new housing affordable                in renter households is indeed cooling.

to low- and moderate-income renters. As a
                                                             The recent wave in renter household growth reflects in part the sharp

result, part of the new normal emerging in                   drop in the national homeownership rate after 2004. While many fac-
                                                             tors drove that decline, the massive wave of foreclosures after the hous-
the rental market is that nearly half of renter              ing crash was a key contributor. This drag on homeownership has now
                                                             eased. And with the economy near full employment and incomes on the
households are cost burdened. Addressing                     rise, more households that want to buy homes are able to do so.

this affordability challenge thus requires                   Still, the housing crisis no doubt generated renewed appreciation for

not only the expansion of subsidies for the                  the advantages of renting that will help sustain demand in the years
                                                             ahead. Indeed, even as the homeownership rate stabilizes, renters
nation’s lowest-income households, but                       are still likely to account for slightly more than a third of household
                                                             growth. According to Joint Center projections, the number of renter
also the fostering of private development of                 households will increase by nearly 500,000 annually over the ten
                                                             years from 2015 to 2025—a still robust pace by historical standards.
moderately priced housing.
                                                             The sweeping changes in the nature of rental demand, however,
                                                             seem likely to persist. In particular, renting now appears to have
                                                             greater appeal for households that could afford to buy homes if they
                                                             desired. In 2006, 12 percent of households earning $100,000 or more
                                                             were renters. In 2016, that share exceeded 18 percent, a cumulative
                                                             increase of 2.9 million renters in this top income category. Indeed,
                                                             these high-income households drove nearly 30 percent of the growth
                                                             in renters over the decade. Even so, renting remains the primary
                                                             housing option for those with the least means. A majority (53 per-
                                                             cent) of households earning less than $35,000 rent their housing,
                                                             including over 60 percent of households earning less than $15,000.

                                                  JOINT CENTER FOR HOUSING STUDIES OF HARVARD UNIVERSITY                                 1
FIGURE 1

    After a Decade of Expansion, the Pace of Growth in Renter Households Has Slowed
    Millions                                                                                                                                                                             Millions

     1.6                                                                                                                                                                                      44
     1.4                                                                                                                                                                                      42
     1.2                                                                                                                                                                                      40
     1.0                                                                                                                                                                                      38
     0.8                                                                                                                                                                                      36
     0.6                                                                                                                                                                                      34
     0.4                                                                                                                                                                                      32
     0.2                                                                                                                                                                                      30
     0.0                                                                                                                                                                                      28
    -0.2                                                                                                                                                                                      26
    -0.4                                                                                                                                                                                      24
               2004             2005             2006             2007             2008       2009        2010         2011     2012      2013      2014      2015      2016      2017

           ■ Change in Renter Households (Left scale)                    ■     Number of Renter Households (Right scale)

           Note: Estimate for 2017 is the average of second- and third-quarter data.
           Source: JCHS tabulations of US Census Bureau, Housing Vacancy Survey.

    In addition, renters are now much older on average than a decade ago,                                             nearly 4 million, lifting the total to 18.2 million. While single-family
    reflecting both an increase in middle-aged households that rent and                                               homes have always accounted for a large share of rental housing,
    the overall aging of the population. The median age of renters thus                                               they now make up 39 percent of the stock.
    increased from 38 in 2006 to 40 in 2016. Although roughly a third of
    renters are under age 35, nearly as many are now age 50 and over.                                                 More recently, though, growth in the single-family supply has
                                                                                                                      slowed. The American Community Survey shows that the number
    With renting more common across age and income groups, renter                                                     of single-family rentals (including detached, attached, and mobile
    households are more representative of the broad cross-section of US                                               homes) increased by only 74,000 units between 2015 and 2016,
    families. Most notably, families with children now make up a larger                                               substantially below the 400,000 annual increase averaged in 2005–
    share of households that rent (33 percent) than own (30 percent).                                                 2015. With this slowdown in single-family conversions and a boom
    Married couples without children, in contrast, make up 37 percent                                                 in multifamily construction, new multifamily units have come to
    of homeowners and just 12 percent of renter households. Single per-                                               account for a growing share of new rentals. Indeed, completions of
    sons are still the most common renter household type, accounting                                                  new multifamily units intended for rent averaged 300,000 annually
    for fully 37 percent of all renter households.                                                                    over the last two years, their highest level since the end of the 1980s.

    While whites accounted for a large share of the overall growth in                                                 Much of this new housing is targeted to higher-income households
    renters, renter households are quite racially and ethnically diverse.                                             and located primarily in high-rise buildings in downtown neigh-
    Unlike homeowners, who are overwhelmingly white, renter house-                                                    borhoods. Given that construction and land costs are particularly
    holds include a large share (47 percent) of minorities. At the same                                               high in these locations, the median asking rent for new apartments
    time, one in five renter households is foreign born, reflecting the                                               increased by 27 percent between 2011 and 2016 in real terms, to
    importance of rental housing to new immigrants.                                                                   $1,480. Using the 30-percent-of-income standard for affordability,
                                                                                                                      households would need an income of at least $59,000 to afford these
                                                                                                                      new units, well above the median renter income of $37,300.
    EVOLUTION OF THE RENTAL SUPPLY
    Soaring demand sparked a sharp expansion of the rental stock over                                                 At the same time, the supply of moderate- and lower-cost units has
    the past decade. Initially, most of the additions to supply came from                                             increased only modestly (Figure 2). While the share of new units rent-
    conversions of formerly owner-occupied units, particularly single-                                                ing for at least $1,100 jumped from 37 percent in 2001 to 65 percent
    family homes, which provided housing for the increasing number of                                                 in 2016, the share renting for under $850 shrank from just over two–
    families with children in the rental market. Between 2006 and 2016,                                               fifths to under one–fifth. The lack of new, more affordable rentals is
    the number of single-family homes available for rent increased by                                                 in part a consequence of sharply rising construction costs, includ-

2                     AMERICA’S RENTAL HOUSING 2017
FIGURE 2 In many cases, the supply of these so-called naturally occurring
affordable rentals is replenished as rents on older housing fall due
Additions to the Rental Stock Are Increasingly to aging and obsolescence. But with overall rental demand strong,
at the Higher End particularly in centrally located communities, rents for an increas-
Share of Recently Built Units ing number of once-affordable units have become out of reach
for lower-income households. At the same time, the rents charged
15% in neighborhoods15%
for units22% with weak demand may not support
23%
adequate maintenance, leaving those rentals at risk of deterioration
and loss. Given the lack of new construction of lower-cost rentals,
preserving the existing stock of privately owned affordable units is
22% increasingly urgent. 23%
18% 21%
RENTAL MARKETS AT A TURNING POINT
Rental construction led the housing recovery, rebounding nearly
21% 18% trough in 2009 to 400,000 units in 2015—
four-fold from the market
2001 the highest annual level since the late 1980s. But after moving
sideways in 2016, the pace of multifamily starts has fallen 9 per-
9%
cent through October 2017. The slowdown has occurred in markets
25%
9% across the country, but is most evident in metros where multifamily
construction had been strongest.
40%
40%
In addition to the slowdown in construction, a variety of measures sug-
18% gest that the rental boom is cresting. RealPage reports increasing slack
in the professionally managed apartment market, with vacancy rates
18%over the past year in 94 of the 100 metros tracked. The clearest
rising
signs of loosening are in the higher-priced Class A segment, where the
25% vacancy rate was9% 9%
up 1.5 percentage points year over year in the third
quarter of 2017, to 6.0 percent (Figure 3). Vacancy rates in the lower-cost
2016
Class C segment also rose but remain quite low at 4.1 percent.
Monthly Housing Cost
■ Under $650 ■ $650–849 ■ $850–1,099 ■ $1,100–1,499 ■ $1,500 and Over Apartment rents are also increasing more slowly in all three seg-
Notes: Recently built units in 2001 (2016) were constructed in 1999–2001 (2014–2016). Monthly housing costs ments of the market (Figure 4). This deceleration has appeared in all
include rent and utilities and are in constant 2016 dollars, adjusted for inflation using the CPI-U for All Items Less
four regions of the country and in large and small markets alike.
Shelter. Data exclude vacant units and units for which no cash rent is paid.
Source: JCHS tabulations of US Census Bureau, 2001 and 2016 American Community Survey 1-Year Estimates. Even so, conditions in selected markets—particularly smaller metros
and locations in the Midwest, such as Cincinnati and Minneapolis—
were still heating up.
ing labor and materials. According to estimates from RS Means, the Over the last six years, increases in the median rent have exceeded
costs of building a basic, three-story apartment building increased inflation in non-housing costs by more than a full percentage point
by 8 percent from 2016 to 2017 alone. Tight land use regulations also annually, with the largest gains in the South and West. Median rents
add to costs by limiting the land zoned for higher-density housing have risen at twice the national pace in markets with rapid popula-
and entailing lengthy approval processes. tion growth, such as Austin, Denver, and Seattle. And within these
fast-growing metros, rents in previously low-cost neighborhoods
Given these high development costs, most of the demand for low- rose nearly a percentage point faster each year than in high-cost
priced rentals must be met by older units. Only a fifth of existing neighborhoods.
units rented for under $650 a month in 2016, and nearly half of these
units were built before 1970. Affordably priced rentals are frequently Meanwhile, rental property owners continue to benefit from still
located in smaller multifamily structures, with one-quarter of low- healthy increases in operating incomes and property values. According
cost units in buildings with 2–4 apartments. to the National Council of Real Estate Investment Fiduciaries, net
21
JOINT CENTER FOR HOUSING STUDIES OF HARVARD UNIVERSITY 3
FIGURE 3                                                                                                             FIGURE 4

     As Vacancy Rates Begin to Climb…                                                                                    … Rent Growth Appears Set for a Steeper Slowdown
     Rental Vacancy Rate (Percent)                                                                                       Change in Rents (Percent)

     11                                                                                                                  7
     10
                                                                                                                         6
      9
      8                                                                                                                  5
      7
      6                                                                                                                  4
      5                                                                                                                  3
      4
      3                                                                                                                  2
      2                                                                                                                  1
      1
      0                                                                                                                  0
              2011             2012            2013            2014            2015            2016          2017                 2011              2012             2013             2014             2015              2016           2017

          Q    Class A      Q   Class B      Q   Class C QAll Rental Units                                                Q    Class A       Q   Class B       Q   Class C QAll Rental Units
          Notes: Vacancy rates are calculated as smoothed four-quarter trailing averages. Vacancy rate for all rental        Notes: Growth in rents for all units is measured by the CPI for Rent of Primary Residence, including utilities.
          units is from the HVS. RealPage data cover professionally managed apartments in buildings with five or more        RealPage data cover professionally managed apartments in buildings with five or more units.
          units.                                                                                                             Sources: JCHS tabulations of Bureau of Labor Statistics, and RealPage, Inc.
          Sources: JCHS tabulations of US Census Bureau, Housing Vacancy Survey (HVS), and RealPage, Inc.

    operating incomes were up 3.8 percent in the third quarter of 2017                                                  only after a decade of steep increases. At the average rate of improve-
    from a year earlier. In addition, Real Capital Analytics reports that                                               ment from 2014 to 2016, it would take another 24 years for the num-
    real apartment prices climbed 6.3 percent in the second quarter of                                                  ber of cost-burdened renters to return to the 2001 level.
    this year. Although declining, rates of return on investment remained
    relatively strong at 6.2 percent. The pace of investment, however,                                                  The high incidence of cost burdens reflects the divergent paths of
    appears to be slowing, with the volume of large international and                                                   rental housing costs and household incomes. Between 2001 and 2011,
    institutional deals falling in many major apartment markets.                                                        median rental housing costs rose 5 percent in real terms while median
                                                                                                                        renter incomes dropped 15 percent. Since 2011, however, real housing
    Even so, multifamily financing remains at an all-time high.                                                         costs have increased 6 percent while income growth has picked up
    According to the Mortgage Bankers Association, the volume of                                                        16 percent (due in part to the increasing share of renters with higher
    outstanding multifamily mortgage debt increased by about 20                                                         incomes). But even with the recent turnaround in incomes, the cumu-
    percent in 2015–2016, rising to nearly $1.2 trillion in early 2017.                                                 lative increase in rental housing costs since 2001 has been far larger.
    Federally backed debt rose by 25 percent, while bank and thrift
    lending was up 29 percent. Meanwhile, multifamily loan delin-                                                       The rental market thus appears to be settling into a new normal
    quencies are extremely low. Some caution appears to be creeping                                                     where nearly half of renter households are cost burdened. An impor-
    into the market, however, with the latest Federal Reserve loan                                                      tant element of this trend is that more middle-income renters are
    officer surveys pointing to tightening credit and slowing demand.                                                   spending a disproportionate share of income for housing. Indeed, the
                                                                                                                        share of renters earning $30,000–45,000 with cost burdens jumped
                                                                                                                        from 37 percent in 2001 to 50 percent in 2016, and the share earn-
    SLIGHT EASING OF AFFORDABILITY PRESSURES                                                                            ing $45,000–75,000 nearly doubled from 12 percent to 23 percent.
    With the economy continuing to improve and income growth accel-                                                     In addition, the cost-burdened share of lowest-income households
    erating, the share of renters with cost burdens (paying more than 30                                                (earning less than $15,000) was still a stunning 83 percent, with the
    percent of income for housing) fell in 2016 for the fourth time in five                                             vast majority experiencing severe burdens.
    years, to 47 percent (Figure 5). The number of cost-burdened renters
    also fell for the second consecutive year, declining from 21.3 million                                              Given the fundamental need for shelter, rent is typically the first
    in 2014 to 20.8 million in 2016, with the number of severely burdened                                               bill paid each month. High housing costs erode renters’ purchasing
    households (paying more than 50 percent of income for housing) dip-                                                 power, leaving little money left over for other essentials such as food,
    ping from 11.4 million to 11.0 million. However, this progress comes                                                childcare, and healthcare. In 2016, the median renter in the bottom

4                    AMERICA’S RENTAL HOUSING 2017
income quartile had just $488 per month to spend on other essen-                                                        number of occupied public housing units fell by 60,000 between 2006
tials—18 percent less than in 2001 after adjusting for inflation. The                                                   and 2016. The Rental Assistance Demonstration (RAD) program was
added costs of utilities and transportation further strain household                                                    launched in 2012 to convert public housing into long-term project-
budgets. Low-income households with children and older adults                                                           based Section 8 contracts in order to provide more flexible financing
with severe rental cost burdens are in a particularly precarious posi-                                                  for improvements. The RAD program quickly reached its initial cap
tion and may be unable to afford other goods and services that are                                                      of 60,000 units, which has since been increased to 225,000 units.
critical to health and well-being.
                                                                                                                        The two main sources of rental housing assistance are the Housing
                                                                                                                        Choice Voucher and Low Income Housing Tax Credit (LIHTC) pro-
SHORTFALL IN RENTAL ASSISTANCE                                                                                          grams. Vouchers enable recipients to choose units on the open
Need for housing assistance continues to grow. HUD’s Worst Case                                                         market as long as they meet rent and quality standards. Despite a
Housing Needs 2017 Report to Congress shows that the number of                                                          6.8 percent increase in funding between 2011 and 2016, rising rents
very low-income households receiving rental assistance increased                                                        kept growth in the number of voucher holders to just 5.8 percent.
by 600,000 from 2001 to 2015. Over the same period, the number of
very low-income households (making less than 50 percent of area                                                         In contrast, the LIHTC program provides funding for new construc-
median) grew by 4.3 million, with extremely low-income house-                                                           tion as well as rehabilitation and preservation of existing assisted
holds (making less than 30 percent of area median) accounting for                                                       housing. In recent years, the LIHTC program has supported 70,000
more than half (2.6 million) of this increase. As a result, the share                                                   affordable rental units per year, with roughly 55 percent added
of renters potentially eligible for assistance and that were able to                                                    through new construction. But over the next decade, nearly 500,000
secure this support declined from 28 percent to 25 percent (Figure                                                      LIHTC units, along with over 650,000 other subsidized rentals, will
6). Meanwhile, the share of very low-income renters facing worst                                                        come to the end of their required affordability periods. The need for
case needs—that is, paying more than half their incomes for hous-                                                       funding to help rehabilitate and preserve this important stock will
ing and/or living in severely inadequate units—increased from 34                                                        fuel significant demand for LIHTC funding, thus limiting opportuni-
percent to 43 percent.                                                                                                  ties to build new affordable rentals.

Making matters worse, much of the subsidized rental stock is at risk                                                    In recognition of the important role that the LIHTC program plays,
of loss either due to under-maintenance or expiring affordability                                                       the Congress is considering a bipartisan proposal to expand funding
periods. Public housing is particularly under threat, with a backlog                                                    while also introducing reforms that would improve the ability of
of deferred repairs last estimated at $26 billion in 2010. In fact, the                                                 the program to serve both lower- and moderate-income households

FIGURE 5

Despite Recent Declines, the Number and Share of Cost-Burdened Renters Remain Well Above Levels a Decade Ago
Millions                                                                                                                                                                                                          Percent

12                                                                                                                                                                                                                     52

11                                                                                                                                                                                                                     50

10                                                                                                                                                                                                                     48

 9                                                                                                                                                                                                                     46

 8                                                                                                                                                                                                                     44

 7                                                                                                                                                                                                                     42

 6                                                                                                                                                                                                                     40

 5                                                                                                                                                                                                                     38
        2001          2002          2003          2004           2005          2006          2007          2008          2009          2010          2011          2012          2013      2014   2015     2016

     ■ Number of Moderately Burdened Renters (Left scale) ■ Number of Severely Burdened Renters (Left scale)                                       ■    Share of Renters with Cost Burdens (Right scale)

     Notes: Moderately (severely) cost-burdened households pay 30–50% (more than 50%) of income for housing. Households with zero or negative income are assumed to have severe burdens,
     while households paying no cash rent are assumed to be without burdens.
     Source: JCHS tabulations of US Census Bureau, American Community Survey 1-Year Estimates.

                                                                                                                                                                                                                                21
                                                                                                                JOINT CENTER FOR HOUSING STUDIES OF HARVARD UNIVERSITY                                                      5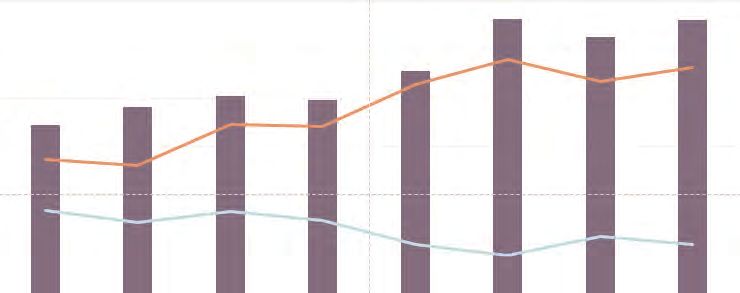
FIGURE
      FIGURE226                                                                                                         The incidence and severity of natural disasters is on the rise. In devel-
                                                                                                                        oping their recovery plans to improve resiliency after such events,
     Growth of Very Low-Income Renters Continues                                                                        governments at all levels must keep in mind the needs of renters—
     to Outpace Availability of Housing Assistance                                                                      particularly very low-income renters—for replacement housing.
     Millions                                                                                               Percent
     20                                                                                                            50

     18                                                                                                            45
                                                                                                                        THE OUTLOOK
                                                                                                                        Slower growth in rental housing demand could be good news if it
     16                                                                                                            40
                                                                                                                        helps to check the rapid rise in rents. But even if the homeownership
     14                                                                                                            35   rate stabilizes near current levels, the number of renter households
                                                                                                                        is likely to continue to increase at a healthy clip, driving up the need
     12                                                                                                            30
                                                                                                                        for additional supply. And given that a broader array of households
     10                                                                                                            25
                                                                                                                        has turned to renting, this also means a growing need for a range of
      8                                                                                                            20   rental housing options.
              2001        2003         2005         2007         2009          2011         2013         2015

          ■ Number of Very Low-Income Renters (Left scale)                                                              With the divergence between housing costs and household incomes
          ■
              Share with Worst Case Housing Need (Right scale)                                                          after 2001, cost burdens are a fact of life for nearly half of all rent-
          ■
              Share Receiving Housing Assistance (Right scale)
                                                                                                                        ers (Online Figure 1). The lack of affordable rental housing is a conse-
          Notes: Very low income is defined as less than 50% of area median. Households with worst case housing
                                                                                                                        quence of not only strong growth in the number of lower-income
          needs are very low-income renters paying more than 50% of income for rent or living in severely inadequate
          conditions, and do not receive housing assistance.                                                            households, but also steeply rising development costs. The complex
          Source: US Department of Housing and Urban Development, 2003–2017 Worst Case Housing Needs Reports
          to Congress.                                                                                                  set of forces driving these increases includes the escalating costs of
                                                                                                                        inputs and a lack of innovation in production methods, the design of
                                                                                                                        homes, and the means of financing housing. Addressing all of these
    in high-cost markets. However, tax reform proposals also under                                                      challenges requires action on the parts of both the public and pri-
    debate call for elimination of the 4 percent LIHTC program, which                                                   vate sectors. Government at all levels has a role to play in ensuring
    accounted for just under half of production in 2015.                                                                that the regulatory environment does not stifle much-needed inno-
                                                                                                                        vation, and that tax policy and public spending support the efficient
                                                                                                                        provision of moderately priced housing. Industry has its own part to
    THE CHALLENGE OF REBUILDING AFTER DISASTERS                                                                         play in fostering and advancing new approaches.
    The series of disasters this past year—including devastating hur-
    ricanes in Texas, Florida, and Puerto Rico, and massive wildfires                                                   However, the market simply cannot supply housing at prices afford-
    in densely populated areas of California—have affected millions                                                     able to the nation’s lowest-income households. The best means of
    of owners and renters alike. A key lesson from previous disas-                                                      supporting these families and individuals depends on both local
    ters is that rental property owners are slower than homeowners                                                      market conditions and the value placed on other policy goals, such
    to rebuild or replace their units. For example, five years after                                                    as helping to revitalize communities and improving the geographic
    Hurricanes Katrina and Rita ravaged the Gulf coast, three-quar-                                                     distribution of permanently affordable housing. Another consider-
    ters of severely damaged owner-occupied housing in Louisiana                                                        ation for policymakers is to find ways for housing assistance pro-
    and Mississippi had been rebuilt, compared with only 60 percent                                                     grams to enable and encourage economic mobility.
    of small rental properties.
                                                                                                                        While there is much to debate about the best approaches to pursue,
    A recent report by the Community Preservation Corporation recom-                                                    the current level of rental housing assistance is grossly inadequate.
    mends a series of improvements to the federal disaster response                                                     It is concerning that discussions about federal tax reform have not
    process, including provision of additional housing vouchers to help                                                 addressed ways to expand the availability of affordable housing,
    displaced renters and special allocation of LIHTC authority to speed                                                and proposed measures could even erode the limited support that
    rebuilding of affordable housing. The study notes that the award-                                                   currently exists. As a growing body of evidence shows, the costs that
    ing of additional LIHTC authority supported development of 30,000                                                   poor-quality, unstable housing situations impose on individuals and
    rentals on the Gulf Coast after Katrina. In contrast, the Northeast                                                 families—as well as on broader society in terms of lost productivity
    was without similar authority after Hurricane Sandy and has subse-                                                  and the strain on public budgets—are simply too high to ignore.
    quently struggled to rebuild its affordable stock.

6                  AMERICA’S RENTAL HOUSING 2017
2 | RENTER HOUSEHOLDS
More than a third of US households live in A DECADE OF SOARING DEMAND COMING TO AN END
Rental housing demand has grown at an unprecedented pace for
rental housing. After the Great Recession and more than a decade. According to the Census Bureau’s Housing
Vacancy Survey, the number of renter households jumped by nearly
housing market crash, the number of renters a third, or roughly 10 million, between the homeownership peak
surged across all ages, races/ethnicities, in 2004 and 2016. From 2010 through 2016, growth has averaged
976,000 renters per year, far exceeding the 430,000–500,000 added
and household types, with especially large annually in the 1970s and 1980s when the baby boomers started to
enter the rental market. As of mid-2017, the number of US renters
increases among higher-income and older stood at 43 million.
households. Nevertheless, younger, lower- The surge in renter households erased a decade of declining
demand between 1994 and 2004, when the national rentership rate
income, and minority households are still
fell from 36 percent to just 31 percent (Figure 7). The share of renter
the most likely to rent and thus make up households was back up above 36 percent by early 2015, where it
has stabilized now that fewer owners are losing their homes to
large shares of renters. While growth in foreclosure and more young households are buying first homes. As
a result, rental markets generally are drawing less demand from
rental demand now appears to be slowing, homeowner markets.
demographic changes will continue to drive The latest survey data are beginning to reflect these trends. All
strong increases in the number of renter of three annual Census Bureau household surveys reported slow-
downs in renter growth in 2016. Indeed, the Housing Vacancy Survey
households over the coming decades. showed a year-over-year decline in the number of renter households
in mid-2017. But given that the trend is new and survey data are
unprecise, the full extent and duration of the decline in rental
demand are still unclear. Assuming that the homeownership rate
does stabilize, renters should continue to account for roughly a third
of household growth in the years ahead.
THE SURGE IN HIGH-INCOME RENTERS
Households of all ages, incomes, races/ethnicities, and family types
helped to fuel the recent growth in renters, but the role of high-
income households is particularly noteworthy. According to the
Current Population Survey, households with real annual incomes
of $50,000 or more—a group that accounted for just one-third of all
renter households in 2006—drove well over half (60 percent) of the
growth in renter households from 2006 to 2016. Moreover, house-
21
JOINT CENTER FOR HOUSING STUDIES OF HARVARD UNIVERSITY 7FIGURE 7
The Wave of Growth Since 2004 Has Lifted the Number and Share of Renter Households
Millions Percent
45.0 37
42.5 35
40.0 33
37.5 31
35.0 29
32.5 27
30.0 25
1986 1987 1988 1989 1990 1991 1992 1993 1994 1995 1996 1997 1998 1999 2000 2001 2002 2003 2004 2005 2006 2007 2008 2009 2010 2011 2012 2013 2014 2015 2016 2017
■ Renter Households (Left scale) ■ Rentership Rate (Right scale)
Note: Estimate for 2017 is the average of second- and third-quarter data.
Source: JCHS tabulations of US Census Bureau, Housing Vacancy Survey.
holds with real annual incomes of $100,000 or more—making up ROLES OF OLDER AND WHITE HOUSEHOLDS
just 9 percent of renters in 2006—were responsible for 29 percent of While the largest increase in rentership rates was among young,
the 9.9 million increase in renters over the decade (Figure 8). high-income households, much of the overall growth in renter house-
holds was driven by older households. Indeed, adults age 50 and over
Many, though not all, of the outsized increases in higher-income accounted for half of the increase in the total number of renters in
renters were concentrated in high-cost metro areas. For example, 2006–2016 (Figure 10). Although much of this increase simply reflects
households earning $100,000 or more accounted for 65 percent of changes in the age structure of the population, rising rentership
the growth in renter households in the New York City metro and rates among this age group lifted the number of older renters well
fully 93 percent in San Francisco (Figure 9). But even in metros where above what population aging alone would suggest. In addition, higher
they were less prevalent, higher-income households were respon- rentership rates among households in their 30s and 40s also helped
sible for significant shares of renter growth, including Miami (15 to offset what would have otherwise been declines among that age
percent) and Phoenix (20 percent). group as the youngest baby-boomers moved into their 50s.
Strong growth in high-income renter households was driven in Given that older adults are likely to live alone, the increase in older
large measure by sharply higher rentership rates among this renters added significantly to the number of single-person house-
group. Indeed, the share of households with incomes of at least holds. Single persons accounted for 37 percent of renter household
$75,000 that rented their housing jumped by 6.9 percentage points growth overall in 2006–2016, but fully 52 percent of the growth in
in 2006–2016, more than twice the 3.3 percentage point increase renter households age 50 and over. By comparison, single persons
among households earning less than $50,000. Without this increase made up only 20 percent of the increase in renter households under
in rentership rates among high-income households, there would be age 50. As a result, three out of every four single-person renter
3.4 million fewer renters today. households added over the decade were at least age 50.
The strong growth in higher-income households altered the distri- After single persons, married couples without children accounted
bution of renter household types. Unlike lower-income renters, who for the next-largest share of renter growth (17 percent). This group
primarily live in single-person households, higher-income renters includes older renter households with adult children no longer liv-
live in a variety of household settings that are likely to include mul- ing at home. Running a distant third, married couples with children
tiple adults, such as married couples or unmarried partners. These made up just 10 percent of the growth in renter households.
types of households, which are apt to have at least two earners,
made up half of the growth in renters earning $50,000 or more over A resurgence of renting among white households also helped to keep
the past decade. demand on the rise. The number of renter households headed by a
8 AMERICA’S RENTAL HOUSING 2017FIGURE 8 FIGURE 9
Higher-Income Households Represent a Growing …Particularly in High-Cost Metros Like New York,
Share of Renters… San Francisco, and Washington, DC
Percent Growth in Renter Households, 2006–2016 (Thousands)
40 350
35 300
30 250
25 200
20 150
15 100
10 50
5 0
0 -50
Less than $25,000– $50,000– $75,000– $100,000 New York City Los Angeles Houston Miami Washington, DC Phoenix San Francisco
$25,000 49,999 74,999 99,999 or More
Metro Area
Household Income
Household Income ■ Less than $25,000 ■ $25,000–49,999 ■ $50,000–74,999
■ Share of Renter Households in 2006 ■ Share of Renter Households in 2016 ■ $75,000–99,999 ■ $100,000 or More
■ Share of Renter Household Growth 2006–2016
Note: Household incomes are in constant 2016 dollars, adjusted for inflation using the CPI-U for All Items.
Note: Household incomes are in constant 2015 dollars, adjusted for inflation using the CPI-U for All Items. Source: JCHS tabulations of US Census Bureau, 2016 American Community Survey 1-Year Estimates using the
Source: JCHS tabulations of US Census Bureau, Current Population Surveys. Missouri Census Data Center MABLE/Geocorr14.
FIGURE 10
With Rising Rentership Rates and a Growing Adult Population, Households Age 50 and Over
Accounted for Half of the Recent Surge in Renters
Change in Renter Households, 2006–2016 (Millions)
1.5
1.0
0.5
0.0
-0.5
Under 25 25–29 30–34 35–39 40–44 45–49 50–54 55–59 60–64 65–69 70–74 75–79 80 and Over
Age of Household Head
■ Change Assuming 2006 Rentership Rates ■ Actual Change
Source: JCHS tabulations of US Census Bureau, Current Population Surveys.
21
JOINT CENTER FOR HOUSING STUDIES OF HARVARD UNIVERSITY 9white person was up by 3.6 million in 2006–2016, more than offset- both overall and across age groups. Renters are also more apt to be
ting the 2.6 million decline that had occurred over the previous 20 foreign born than homeowners, with immigrants accounting for 20
years. While minority renters collectively drove most of the increase percent of renters but just 12 percent of owners.
in renter households over the decade, white households were
responsible for the largest share of growth (37 percent), followed by Renter households are smaller on average than owner households.
Hispanics (27 percent), blacks (21 percent), and Asians/others (15 Over a third of renter households (37 percent) are single persons
percent). The majority of the increase in white renters (65 percent) living alone—far higher than the 23 percent share among owners.
was among households age 50 and over, but younger households— Still, families make up a significant share of renter households, and
particularly those in the 25–34 year-old age group—also contributed families with children in fact account for a larger share of renter
significantly to growth. households (33 percent) than homeowner households (30 percent)
in the 2016 ACS.
PROFILE OF RENTER HOUSEHOLDS Household incomes for renters are lower than for owners. According
Despite the changing composition of renter household growth over the to the American Community Survey, the median income for cash
past decade, households that rent their housing differ in systematic renters in 2016 was $37,300—more than 49 percent below the medi-
ways from those that own homes (Figure 11). In particular, renters tend an income of owners of $73,100. In addition, two-thirds of all renter
to be younger, with a median age of 40 in 2016 compared with 56 for households (30.5 million) were in the bottom half of the income
homeowners. Rentership rates decline with age, dropping from more distribution (below the US median household income). As measured
than two-thirds (68 percent) of households under age 35 to less than a by HUD’s Worst Case Housing Needs 2017 Report to Congress, 64
quarter (24 percent) of households age 55 and over. Nevertheless, the percent of renters had low incomes (80 percent or less of area medi-
overall aging of the population has meant that one in three renters is ans) and 26 percent had extremely low incomes (30 percent or less
now over the age of 50. of area medians).
Although the majority of renter households are white, the minority In addition to their lower incomes, renter households have very
share of renters (47 percent) is twice that of homeowners. As mea- little savings and wealth. The latest Survey of Consumer Finances
sured by the Current Population Survey, rentership rates of Hispanic, indicates that the median net worth of renter households was only
black, and all other minority households are higher than for whites $5,000 in 2016, a small fraction of the median owner’s net worth of
FIGURE 11
Renters Are More Likely than Owners to Be Young, Low Income, and Single
Share of Households (Percent)
100 100 100
90 90 90
80 80 80
70 70 70
60 60 60
50 50 50
40 40 40
30 30 30
20 20 20
10 10 10
0 0 0
Renters Owners Renters Owners Renters Owners
Age of Household Head Household Income Household Type
■ Under 25 ■ 55–64 ■ Under $15,000 ■ $45,000–74,999 ■ Single Person
■ 25–34 ■ 65 and Over ■ $15,000–29,999 ■ $75,000 and Over ■ Married/Partnered without Children
■ 35–54 ■ $30,000–44,999 ■ Other Family/Nonfamily
■ Families with Children
Note: Families with children include any household with a child under the age of 18.
Source: JCHS tabulations of US Census Bureau, 2016 American Community Survey 1-Year Estimates.
10 AMERICA’S RENTAL HOUSING 2017$230,000. The median amount of cash savings held by renters was Higher-income households are more apt to rent in high-cost hous-
similarly low at just $800, compared with $7,300 for owners. ing markets (Figure 12). This makes the renter population in these
areas somewhat more economically diverse than the US average.
The discrepancy in wealth is even greater among households headed However, these metros still have large numbers of low-income
by adults age 65 and over, who generally need to draw down their renters and the highest rates of renting among low-income
assets in retirement. The median net wealth of older renters was households.
$6,700 in 2016, compared with a median for older homeowners of
$319,200. Not all of this difference is due to housing wealth, however. Given their greater income diversity, renters in high-cost metros
The non-housing wealth of renters in all age groups is also several are also more diverse in terms of household type. Nearly half (45
times lower than that of homeowners. percent) of all married couples with children that live in Los Angeles
and San Diego rent their housing. By comparison, the share of mar-
ried couples with children that rent is just 15 percent in Pittsburgh
THE GEOGRAPHY OF RENTING and 18 percent in Philadelphia. At the same time, high-cost markets
The 2016 American Community Survey indicates that just under tend to have larger shares of nontraditional households, which may
half (46 percent) of all renter households reside in principal cities of include extra workers to help afford the high rents. For example,
metropolitan areas. By comparison, about a quarter (26 percent) of households with three or more adults made up 13 percent of renter
homeowner households live in these locations. households nationally in 2015, but 23 percent in the Los Angeles
metro area.
Among the nation’s 100 largest metro areas, the highest rentership rates
are in high-cost markets such as Los Angeles (52 percent) and New York
City (49 percent), as well as in fast-growing areas such as Las Vegas (49 RENTING THROUGH THE LIFECYCLE
percent) and Austin (42 percent). The shares of renters are much smaller The vast majority of households rent at some point in their lives.
in low-cost and slow-growth areas like Detroit (32 percent), Grand Rapids According to a JCHS analysis of the Panel Study of Income Dynamics
(29 percent), and Pittsburgh (31 percent). Rentership rates are also (PSID), about half (49 percent) of owners under age 60 in 2015 had
relatively low in metros with large shares of older householders, such as been renters at some point within the previous 20 years. Among
Cape Coral, Deltona, and several other Florida metros, consistent with owners under age 50, the share was even higher at nearly three-
the high homeownership rates among this age group. quarters (72 percent).
FIGURE 12
Renting Is More Common in High-Cost Housing Markets, Especially Among Higher-Income Households
Rentership Rate (Percent)
80
70
60
50
40
30
20
10
0
Less than $15,000 $15,000–29,999 $30,000–44,999 $45,000–74,999 $75,000 or More Total
Household Income
Largest 100 Metros ■ 10 Highest-Cost Metros ■ Middle 80 Metros ■ 10 Lowest-Cost Metros ■ Rest of US
Note: Metros are the 100 largest by population as defined in the 2016 American Community Survey.
Source: JCHS tabulations of US Census Bureau, 2016 American Community Survey 1-Year Estimates using the Missouri Census Data Center MABLE/Geocorr14.
21
JOINT CENTER FOR HOUSING STUDIES OF HARVARD UNIVERSITY 11FIGURE 13
Over the Next Ten Years, Aging of the Baby Boomers and Millennials Will Drive Growth in Renter Households
Renter Households (Millions)
7
6
5
4
3
2
1
0
Under 25 25–29 30–34 35–39 40–44 45–49 50–54 55–59 60–64 65–69 70–74 75–79 80 and Over
Age of Household Head
■ 2006 ■ 2016 ■ 2025
Note: JCHS projection for 2025 assumes homeownership rates by five-year age group and race/ethnicity hold at current values.
Sources: JCHS tabulations of US Census Bureau, Current Population Surveys; JCHS 2016 Household and Tenure Projections.
Without the downpayment and other costs entailed in buying and help to shape many of the factors that determine rates of renting
selling homes, renting is often an affordable housing option for and owning, including housing affordability, mortgage accessibil-
young adults. Indeed, the 2015 American Housing Survey shows that ity, labor markets, and household incomes. As a starting point,
86 percent of all newly formed households were renters. Low trans- though, future rental demand depends on the rate of household
action costs also make renting a good choice for households that growth. JCHS projections suggest that overall household growth will
move frequently. As measured by the Current Population Survey, be strong over the next 10 years as increasing numbers of the large
renters accounted for three out of four residential moves in 2016, as millennial generation reach adulthood (Figure 13). At the same time,
well as for the majority of moves made by all age groups. the aging of the baby-boom generation will lift the number of older
households. Household growth is therefore expected to total 13.6
But renting is not merely a life phase or a steppingstone to home- million in 2015–2025, before moderating to 11.5 million in 2025–2035
ownership for all households. The JCHS analysis of PSID data when losses of older households begin to accelerate.
also indicated that 17 percent of renters in 1995 remained rent-
ers through 2015. In addition, 23 percent of homeowners in 1995 Despite the aging of the adult population (which tends to favor high-
switched to renting sometime in the ensuing two decades, often in er homeownership rates), certain other demographic forces should
response to changes in family structure and other life events. For support healthy growth in rental demand. Over the next 10 years,
instance, renters made up over 80 percent of recent movers who the younger half of the millennial generation—the largest genera-
were divorced or separated. Other owners shifted to renting to have tion in US history—will move into their 20s and 30s, the age groups
less responsibility for home maintenance. This preference, along most likely to rent. In addition, minority households are expected to
with the desire to downsize or to meet accessibility needs, is reflect- account for nearly three-quarters of household growth in 2015–2025
ed in the increasing shares of renters among the oldest age groups. and fully 90 percent in 2025–2035. If minority homeownership rates
PSID data indicate that 1 in 12 owners age 55–64, 1 in 8 owners age remain at current levels, the national rentership rate will increase
65–74, and 1 in 5 owners age 75 and over made own-to-rent transi- in the coming decades.
tions between 2005 and 2015.
Taking all of these forces into account, the base scenario from the
2016 JCHS household tenure projections shows that, if homeowner-
THE OUTLOOK ship rates stabilize at their 2015 levels, underlying demographics—
Given the sharp swings in rentership rates over the past two that is, growth and change in the composition of US households by
decades, predicting future rental demand is difficult. Shifting age, race/ethnicity, and family type—will support the addition of 4.7
preferences, macroeconomic conditions and government policy million renters and 8.9 million homeowners between 2015 and 2025.
12 AMERICA’S RENTAL HOUSING 20173 | R E N TA L H O U S I N G S T O C K
The nation’s rental housing comes in all SNAPSHOT OF THE RENTAL STOCK
JCHS analysis of the 2016 American Community Survey indicates
structure types, sizes, prices, and locations. that the rental stock comprises 47.1 million units, or 35 percent of
the national housing supply. Just under 44 million of these units are
But with the recent growth in high-income currently occupied. Of the 3.4 million units that are vacant, 82 per-
renter households, most additions to the cent are available for rent while the remaining 18 percent are rented
but unoccupied.
stock have been at the upper end of the
It is a common misconception that rental housing consists almost
market. In contrast, the supply of rentals entirely of apartments in multifamily buildings. In fact, multifamily
units account for 61 percent (28.9 million units) of the nation’s rental
affordable to low- and moderate-income stock, distributed across various-sized properties. Single-family
homes make up a substantial—and, until recently, fast-growing—
households has not kept pace with growth in
share of rentals (Figure 14). This stock includes 13.1 million detached
demand, contributing to the spread of housing homes, 2.9 million attached homes, and 2.1 million mobile homes,
RVs, and similar dwellings.
cost burdens. At the same time, the rising
Nearly half (46 percent) of all renter-occupied units are located in
costs of land, materials, and construction the principal cities of metro areas, 42 percent in surrounding sub-
urban communities, and the remaining 12 percent in non-metro
make development of lower-rent units areas. Types of rental housing vary substantially by location, with
increasingly difficult. large apartment buildings of at least 20 units concentrated in urban
areas and single-family rentals found primarily in suburban and
non-metro areas.
GEOGRAPHIC VARIATION IN SUPPLY
In the nation’s 100 largest metros (home to almost 70 percent of all
US households), detached single-family homes make up 24 percent
of the rental stock while attached single-family units add another
7 percent. The remaining units are in multifamily structures, with
17 percent in small buildings of 2–4 units, 24 percent in mid-sized
buildings of 5–19 units, and 25 percent in large buildings of 20 or
more units. Mobile homes provide another 2 percent of the housing
stock in the largest metros.
But given differences in topography, density of development, and
average age of the stock, the mix of rental housing varies widely
across metro and rural areas. For example, detached single-family
21
JOINT CENTER FOR HOUSING STUDIES OF HARVARD UNIVERSITY 13FIGURE
FIGURE2214 rentals make up just
FIGURE 30 8 percent of rentals in Boston, but 51 percent
in Stockton (Online Figure 2). Over a third (35 percent) of Boston’s rental
Single-Family Homes Now Account for Well Over stock consists of units in buildings with 2–4 apartments. Another
One-Third of the Nation’s 47 Million Rental Units 22 percent of rentals are in buildings with 5–19 units, 29 percent
Share of National Rental Stock are in buildings with 20 or more units, and the remaining 6 percent
are divided between attached single-family homes (5 percent) and
Multifamilies
with 2–4 Units mobile homes and other structures (1 percent). In contrast, just over
18% 10 percent of the rental units in Stockton are in buildings with 2–4
Single-Family
Homes
units, 14 percent are in buildings with 5–19 units, and slightly more
39%
than 12 percent are in buildings with 20 or more units. Attached
Multifamilies single-family homes (10 percent of the rental stock) and mobile
with 5–19 Units homes (just under 3 percent) are somewhat more common in
22%
Lorem
Stockton ipsum
than in Boston.
In rural areas (as defined by the US Census Bureau), the rental stock
Multifamilies with 20 primarily consists of single-family homes. Indeed, almost three-
or More Units
21% quarters of rural rentals are single-family units. The highest con-
centrations of single-family rentals are in New Mexico (89 percent
Notes: Stock estimates include renter-occupied units, vacant units for rent, and rented but unoccupied units.
Single-family homes include detached and attached units, mobile homes, and units such as RVs and boats. of the rural stock) and Oregon (86 percent). But even in states with
Source: JCHS tabulations of US Census Bureau, 2016 American Community Survey 1-Year Estimates.
the smallest shares (Massachusetts, New Hampshire, and Vermont),
single-family homes still make up about half of rural rentals.
Mobile homes are also an important component of the rural
FIGURE 15
rental stock, contributing fully 20 percent of rural rental housing
nationwide. At the state level, however, mobile homes are much
Individual Investors Are the Largest Owners of Rental Stock,
more common in the rural communities of South Carolina (39
with Most of Their Units Concentrated in Small Buildings
percent of the stock) and North Carolina (36 percent) than in the
Share of Rental Units (Percent)
rural areas of Hawaii (0.4 percent of the stock) and Massachusetts
100
(2.0 percent).
90
80
70
60 OWNERSHIP OF RENTAL HOUSING
50
Individual investors are the largest group of rental housing owners,
40
followed by business entities such as limited partnerships (LPs),
30
20 limited liability companies (LLCs), and limited liability partnerships
10 (LLPs). Individual investors primarily own single-family rentals
0 and small apartment properties, while LPs, LLCs, and LLPs own a
All Units 1 Unit 2–4 Units 5–49 Units 50 or More Units
majority of large apartment properties. As a result, individuals own
Structure Type three-quarters of rental properties (74 percent) but just under half
Ownership ■ Individual Investor ■ REIT/Real Estate Corporation of the nation’s rental units (48 percent), while business entities own
■ LLP/LP/LLC ■ Non-Profit or Co-op 15 percent of rental properties but a third of units (Figure 15). Housing
■ All Other cooperatives and nonprofit organizations own 2 percent of rental
Note: All other includes tenants in common, general partnerships, trustees for estate, and units for which properties and 4 percent of rental units, while real estate corpora-
ownership was not reported. tions and investment trusts own 1 percent of rental properties and 5
Source: JCHS tabulations of US Census Bureau, 2015 Rental Housing Finance Survey.
percent of rental units. The remaining 8 percent of properties and 10
percent of units are under other forms of ownership, such as trustee
for estate, tenant in common, and general partnership.
The latest Rental Housing Finance Survey reports that the single-
family ownership share of individual investors slipped from 83 per-
14 AMERICA’S RENTAL HOUSING 2017cent in 2001 to 76 percent in 2015 as institutional investors gained BUILDING AGE AND ACCESSIBILITY
a foothold in the market. But this decline in individual ownership The median age of occupied rental units in 2015 was 42 years—
likely overstates institutional investment in single-family rentals. somewhat higher than the median of 37 years for owner-occupied
Indeed, real estate corporations and investment trusts owned only homes. The age gap between owned and rented units has been
250,000 single-family rentals in 2015. In addition, many individual growing since 1985, when both types of units had an average age of
investors reportedly transferred ownership of their properties to 23 years. This disparity reflects the slowdown in rental construction
LLCs in recent decades to protect against legal problems and to take in the 1990s following the booms of the 1970s and 1980s, as well
advantage of tax benefits. as significant construction of owner-occupied housing in the early
2000s. In addition, a minor but still sizable share (8 percent) of rental
Along with shifting patterns of ownership, motivations for acquir- housing was built before 1920. With the recent uptick in multifamily
ing single-family rental units may have also changed. While there construction since 2015, however, the age gap between owned and
is little research available on this topic, one study suggests that rental units may be narrowing.
prior to the housing market crash, the two major reasons that
owners bought single-family rentals were as primary residences, Today, the oldest units in the occupied rental stock are apartments
which they then decided to rent, or as income-generating invest- in multifamily buildings with 2–4 units (median age of 51 years) and
ments. However, the housing boom and bust encouraged more detached single-family homes (median age of 49 years). The typical
speculation in the single-family rental market, including by mom- renter-occupied single-family home is 10 years older than the typical
and-pop owners, which may mark a shift in their expectations. owner-occupied home. Meanwhile, apartments in buildings with 20
Institutional owners also jumped into the single-family rental or more units had a median age of 38 years in 2015, and the typical
market after the bust, but their longer-term presence in the mar- mobile home rental had the lowest median age of 29 years.
ket is unclear.
Older rental housing is more likely than newer housing to have qual-
Understanding the evolving nature and financial motivations of ity and safety issues that may jeopardize the health of occupants.
rental property owners is important for designing policies that Under HUD definitions, 13 percent of occupied rental units built
protect naturally occurring affordable units that may be at risk before 1940 have physical inadequacies, compared with 6 percent
of either under-investment and deterioration or of upgrading and of units built in 1990 or later. Although overall inadequacy rates for
gentrification. In both cases, these units would be lost from the renter-occupied housing are low (9 percent), they are still more than
low-cost stock. double those for owner-occupied homes (4 percent).
FIGURE 16
Larger Multifamily Properties Attract a Significant Share of Older Renters
Share of Renters (Percent)
50
45
40
35
30
25
20
15
10
5
0
Under 25 25–34 35–44 45–54 55–64 65–74 75 or Over
Age of Household Head
Structure Type ■ Single-Family Home ■ Multifamily with 2–4 Units ■ Multifamily with 5–19 Units ■ Multifamily with 20 or More Units
Note: Single-family homes include detached and attached units, mobile homes, and other units such as RVs and boats.
Source: JCHS tabulations of US Census Bureau, 2016 American Community Survey 1-Year Estimates.
21
JOINT CENTER FOR HOUSING STUDIES OF HARVARD UNIVERSITY 15FIGURE 17
Low-Cost Rentals Are More Evenly Distributed Across Building Types than High-Cost Rentals
Rental Units (Millions)
4.0
3.5
3.0
2.5
2.0
1.5
1.0
0.5
0.0
Under $650 $650–849 $850–1,099 $1,100–1,499 $1,500 and Over
Monthly Housing Cost
Structure Type ■ Single-Family Home ■ Multifamily with 2–4 Units ■ Multifamily with 5–19 Units ■ Multifamily with 20 or More Units ■ Mobile Home/Other
Notes: Monthly housing costs include rent and utilities. Rental units exclude vacant units and units where no cash rent is paid. Single-family homes include attached and detached units. Other structures include units such as boats and RVs.
Source: JCHS tabulations of US Census Bureau, 2016 American Community Survey 1-Year Estimates.
Another limitation of older rental units is that they are seldom renter-occupied accessible units, with only 2.0 percent offering
accessible to households with mobility or other physical challenges. no-step entry, single-floor living, and extra-wide hallways and
As of 2011, only 3 percent of rental units provided three basic uni- doors, followed by the South (3.3 percent), West (3.4 percent), and
versal design features (extra-wide hallways and doors, bedroom and Midwest (3.6 percent). While no-step entries and single-floor liv-
bathroom on the entry level, and a no-step entrance). Newer and ing are more common in the South and West, in no region does
larger buildings, however, tend to offer more of these amenities: one- the share of units with extra-wide hallways and doors exceed the
fifth of apartments in buildings with 50 or more units dating from single digits.
1990 or later provided all three features. Given that accessibility
needs increase with household age, it is therefore unsurprising that
about half of the renters age 75 and over live in larger apartment VARIATION IN RENTS
buildings (Figure 16). The median monthly housing cost (including rent and utilities) for
all occupied rental units was $981 in 2016. Location is perhaps the
Accessibility features are less common in the single-family and strongest determinant of cost. In the high-priced San Francisco
smaller multifamily rental stocks. Just 2.4 percent of renter-occupied metro area, for example, well over half (62 percent) of occupied
detached single-family homes and apartments in buildings with 2–4 units rent for more than $1,500 per month, compared with 17 per-
units have the three basic universal design features, along with 2.5 cent in mid-priced Dallas and just 5 percent in low-cost Cleveland
percent of attached single-family homes and 1.2 percent of mobile (Online Figure 3). The median rent for a detached single-family home,
homes. The fact that the majority (52 percent) of renters in the typically the most expensive type of rental unit, was $2,125 in San
75-and-over age group live in single-family homes and apartments Francisco, $1,240 in Dallas, and $920 in Cleveland.
in small buildings is cause for concern because these rental units
are unlikely to provide the accessiblity features that would enable Monthly rents vary widely by structure type, ranging from $890 for
tenants to age safely in place. apartments in buildings with 2–4 units, to $1,070 for those in build-
ings with 50 or more units, to $1,087 for single-family homes. Rents
The availability of rentals with accessibility features varies by also vary with age of the home, with the newest ones (built in 2014
region. With its older stock of primarily small properties and or later) commanding the highest median rents ($1,318) and those
multi-story structures, the Northeast has the lowest share of built in the 1970s the lowest ($915).
16 AMERICA’S RENTAL HOUSING 2017You can also read


