American Gas to the Rescue? - THE IMPACT OF US LNG EXPORTS ON EUROPEAN SECURITY AND R USSIAN FOREIGN POLICY - Columbia | SIPA Center on ...
←
→
Page content transcription
If your browser does not render page correctly, please read the page content below
American Gas to the Rescue?
T H E I M PA C T O F U S L N G E X P ORT S ON E UROP E A N S E CURI T Y
AND RUSSIAN FOREIGN POLICY

By Jason Bordoff an d Trevor Houser
SEPTEMB ER 2 0 1 4
b | CHAPTER NAME
ABOUT THE CENTER ON GLOBAL ENERGY POLICY
The Center on Global Energy Policy provides independent, balanced, data-driven analysis to help policymakers
navigate the complex world of energy. We approach energy as an economic, security, and environmental concern.
And we draw on the resources of a world-class institution, faculty with real-world experience, and a location in
the world’s finance and media capital. Visit us at energypolicy.columbia.edu
facebook.com/ColumbiaUEnergy twitter.com/ColumbiaUEnergy
ABOUT THE SCHOOL OF INTERNATIONAL AND PUBLIC AFFAIRS
SIPA’s mission is to empower people to serve the global public interest. Our goal is to foster economic growth,
sustainable development, social progress, and democratic governance by educating public policy professionals,
producing policy-related research, and conveying the results to the world. Based in New York City, with a student
body that is 50 percent international and educational partners in cities around the world, SIPA is the most global
of public policy schools. For more information, please visit www.sipa.columbia.edu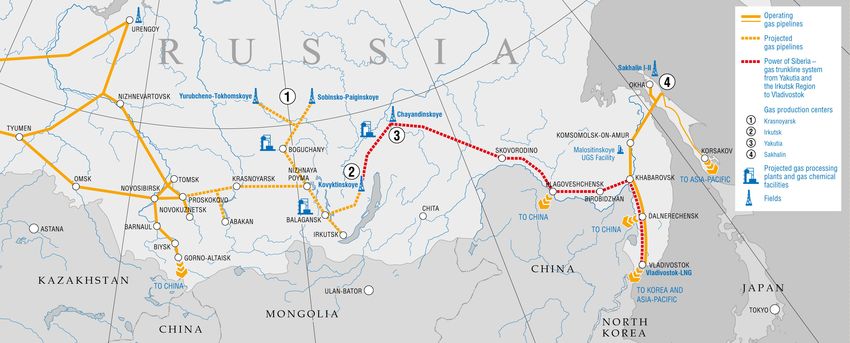
AMERICAN GAS TO THE RESCUE?
T H E I M PA C T O F U S L NG E X P ORT S ON E UROP E A N S E CURI T Y
A N D R US S I A N FORE I GN P OLI CY
By Jason Bor doff and Trevor Houser*
SE P TE MBE R 2014
*Jason Bordoff, a former White House energy adviser to President Barack Obama, is a professor and the founding
director of the Center on Global Energy Policy at Columbia University. Trevor Houser, partner at the Rhodium
Group (RHG) and visiting fellow at the Peterson Institute for International Economics, formerly served as a Senior
Advisor at the US State Department.
Columbia University in the City of New York
energypolicy@columbia.edu | SEPTEMBER 2014 | 1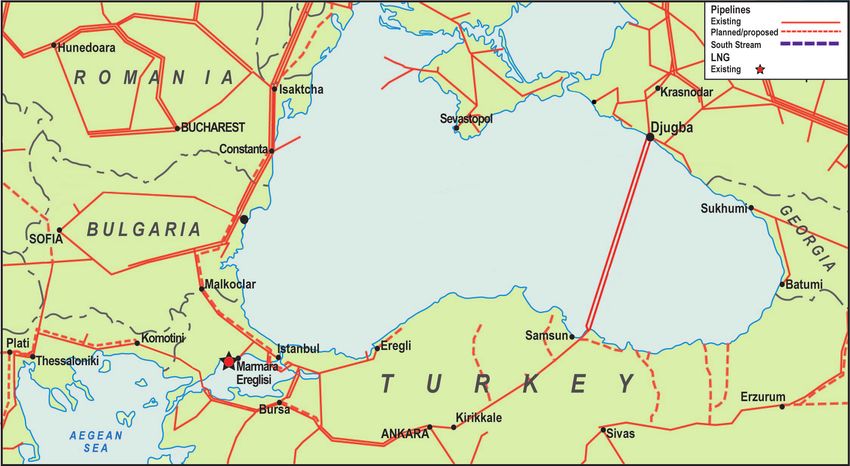
AMERICAN GAS TO THE RESCUE?
ACKNOWLEDGEMENTS
For exceptional research assistance, the authors wish to thank Akos Losz and Shashank Mohan.
For very helpful comments on earlier drafts of this paper, the authors thank Edward Morse, Lasz-
lo Varro, Stephen Sestanovich, Timothy Frye, Jonathan Stern, Carlos Pascual, Nick Butler, John
Knight, Edward Kott, James Henderson, and Charif Souki. The authors thank Matthew Robinson
for excellent editorial work.
2 | CENTER ON GLOBAL ENERGY POLICY | COLUMBIA SIPA
AMERICAN GAS TO THE RESCUE?
EXECUTIVE SUMMARY
As Western governments have responded to Russia’s al years. Terminals pending approval, if con-
continued efforts to destabilize Ukraine, the potential for structed, will not be available until after 2020.
US natural gas exports to inflict economic pain on Mos-
• Although US LNG exports increase Europe’s
cow and undermine its influence in Europe have made for
bargaining position, they will not free Eu-
some eye-catching headlines—try searching the Internet
rope from Russian gas. Russia will remain Eu-
for “hit Putin where it hurts” or “get Putin’s attention”
rope’s dominant gas supplier for the foresee-
for a sampling. To cut through the hyperbole surrounding
able future, due both to its ability to remain
this issue, the Columbia University Center on Global En-
cost-competitive in the region and the fact that
ergy Policy undertook a study that provides a cool-headed
US LNG will displace other high-cost sources
examination of the impact of US LNG exports on Euro-
of natural gas supply. In our modeling we find
pean energy security and Russian foreign policy. The key
that 9 billion cubic feet per day (93 billion cu-
findings include:
bic meters per year) of gross US LNG exports
• The US shale gas boom has already helped results in only a 1.5 bcf/d (15 bcm) net addi-
European consumers and hurt Russian produc- tion in global natural gas production.
ers by expanding global gas supply and free-
• By forcing state-run Gazprom to reduce prices
ing up liquefied natural gas (LNG) shipments
to remain competitive in the European mar-
previously planned for the US market. This
ket, US LNG exports could have a meaningful
has strengthened Europe’s bargaining position,
impact on total Russian gas export revenue.
forcing contract renegotiations and lowering
While painful for Russian gas companies, the
gas prices. US LNG exports will have a similar
total economic impact on state coffers is un-
effect.
likely to be significant enough to prompt a
• Over the long term, US exports, along with change in Moscow’s foreign policy, particularly
growth in LNG supply from other countries in the next few years.
such as Australia, will create a larger, more liq-
uid and more diverse global gas market. This
will increase supply options for Europe and
other gas consumers, and give them even more
leverage in future negotiations with Russia and
other producers. Maximizing the benefits of
this opportunity, however, requires changes in
European policy and infrastructure that focus
on reducing vulnerability to Russian supply
disruption, not only dependence on Russian
gas overall.
• While there are important longer-term benefits
for Europe from US LNG exports, they are not
a solution to the current crisis. Those terminals
already approved will not be online for sever-
energypolicy@columbia.edu | SEPTEMBER 2014 | 3
TABLE OF CONTENTS
ACKNOWLEDGEMENTS ..................................................... 2 US LNG projects will displace higher cost projects
elsewhere, limiting supply growth
EXECUTIVE SUMMARY ...................................................... 3 Central and Eastern Europe lack infrastructure to
receive LNG volumes
INTRODUCTION .................................................................. 6 Russia’s revenues from gas exports are low and
provide little leverage for the West
AMERICA’S NATURAL GAS TURNAROUND ...................... 8
US domestic gas boom redirects global LNG supplies THE EUROPEAN SIDE OF THE LEDGER.......................... 35
Rising gas production will make the US a major Invest in infrastructure for Central and Eastern Europe
LNG exporter Apply EU competition law to promote an integrated
European gas market
EUROPE’S NATURAL GAS DILEMMA .............................. 12 Expand Europe’s underground gas storage capacity
Europe remains heavily dependent on Russian and pooled reserves
pipeline gas supplies Increase European gas development
Russia-Ukraine disputes over gas prices threaten Create incentives to boost energy efficiency and cut
supply stability gas demand
THE BENEFITS OF THE US SHALE GAS BOOM.............. 16 CONCLUSION ................................................................... 42
Global supply boost helped Europe renegotiate some
gas contracts APPENDIX I ....................................................................... 43
Retroactive compensations costly for Gazprom Model documentation
European Commission antitrust probe could force major
contract changes APPENDIX II ...................................................................... 46
US LNG exports may head to Asia, but consumer Gazprom Gas Deliveries by Country
benefits are global
Low cost of US brownfield LNG projects allow US terminal NOTES ............................................................................... 47
operators to offer better contract terms for buyers
US LNG contract terms may create flexibility and liquidity BIBLIOGRAPHY................................................................. 55
in global market
Europe has significant spare LNG import capacity to take
more supply
MODELING THE EFFECT OF FUTURE US LNG
SUPPLY............................................................................ 25 BOXES
Europe sees biggest economic gains from US LNG, Spot versus oil-indexed prices in Europe.......................... 16
while Russia the most pain The Russia-China gas deal ............................................... 19
Several factors will mute the impact of US LNG on Implications of US LNG exports for Asian gas markets ....... 20
European energy security Modeling............................................................................. 25
Exports of US LNG are years away from start up The importance of South Stream....................................... 37
4 | CENTER ON GLOBAL ENERGY POLICY | COLUMBIA SIPAAMERICAN GAS TO THE RESCUE?
FIGURES TABLES
Figure 1: US natural gas production and prices................... 8 Table 1: Proposed US LNG export terminals..................... 11
Figure 2: Net US natural gas imports................................... 9 Table 2: Renegotiations of gas supply contracts
Figure 3: Natural gas prices by region............................... 10 with Gazprom................................................................... 17
Figure 4: The relative role of natural gas .......................... 12 Table 3: US LNG export terminals with firm
Figure 5: Share of total US and EU energy investment plans.............................................................. 28
consumption met through imported gas.......................... 13 Table 4: Russia-Europe pipeline capacity.......................... 32
Figure 6: Share of 2012 EU energy demand met Table 5: Proposed Central and Eastern European
through imported gas, by country.................................... 13 LNG import terminals....................................................... 33
Figure 7: EU natural gas imports by supplier..................... 14 Table 6: The significance of oil and gas exports
Figure 8: European gas prices, spot vs. Gazprom............. 18 to the Russian economy................................................... 34
Figure 9: Wholesale gas price formation of traded
natural gas volumes......................................................... 20 MAP
Figure 10: European LNG import capacity and utilization...... 24 Map 1: Gazprom’s natural gas export pipeline system
Figure 11: European LNG Import capacity vs. to China............................................................................ 19
Russian gas imports......................................................... 24 Map 2: The Ukrainian and the Yamal-Europe gas
Figure 12: Change in annual natural gas expenditures pipeline system................................................................. 36
by value............................................................................ 26 Map 3: The Blue Stream and the proposed South
Figure 13: Change in annual natural gas expenditures Stream pipelines............................................................... 37
by percent......................................................................... 26
Figure 14: Change in annual natural gas export
revenue by value............................................................... 27
Figure 15: Change in annual natural gas export
revenue by percent........................................................... 27
Figure 16: Impact of US LNG on European gas suppliers..... 29
Figure 17: Impact of 9 bcf/d of US LNG exports
on global gas supply........................................................ 30
Figure 18: Impact of 18 bcf/d of US LNG exports on
global gas supply............................................................. 30
Figure 19: Marginal cost of natural gas suppliers
to Europe.......................................................................... 31
Figure 20: Russian government revenue from natural
gas exports....................................................................... 34
Figure 21: Russian long-term contract gas prices to
European countries 2010-2013........................................ 38
Figure 22: Energy intensity in selected economies
in the EU and FSU regions............................................... 41
energypolicy@columbia.edu | SEPTEMBER 2014 | 5AMERICAN GAS TO THE RESCUE?
INTRODUCTION
In the last several months, as Western governments have There are a number of reasons for US policy makers
put in place sanctions in response to Russia’s takeover of and the public to support US LNG exports. By 2020,
Crimea and continued efforts to destabilize Ukraine, the the global natural gas market is likely to look quite dif-
question of the role energy has played in the crisis has ferent than it does today. While LNG supply is rel-
been raised frequently, both in terms of the cause of the atively tight currently, a significant increase in global
crisis but also as a solution. In particular, policymakers supply projected by the end of the decade will create
and experts have asked if the recent surge in US natural a more liquid, diverse global gas market. The United
gas production could be used to achieve the twin objec- States, along with Australia, will play a key role in that
tives of inflicting economic pain on Moscow and under- transformation, particularly given the lack of destina-
mining its influence in Europe by providing the region tion clauses in at least some, if not most, US LNG ex-
an alternative source of energy supply to Russian gas. port contracts. This will allow for more competition
The resulting discussion has suffered from a bit of hy- in the global market, putting downward pressure on
perbole—try searching the Internet for “hit Putin where prices and giving gas-importing nations more leverage
it hurts” or “get Putin’s attention” for a sampling.1 As with traditional suppliers.
Washington considers further actions to respond to Rus-
While these are important long-term benefits for Eu-
sian aggression, including potential changes to US ener-
rope, US gas will not provide a solution to the current
gy export policy, and Europe looks for ways to weaken
crisis for at least three reasons. First, those US LNG ter-
Moscow’s energy leverage, a cool-headed examination of
minals already approved will take years to come online,
the potential impact of US liquefied natural gas (LNG)
and the terminals still pending approval would not be
exports is required. This paper aims to provide such an
available until after 2020.
examination.
Second, even in the longer term, while US LNG exports
In short, we find that the US shale gas boom has already
can increase European negotiating leverage, they will
helped European and other gas consumers and hurt
not free Europe from Russian gas, as much of the recent
Russian gas producers by freeing up LNG imports the
rhetoric has suggested. In our modeling, the amount of
United States was projected to need before the advent
European gas imports from Russia is little changed by
of the shale revolution. Even though European LNG
US LNG exports. That is not only because of long-term
imports have declined in recent years, and Russian ex-
contract obligations, but also because Russian gas will
ports have reached all-time highs, the additional global
likely remain the most economically competitive source
gas supply that has resulted from the US shale boom
of gas into European markets. Moreover, Russian sup-
has strengthened Europe’s bargaining position with
ply is still needed as US LNG exports add much less to
Russian suppliers. US LNG export terminals already
global gas supply on net than the gross quantity export-
approved and under development will continue to im-
ed. Rising US gas exports will push down world prices
prove that negotiating power and provide the region
and crowd out other higher cost sources of natural gas
with more supply options. Additional LNG terminals,
supply. Thus, in our modeling we find that 9 billion cu-
were they to be approved, financed, and constructed,
bic feet per day (93 billion cubic meters per year)2 of
would have an even greater effect, especially if coupled
gross US LNG exports results in only a 1.5 bcf/day (15.5
with much-needed policy and infrastructure changes
bcm) net addition to global natural gas supply.
by Europe.
6 | CENTER ON GLOBAL ENERGY POLICY | COLUMBIA SIPAAMERICAN GAS TO THE RESCUE?
While US LNG exports can increase European negotiating
leverage, they will not free Europe from Russian gas, as much
of the recent rhetoric has suggested.
Third, while US LNG exports could have a meaningful
impact on Russian gas revenue and on state-run Gaz-
prom by lowering prices, gas revenue is a small share
of the country’s overall export revenue and even smaller
share of GDP. As such, the economic pain imposed on
Russia by US LNG exports is unlikely to be significant
enough to prompt a change in its foreign policy, partic-
ularly in the next few years.
While US LNG exports help support European energy
security, there are even more important steps Europe can
take itself to reduce Russian leverage. These include ex-
panding pipeline and storage capacity, boosting domes-
tic energy production, increasing energy efficiency, and
continuing to promote an integrated, liberalized Euro-
pean energy market. Realistically such efforts should be
aimed at reducing vulnerability to short-term Russian
supply disruptions rather than attempting to eliminate
Russian gas imports all together.
energypolicy@columbia.edu | SEPTEMBER 2014 | 7AMERICAN GAS TO THE RESCUE?
AMERICA’S NATURAL GAS TURNAROUND
US DOMESTIC GAS BOOM REDIRECTS GLOBAL production has expanded by 17 bcf/d (175 bcm), or 34%,
LNG SUPPLIES due almost entirely to output from shale plays3 (Figure 1).
This production growth resulted in a sharp decline in nat-
The combination of three technological innovations rev-
ural gas prices, from $8 per mmBtu on average in 2008 at
olutionized natural gas production in the United States
the wellhead to an average of of $2.7 per mmBtu in 2012
over the past decade. Hydraulic fracturing allowed compa-
—the lowest annual level since 1999—before rebounding
nies to extract gas from shale and other low permeability
to a mid-$4 per mmBtu range.4 As US natural gas prices
formations previously considered inaccessible. Horizontal
fell and global oil prices remained high, producers began
drilling increased the amount of shale that can be “fracked”
applying the same combination of horizontal drilling,
from a single well pad. Improvements in seismic imaging
hydraulic fracturing, and seismic imaging to liquids-rich
gave companies far better information on where to drill.
shale formations. Drilling activity in the US gradually
A surge in natural gas prices in the early 2000s prompt-
shifted from gas-rich to liquids-rich shale plays, such as the
ed companies to begin applying these three innovations
Bakken and the Eagle Ford. However, natural gas output
at scale in the Barnett, Haynesville, and Fayetteville shale
has continued to expand thanks to the associated gas ex-
deposits—and the result was dramatic. Proven natural gas
tracted alongside oil in these areas, the development of the
reserves have grown by more than 50% since 2005, and
Figure 1: US natural gas production and prices
70 $9
Production (Left Axis)
65 $8
Wellhead Prices (Right Axis)
$7
60
Real 2013 USD per MMBTU
$6
BIllion cubic feet per day
55
$5
50
$4
45
$3
40
$2
35 $1
30 $0
1971
1973
1975
1977
1979
1981
1983
1985
1987
1989
1991
1993
1995
1997
1999
2001
2003
2005
2007
2009
2011
2013
Source: Bureau of Economic Analysis, 2014; EIA Natural Gas Gross Withdrawals and Production, 2014.
8 | CENTER ON GLOBAL ENERGY POLICY | COLUMBIA SIPAAMERICAN GAS TO THE RESCUE?
vast Marcellus shale gas play in the Northeast, and efficien- the world’s top LNG exporter.9 In anticipation of growing
cy gains that have lowered production costs.5 US demand for imported gas, companies constructed 11
LNG importing terminals along the US Gulf Coast and
This dramatic growth in production has resulted in a sharp
East Coast,10 and LNG exporters around the world, par-
drop in the US energy trade deficit. Not long ago, the
ticularly in Angola and Qatar, invested in new liquefaction
United States was the world’s largest natural gas importer.
capacity to supply the growing US market.
At 10 bcf/d in 2005 (103 bcm), net imports accounted
for 16% of US natural gas consumption.6 Most US gas By 2013, however, net US natural gas imports had fallen
imports were supplied through pipelines from Canada, but to 3.7 bcf/d (38 bcm) thanks to the shale boom, the low-
the United States was also projected to become one of the est level since 1989,11 and are now half Japan’s levels and
largest importers of liquefied natural gas (LNG).7 less than Germany’s or Italy’s.12 Net imports accounted for
only 5% of total consumption, compared to the 29% fore-
In its 2005 Annual Energy Outlook (AEO), the US En-
cast by the EIA in 2005, almost none of which came from
ergy Information Administration (EIA) projected net US
LNG.13 The 9.4 bcf/d (97 bcm) of LNG the US was pro-
natural gas imports would grow to almost 17 bcf/d (175
jected to import by 2013 is now available for other global
bcm)8 by 2013 (Figure 2). Expectations were that the vast
consumers. This is a significant realignment in the context
majority of this import growth would be met with LNG.
of a global LNG trade of 31 bcf/d (322 bcm)14 and came
In the 2005 AEO, US LNG imports were projected to
as the Fukushima disaster in 2011 significantly increased
reach 9.7 bcf/d (100 bcm) by 2013—nearly as much as the
Japanese LNG demand as nuclear power plants were taken
current 10.3 bcf/d (106 bcm) of LNG exports by Qatar,
off line.15
Figure 2: Net US natural gas imports
Billion cubic feet per day
Source: EIA Annual Energy Outlook 2005, Monthly Energy Review, 2014.
energypolicy@columbia.edu | SEPTEMBER 2014 | 9AMERICAN GAS TO THE RESCUE?
RISING GAS PRODUCTION WILL MAKE THE US tries with which the United States has signed a free trade
A MAJOR LNG EXPORTER agreement (FTA) exports are automatically “deemed con-
sistent with the public interest.”19 The Federal Energy
In addition to eliminating the need for LNG imports,
Regulatory Commission (FERC) must also approve the
the US is now in a position to become one of the world’s
LNG terminal itself, and is charged with assessing and
largest LNG exporters. In 2005, US natural gas prices at
mitigating any environmental or public safety concerns
Henry Hub were higher than what European or Japanese
posed by terminal construction or operation.
importers paid for LNG (Figure 3). By 2013, Henry Hub
prices were less than one-third of European levels and less As of July 2014, the DOE received 43 applications for
than one-quarter of Japanese levels.16 The average spread permission to export LNG from a total of 34 proposed
between US Henry Hub and Japanese LNG import prices terminal projects (Table 1).20 Almost all of these appli-
in 2013 was more than $12 per mmBtu. The International cations have been approved for FTA countries. Yet of
Energy Agency in its World Energy Outlook 2013 esti- the 18 countries with which the United States has an
mated liquefaction and transport costs from the US Gulf FTA requiring national treatment for trade in natural
Coast to Japan at $5 to $8 per mmBtu, which would im- gas,21 only six—South Korea, Singapore, Mexico, Can-
ply a healthy $4 to $7 per mmBtu arbitrage opportunity.17 ada, Chile, and the Dominican Republic—currently
These potential profits have spurred interest from a num- import LNG, with Korea accounting for more than
ber of companies to build LNG export terminals, in many 79% of the total demand from that group in 2013.22
cases by repurposing idle LNG import facilities. Korea’s 5.2 bcf/d (54 bcm) LNG import market is rel-
atively large, but not nearly enough to absorb all US
The DOE must find that such importation or exporta-
gas exports.23 Therefore, access to non-FTA countries—
tion is “consistent with the public interest.”18 For coun-
Figure 3: Natural gas prices by region
USD per mmBtu
$18
US (Henry Hub)
$16 Germany (Average Import Price, CIF)
Japan (LNG Import Price, CIF)
$14
$12
$10
$8
$6
$4
$2
$0
1991
1993
1995
1997
1999
2001
2003
2005
2007
2009
2011
2013
Source: BP Statistical Review of World Energy 2014.
10 | CENTER ON GLOBAL ENERGY POLICY | COLUMBIA SIPAAMERICAN GAS TO THE RESCUE?
especially those in Asia where demand is rapidly grow- now consider whether to give final approval to any proj-
ing—is considered essential to making US LNG proj- ect that has received final FERC authorization—the
ects viable, and most companies also have applied for intention being to allow commercial considerations to
permission to export to non-FTA countries. As of Au- signal to DOE which projects are most viable. If the
gust 2014, the DOE had conditionally approved seven projects conditionally approved by the DOE were to
projects with a combined 10.5 bcf/d (109 bcm) of ex- be built, the US would be vying with Australia to be
port capacity for sale to non-FTA countries, and FERC the world’s second largest LNG exporter after Qatar,
had authorized three, totaling 5.7 bcf/d (59 bcm).24 depending on the timing and ramp-up of liquefaction
DOE recently eliminated conditional approvals from plants in Australia.26 Another 27 bcf/d (279 bcm) of US
its national interest determination process.25 DOE will LNG capacity is still pending approval.
Table 1: Proposed US LNG export terminals
Non-FTA Capacity DOE FTA DOE Non-FTA FERC
Terminal Project Location (Bcf/d) Application Status Application Status Application Status
Sabine Pass LNG Train 1-4 LA 2.2 Approved Approved Approved
Freeport LNG TX 1.8 Approved Approved Approved
Cameron LNG LA 1.7 Approved Approved Approved
Lake Charles LNG LA 2.0 Approved Approved Filed
Dominion Cove Point LNG MD 0.77 Approved Approved Filed
Jordan Cove LNG OR 0.8 Approved Approved Filed
Oregon LNG OR 1.25 Approved Approved Filed
Gulf LNG MS 1.5 Approved Under Review Filed
Elba Island LNG GA 0.35 Approved Under Review Filed
Excelerate LNG TX 1.38 Approved Under Review Filed
Golden Pass LNG TX 2 Approved Under Review Filed
Corpus Christi LNG TX 2.1 Approved Under Review Filed
CE FLNG, LLC LA 1.07 Approved Under Review Filed
Magnolia LNG LA 1.08 Approved Under Review Filed
Sabine Pass LNG Train 5-6 LA 1.38 Approved Under Review Filed
Louisiana LNG LA 0.28 Pending Approval Under Review Filed
Gulf Coast LNG TX 2.8 Approved Under Review Not Filed
Carib Energy - 0.06 Approved Under Review Not Filed
Main Pass Energy Hub Gulf of Mexico 3.22 Approved Under Review Not Filed
Waller LNG Services TX 0.19 Approved Under Review Not Filed
Pangea LNG TX 1.09 Approved Under Review Not Filed
Gasfin Development LA 0.2 Approved Under Review Not Filed
Venture Global LNG LA 0.67 Approved Under Review Not Filed
Eos LNG LA 1.6 Approved Under Review Not Filed
Barca LNG LA 1.6 Approved Under Review Not Filed
Delfin LNG Gulf of Mexico 1.8 Approved Under Review Not Filed
Texas LNG TX 0.27 Approved Under Review Not Filed
SB Power Solutions - 0.07 Approved Not Filed Not Filed
Advanced Energy Solutions FL 0.02 Approved Not Filed Not Filed
Argent Marine Management AL 0.003 Approved Not Filed Not Filed
Annova LNG TX 0.94 Approved Not Filed Not Filed
Strom Inc. - 0.02 Pending Approval Under Review Not Filed
Venture Global LNG LA 0.67 Pending Approval Under Review Not Filed
Alturas LLC TX 0.2 Pending Approval Not Filed Not Filed
SCT&E LNG LA 1.6 Pending Approval Not Filed Not Filed
Source: DOE and FERC, current as of July 31, 2014.
energypolicy@columbia.edu | SEPTEMBER 2014 | 11AMERICAN GAS TO THE RESCUE?
EUROPE’S NATURAL GAS DILEMMA
EUROPE REMAINS HEAVILY DEPENDENT ON imports has grown over the past decade, up from 12% in
RUSSIAN PIPELINE GAS SUPPLIES 2002 (Figure 5).
Europe’s natural gas position stands in stark contrast to Within the EU dependence on imported natural gas var-
that of the US. The 28 member states of the European ies widely by country (Figure 6). Italy meets a third of its
Union (EU) are slightly less natural gas dependent on energy needs with imported natural gas, while Lithuania
average than the United States, with 24% of total energy is closer to 38%, according to Eurostat data.27 Germany
consumption supplied through natural gas, compared to is slightly above the EU average at 19%, while France is
30% in the US (Figure 4). The share of total EU en- slightly below at just under 15%. Denmark and the Neth-
ergy demand met through imported gas is considerably erlands, on the other hand, are natural gas exporters.
higher, however, 15% for the EU compared to 2% for
Of the two-thirds of total EU natural gas demand met
the United States in 2013. And while US dependence on
through net imports in 2013, nearly 90% came by pipe-
imported gas has fallen from a high of 5% of total ener-
line (Figure 7).28 Russia is the largest single source of Eu-
gy consumption in 2002, European dependence on gas
Figure 4: The relative role of natural gas
Total gas and imported gas as a share of total energy consumption, 2013
70% 65.2% 65.2%
Natural Gas / Total Energy Consumption
60%
Net Gas Imports / Total Energy Consumption
50%
40% 34.5%
29.6%
30% 23.5%
19.7%
20% 15.6%
10%
1.9%
0%
-10%
-20%
-30%
US Canada EU Belarus Ukraine Russia Japan Korea China India Latin Middle Africa
America East
Source: BP Statistical Review of World Energy 2014.
12 | CENTER ON GLOBAL ENERGY POLICY | COLUMBIA SIPAAMERICAN GAS TO THE RESCUE?
Figure 5: Share of total US and EU energy consumption met through imported gas
18%
16% US EU
14%
12%
10%
8%
6%
4%
2%
0%
1971
1977
1980
1983
1986
1989
1992
1995
1998
2001
2007
2010
2013
1974
2004
Source: BP Statistical Review of World Energy 2014.
Figure 6: Share of 2012 EU energy demand met through imported gas, by country
50%
40% 37.5%
33.3%
30% 27.8% 27.7% 26.7%
25.5% 25.4%
23.7% 22.1%
18.9% 17.7%
20% 17.4% 15.5% 15.5%
14.6% 13.2%
11.8%
9.6% 8.9% 8.8% 10.0% 10.1%
10% 6.0%
2.0%
0.0% 0.0%
0%
-10%
-9.4%
-20%
-30%
-29.9%
-40%
Austria
Belgium
Bulgaria
Croatia
Cyprus
Czech Republic
Estonia
Finland
France
Germany
Greece
Ireland
Latvia
Lithuania
Luxembourg
Malta
Netherlands
Poland
Portugal
Romania
Slovakia
Slovenia
Spain
Sweden
United Kingdom
Denmark
Italy
Hungary
Source: Eurostat.
energypolicy@columbia.edu | SEPTEMBER 2014 | 13AMERICAN GAS TO THE RESCUE?
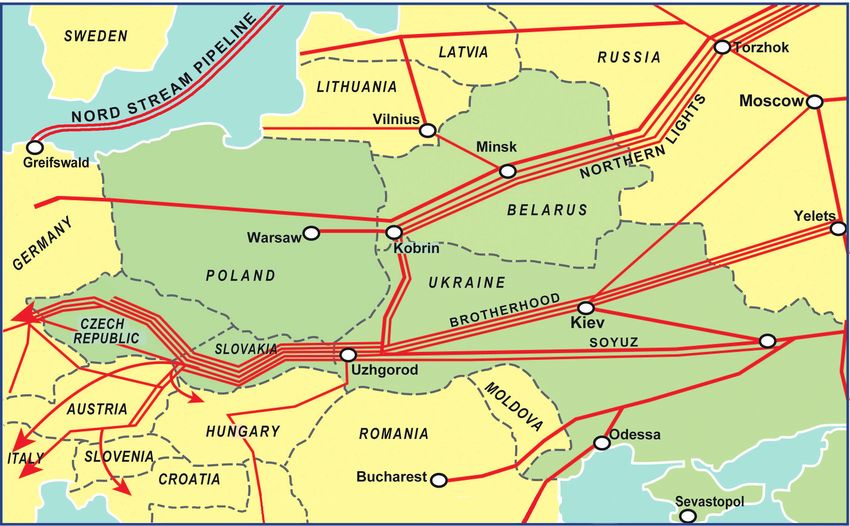
ropean pipeline gas imports and accounted for more than RUSSIA-UKRAINE DISPUTES OVER GAS PRICES
one-third of total EU gas supply in 2013.29 In addition, THREATEN SUPPLY STABILITY
Russia is a critical swing supplier for the region, meeting
Price disputes between Russia and Ukraine resulted in
demand during periods of higher consumption. Most
the disruption of Russian supplies to the EU in 2006
Russian gas reaches Europe through Belarus and Ukraine,
and 2009. Russia cut off gas supply to Ukraine again
which rely on Russia far more than most EU members for
energy. In Ukraine, 34% of total primary energy demand in June 2014 in an escalation of the most recent pricing
is met with gas, about 56% of which came from Russian dispute. Gazprom insists gas shipments will not resume
imports in 2013.30 Belarus is even more reliant on gas, until Ukraine pays off a debt of $4.5 billion, but Kiev is
which accounts for 65% of total energy consumption, all demanding lower gas prices first.34 Gazprom has contin-
of which is purchased from Russia.31 Russia traditionally ued to deliver supplies to Europe via Ukraine, but supply
sold gas to these transit countries at far lower prices than risks remain and it is unclear how the standoff will be
to consumers within the EU. Moscow still rewards Belarus resolved.
with discounted gas prices for the country’s participation Ukraine has filled roughly half its existing storage and
in Russia’s Eurasian customs union.32 The discounted gas
three-quarters of its targeted volume to protect against
price offered to Ukraine in December 2013 was also in-
winter disruptions. Presently, it has adequate storage to
tended as an incentive to convince Kiev to join the Rus-
meet domestic consumption some way into the winter
sia-led trade bloc.33
Figure 7: EU natural gas imports by supplier
Billion cubic meters, 2013
160
140 Pipeline
LNG
120
100
80
136.2
60
102.4
40
20 24.8
23.0
2.1 9.7 1.5 2.2
0 0.2 0.2 5.2 5.6
US Norway Russia Algeria Egypt Oman Libya Nigeria Qatar Peru Trinidad &
Tobago
Source: BP Statistical Review of World Energy 2014.
14 | CENTER ON GLOBAL ENERGY POLICY | COLUMBIA SIPAAMERICAN GAS TO THE RESCUE?
Presently, Ukraine has adequate storage to meet domestic
consumption some way into the winter (perhaps January or
February), but increased storage supplies are still needed to
both satisfy domestic demand and ensure stable seasonal
supplies into Europe. Ukraine may face potentially life-
threatening gas shortages, particularly if this winter is
unusually cold.
(perhaps January or February), but increased storage change in its attitude by adversely impacting the Rus-
supplies are still needed to both satisfy domestic de- sian economy.
mand and ensure stable seasonal supplies into Europe.35
Next we will assess the potential benefits of US
Ukraine may face potentially life-threatening gas short-
LNG exports in achieving these objectives and the role that
ages, particularly if this winter is unusually cold. Re-
energy can play in the broader US response to the crisis.
verse pipeline flows into Ukraine from the EU can help
replace some of the imports from Russia. Reversed lines
from Poland and Hungary, as well as an upgrade of an
unused pipeline from Slovakia,36 could meet up to 1.65
bcf/d (17 bcm) 37 of Ukraine’s 4.35 bcf/d (45 bcm) of
demand.38
Gazprom has threatened to reroute the gas around Ukraine
if it suspects Ukraine of stealing any of the transit supplies
of gas for its own use, and plans to increase injections into
underground storage in the EU to ensure customers there
continue to receive adequate supplies. But such measures
cannot fully compensate for the Ukrainian loss, as about
a third of Russian gas shipments to Europe will have to
be transported via Ukraine, even if Gazprom ramps up
transport volumes through its Nord Stream pipeline to full
capacity.39
Given both Ukraine’s and the EU’s dependence on Rus-
sian gas, and the importance of energy exports to the
Russian economy, it is logical that policymakers, both
in Europe and the US, are exploring the extent to which
US LNG exports can help resolve the current crisis by
providing Europe with an alternative source of natural
gas supply and thus reducing Moscow’s leverage over
both Ukraine and EU member states, and prompting a
energypolicy@columbia.edu | SEPTEMBER 2014 | 15AMERICAN GAS TO THE RESCUE?
THE BENEFITS OF THE US SHALE GAS BOOM
GLOBAL SUPPLY BOOST HELPED EUROPE natural gas prices in Europe put considerable pressure on
RENEGOTIATE SOME GAS CONTRACTS Europe’s traditional gas suppliers, particularly Russia’s Gaz-
prom, to amend their oil-indexed price formulas, or ease
The US natural gas revolution has already undermined the
volumetric commitments tied to take-or-pay obligations.
profits of Russian producers and benefitted European con-
These take-or-pay contracts require a customer to pay for a
sumers. The displacement of 9.4 bcf/d (97 bcm) of LNG
certain amount of natural gas, whether they take the gas or
supply that resulted from the US shale boom coincided
not. This is generally a high percent of contracted volumes.
with a period of sharply reduced European gas demand,
due to the great recession in 2009 and the subsequent Euro Statoil, one of the major gas suppliers to the European
crisis from 2010.40 Oil prices rebounded quickly following market, was the first to respond, introducing spot gas in-
the crisis, but natural gas prices in Europe remained low, dexation in most of its European contracts.41 Gazprom was
due in large part to this additional supply of LNG. This is initially less flexible in re-negotiating contracts, and insist-
significant as most long-term gas contracts are indexed to ed on maintaining oil-indexed pricing. However, most
the price of oil, a pricing system that emerged in the 1960s of Gazprom’s large European customers were eventually
when oil and refined products were the natural competi- granted considerable gas price discounts—partly by link-
tion for gas. The divergence between oil-indexed and spot ing a small percentage of the contracted volumes to hub
SPOT VERSUS OIL-INDEXED PRICES IN EUROPE
The divergence of oil-indexed and spot natural gas pric- ternational crude oil futures were settling into the current,
es in Europe in recent years was initially the result of the historically high average range of over $100 per barrel, a
6 to 9 month lag embedded in most oil-indexed pricing level which continues to bolster oil-indexed gas prices.
formulas, which were originally put in place to protect gas
Under the so-called take-or-pay obligations included in
consumers in the event of an oil shock. At the beginning
long-term gas contracts, major European utilities were re-
of 2009, oil-indexed gas prices still reflected record-high
quired to pay for more expensive oil-indexed gas than they
oil prices seen two quarters earlier, while spot prices were
actually needed after the recession, while cheaper spot gas
deeply depressed from the recession and the growing
was readily available in the global LNG market. The sus-
glut of LNG previously destined for US shores.1
tained gap between spot and oil indexed gas prices threat-
The period of low oil prices proved remarkably short-lived ened the profitability of the European utility sector, and
in 2009, and the effect of the temporary oil price collapse eventually forced consumers and suppliers to the table to
remained relatively muted in the 6 to 9 month rolling av- re-negotiate oil-indexed gas contracts across Europe.3
erage levels used in oil-indexed gas price formulas. The
The original rationale for linking oil and gas prices in Eu-
Fukushima disaster in Japan diverted some of the flexible
ropean gas supply contracts—that end-users had a real
LNG volumes away from Europe, and thus contributed
choice between burning gas and oil products and could
to a significant increase in European spot gas prices in
thus respond to price changes—is no longer relevant, and
2011.2 However, spot prices on average were still about
the emergence of spot gas markets increasingly allows for
15% lower than oil-indexed gas prices in 2011, when in-
gas prices to be based on the supply and demand for gas.4
16 | CENTER ON GLOBAL ENERGY POLICY | COLUMBIA SIPAAMERICAN GAS TO THE RESCUE?
Table 2: Renegotiations of gas supply contracts with Gazprom
Company Primary Market Year Renegotiation Details
E.On Germany 2010 15% spot pricing included in LT contract (for 3 years)
Eni Italy 2010 15% spot pricing included in LT contract (for 3 years)
GDF Suez France 2010 15% spot pricing included in LT contract (for 3 years)
Edison Italy 2011 Agreement reached out of court on price discount and total compensation of $290 mn for FY 2011
Eni Italy 2012 Price discount, more flexibility in take-or-pay volumes and retroactive compensation for FY 2011 agreed
Verbundnetz Gas Germany 2012 Ca. 10% price discount (lower P0) negotiated (for 3 years)
GDF Suez France 2012 Ca. 10% price discount (lower P0) negotiated (for 3 years)
Wingas Germany 2012 Ca. 10% price discount (lower P0) negotiated (for 3 years)
SPP Slovakia 2012 Ca. 10% price discount (lower P0) negotiated (for 3 years)
Botas Turkey 2012 Ca. 10% price discount (lower P0) negotiated (for 3 years)
Econgas Austria 2012 Ca. 10% price discount (lower P0) negotiated (for 3 years)
Sinergie Italiane Italy 2012 Ca. 10% price discount (lower P0) negotiated (for 3 years)
E.On Germany 2012 Arbitration started, agreement on ca. 7-10% discount and $1.3 retroactive compensation
PGNiG Poland 2012 Arbitration started, agreement on ca. 10% discount and $930 mn retroactive compensation for FY 2011 and 2012
RWE Transgas Czech Republic 2013 Arbitration court awarded ca. $1.3 bn compensation
Eni Italy 2013 Price discount of ca. 7% agreed for FY 2013
Lietuvos Dujos Lithuania 2014 Negotiated 20% price discount for renewed contract post-2014
Eni Italy 2014 100% spot indexation in all LT contracts from FY 2014
Source: Center on Global Energy Policy based on industry and press reports.
prices, typically 15%, and partly by introducing discounts cluding France’s GDF Suez, Italy’s Eni, Germany’s Wingas,
within the existing oil-indexed formulas (Table 2). These Austria’s Enagas, Slovakia’s SPP, Turkey’s Botas, and Poland’s
re-negotiations were not always consensual and often took PGNiG, among others.46 Germany’s RWE settled its pricing
place in arbitration courts.42 dispute with Gazprom in arbitration court, while a similar
arbitration proceeding with Italy’s Edison is still ongoing.
The costs for Gazprom were substantial. Starting in 2009, the
Although the renegotiated contract terms are not always
company agreed to significant concessions on pricing terms in
made public, various media reports suggest that the amount
its long-term gas supply contracts with European customers.
of these discounts ranged between 7% and 10%.47 Based on
As a first step in a long series of contract renegotiations, Gaz-
2013 delivery data, our estimates suggest that the agreed dis-
prom allowed three of its largest European customers, namely
counts reduce Gazprom’s revenues by about $5 billion each
E.On, GDF Suez, and Eni, to link 15% of their contract-
year,48 although it is not clear whether these discounts will
ed gas volumes to spot gas prices instead of the traditional
be extended beyond the current 3-year price review period.
oil product linkage for a limited period of 3 years.43 Some of
these contracts were later further amended.44
Other European utilities soon followed suit and started re- RETROACTIVE COMPENSATIONS COSTLY
negotiating existing gas contracts with Gazprom. European FOR GAZPROM
long-term gas supply contracts typically contain provisions
Gazprom also agreed to pay an estimated $4.4 billion in
for the periodic revision of contract terms. These price re-
retroactive compensation to various European gas buyers
view clauses allow the contracting parties to adjust the base
through the end of 2013, according to the company’s fi-
prices (P zero) and indexation formulas every three years
nancial statements.49 As of the end of 2013, Gazprom al-
if market conditions changed materially during the last re-
ready paid out $3.5 billion in cash refunds for earlier gas
view period.45 Between 2011 and 2014, Gazprom agreed
deliveries to its European customers.50 Some of the awards
to review pricing formulas and reduce prices with most of
disclosed in company filings and news reports were indeed
its European customers, initially for a period of three years.
substantial. The retroactive adjustment paid to Poland’s
These price renegotiations took the form of price discounts PGNiG, for example, was worth $930 million,51 covering
through adjustments to the pricing formula and retroactive the 2011 and 2012 financial years. E.On’s compensation
compensation to Gazprom’s main European customers, in- agreed in 2012 was nearly $1.3 billion.52
energypolicy@columbia.edu | SEPTEMBER 2014 | 17AMERICAN GAS TO THE RESCUE?
Beyond the initial agreement allowing spot indexation for can also be attributed to the changing gas supply landscape.
15% of contracted volumes with its biggest customers in The EU Commission initiated the antitrust proceedings
2010, Gazprom proved reluctant to introduce more spot to investigate whether Gazprom abused its monopolistic
indexation in its long-term gas contracts during later re- position in Central and Eastern Europe to impose higher
negotiation rounds, using base price adjustments for pro- pricing, prevent the resale of gas, and hinder the diversifica-
viding discounts instead. However, in May 2014, Eni and tion of supply in the region.57 Gazprom’s pricing practices
Gazprom announced that they had changed the basis of and the rigidities that the Commission suspects may remain
price indexation in all of their long-term gas supply con- in some of the company’s long-term gas supply contracts
tracts53 to “fully align it with the market.”54 Most market in Central and Eastern Europe—especially destination
commentators and media outlets interpreted this to mean restrictions for Russian gas considered illegal under Euro-
essentially the complete abandonment of oil-indexation and pean competition rules—appeared far more onerous with
a conversion of all of Eni’s contracts to spot gas indexation. the increasing supply of lower-priced spot gas to Western
A Sanford C. Bernstein report suggests that Eni’s renegoti- European gas hubs. Large Western European utilities were
ated index formula will be linked to spot gas prices at Italy’s also quicker in winning price concessions and retroactive
PSV (Punto di Scambio Virtuale) gas hub.55 The changes compensation from Gazprom, which temporarily increased
will apply retroactively from the beginning of 2014, and are the regional differences in the pricing of Russian gas. In
estimated to have a $760 million positive impact on the op- 2012, for example, delivered Russian gas prices decreased
erating profit of Eni’s gas and power division this year.56 in Germany and stayed flat for France and Austria.58 In the
same year, Hungary, Slovakia, and the Czech Republic faced
sharply higher prices for Russian gas.59
EUROPEAN COMMISSION ANTITRUST PROBE
An adverse antitrust ruling may further weaken Gazprom’s
COULD FORCE MAJOR CONTRACT CHANGES
market position by requiring the company to eliminate
Potential fines resulting from the European Commission’s any remaining destination restrictions, or possibly even to
antitrust probe against Gazprom, which started in 2012, replace oil-indexation with hub-based pricing formulas in
Figure 8: European gas prices, spot vs. Gazprom
16 100%
Gazprom Realized Price in Europe ($/MMBtu)
14 NBP ($/MMBtu)
80%
Spread (%)
12
60%
10
40%
8
20%
6
0%
4
2 -20%
0 -40%
2005 2006 2007 2008 2009 2010 2011 2012 2013
Source: BP Statistical Review of World Energy 2014, Gazprom.
18 | CENTER ON GLOBAL ENERGY POLICY | COLUMBIA SIPAAMERICAN GAS TO THE RESCUE?
THE RUSSIA-CHINA GAS DEAL
Gazprom’s weakened hand in the European gas market tract prices.4 The recent agreement suggests Gazprom
may have pushed Russian negotiators towards a swift likely conceded on pricing as a result of both diminished
conclusion of a gas deal with China, following more than market prospects in Europe and growing tensions with
10 years of unsuccessful talks. In May 2014, Gazprom the West, while China achieved a price level close to Eu-
inked a 30-year supply agreement to sell China National ropean spot prices, which it has targeted throughout the
Petroleum Corp. (CNPC) 3.7 bcf/d (38 bcm) of gas starting negotiations.
in 2019. The feed gas for the new Russia-China pipeline
1
It is important to note that China and Europe will not
will be sourced from new East Siberian developments,
compete for the same Russian gas supplies, and the
notably from Gazprom’s Kovykta and Chayanda fields.
current Russia-China gas deal will not give Gazprom
Gazprom will invest $55 billion to develop these giant
the option of diverting gas from Europe to China. The
greenfield projects, with China ponying up $25 billion in
Kovykta and Chayanda gas fields, which will feed the
advance payments to assist in this effort.2
new Russia-China gas link, are greenfield development
Pricing details have not been disclosed, but industry an- projects located far from the European market, and
alysts estimate the implied gas price in the contract at would not be developed absent a pipeline to China.
between $350 and $390 per thousand cubic meters, or Another proposed Russia-China pipeline, the so-called
between $10 and $11 per mmBtu.3 This is roughly in line “western pipeline route” connecting West Siberian gas
with what Gazprom’s European customers pay and con- fields with China’s western border, could later enable
siderably lower than current LNG import prices in Asia. Russia to physically divert gas supplies from Europe to
Previous negotiations reportedly failed because Gazprom China.5 This project is not covered in the recent gas
demanded prices closer to Asian LNG levels, while China contract, and negotiations on the western Russia-China
was unwilling to pay even the much lower European con- route are in a relatively early stage.
Map 1: Gazprom’s natural gas export pipeline system to China
Source: Gazprom.
energypolicy@columbia.edu | SEPTEMBER 2014 | 19AMERICAN GAS TO THE RESCUE?
all of its long-term supply contracts. The antitrust case may competition authority rules against Gazprom, however,
also result in substantial fines of up to 10% of the compa- the company may still appeal to the European Court of
ny’s annual revenues in the markets in question. Morgan Justice, which could delay the final ruling by several years.
Stanley estimates that Gazprom’s annual revenue from the
The renegotiation of Russian gas contracts recently caused
markets covered by the investigation (Poland, Czech Re-
spot and oil-indexed gas prices in Europe to converge (Fig-
public, Slovakia, Hungary, Bulgaria, Estonia, Latvia and
ure 8) and Gazprom’s pricing premium has been squeezed.
Lithuania) is in the region of $17 billion, which implies
In addition, Gazprom’s share price continues to perform
a maximum fine of about $1.7 billion.60 Even if the EU’s
IMPLICATIONS OF US LNG EXPORTS FOR ASIAN GAS MARKETS
The Asia Pacific region is the larg- Figure 9: Wholesale gas price formation of traded natural gas volumes
est market for imported LNG and Bcm/year, gas-on-gas competition % of total
will become the largest concentrat-
1,200
ed gas consuming region by 2035,
39%
surpassing North America and Eu- 1,000 Gas-on-Gas Competition Oil Indexed & Other
26%
rope, according to the IEA.1 How- 800
ever, the Asia Pacific region lacks
600
a competitive gas market, and the 16% 48%
prospects of developing a suffi- 400
15%
ciently liquid gas trading hub that 200 100%
100%
16%
could establish a reliable price
0
signal for the region remain limited 2007 2013 2007 2013 2007 2013 2007 2013
North America Europe Asia Pacific World
by institutional barriers and inflexi-
bilities in the long-term take-or-pay
Source: IGU Wholesale Gas Price Survey.
contracts. While competitive gas-
to-gas pricing of natural gas is gaining ground globally, These prevent the resale of natural gas cargoes in other
with the most significant progress towards competitive markets, where they might fetch a higher price, thereby
gas pricing made in Europe, the share of competitive- hindering the convergence of regional gas prices and
ly-priced gas in Asia remains stagnant at around 15% stiffening the whole LNG supply chain. New LNG ex-
since 2007 due to the rigidities of LNG supply and de- port terminals in the US will offer full destination flexi-
mand in the region (Figure 9). Long-term oil-indexed
2
bility for their mainly Asian buyers, thereby introducing
LNG supply contracts are still the predominant form of a large volume of flexible LNG supplies to the Asia Pa-
pricing gas in Asia, and the majority of short-term and cific market.4 This will allow buyers to demand greater
spot LNG contracts are also priced in reference to oil-in- destination flexibility from other suppliers, and will put
dexed prices, or negotiated in a highly non-transparent pressure on sellers to offer LNG on more flexible terms
manner on a cargo-by-cargo basis.3 eventually. While this will take time, the IEA estimated in
a recent study that almost 50% of the Asian LNG supply
US LNG exports will encourage more competition in
contracts that were in place in 2013 will have expired
Asian gas markets by increasing diversity of supply and
by 2017,5 creating opportunities for buyers to introduce
liquidity. More importantly, these supplies are flexible in
more flexibility in renewed contracts just as US LNG ex-
their destination. One of the key impediments for the
ports start to ramp up.
emergence of a competitive market is the prevalence of
destination clauses in long-term Asian LNG contracts.
20 | CENTER ON GLOBAL ENERGY POLICY | COLUMBIA SIPAAMERICAN GAS TO THE RESCUE?
well below its pre-recession levels, due to a combination resale restrictions in the contracts provides Europeans with
of diminished pricing power in Europe, growing compe- increased optionality, so the gas can be brought to Europe
tition in the Russian domestic gas market from Novatek when prices there are higher or to meet seasonal demand.
and Rosneft, the liberalization of Russia’s LNG market, the
Even if not a single drop of US LNG finds its way to
relentless pursuit of value-destroying geopolitical projects
Europe, however, additional US LNG exports will impact
like the South Stream pipeline, and a substantial over-in-
European gas markets. Expanding the amount of LNG
vestment in upstream production capacity.61
available globally will further increase consumer leverage
in price negotiations and put downward pressure on global
gas prices. And the more US gas Asian customers purchase,
US LNG EXPORTS MAY HEAD TO ASIA, BUT
the less gas they buy from other LNG suppliers, expanding
CONSUMER BENEFITS ARE GLOBAL
the set of non-Russian options available in Europe.
As previously mentioned, if the LNG export terminals already
approved by the Department of Energy are built and fully
utilized, the United States could add another 10.5 bcf/d (109 LOW COST OF US BROWNFIELD LNG PROJECTS
bcm) to global LNG markets in the coming years beyond the ALLOW US TERMINAL OPERATORS TO OFFER
9.4 bcf/d (97 bcm) already freed up by the drop in US LNG BETTER CONTRACT TERMS FOR BUYERS
import demand. Export capacity of around 8-9 bcf/d (83-93
Were all the 10.5 bcf/d (109 bcm) of currently approved
bcm) is also consistent with the 5 to 7 US projects many pri-
US LNG capacity added to the market it could replace two-
vate forecasters expect would be economic to build.62
thirds of current European gas imports from Russia, either
When assessing how this additional supply might shape en- directly through sales to Europe or indirectly by displacing
ergy economics and geopolitics in Europe, it is important to supply previously destined for the Asian market. However, as
note that Asia will be the likely destination for a large share discussed in greater detail later, the actual addition of supply
of US LNG exports. Delivered LNG prices are higher in to world markets will be limited as higher cost production
Asia than in Europe (Figure 3) as traditional Asian import- will not be able to compete. In addition, the actual amount
ing countries like Japan and Korea lack meaningful domes- of US LNG will depend on how much capacity the indus-
tic gas production and have been willing to pay a premium try finds economic to build. The recent changes to DOE’s
for secure LNG supply. Moreover, Japanese and Korean util- export policy that remove the requirement that projects
ities generally have greater ability to pass on high natural gas seeking to export to non-FTA countries obtain conditional
prices to consumers than their European peers. Emerging authorizations will allow commercial considerations to bet-
Asian LNG markets, most importantly in China, are also ter signal to DOE which projects are most viable and able
paying a premium for LNG relative to European consum- to finance completion of the FERC authorization process.
ers.63 Despite the increased time and cost required to move
The economic viability of the proposed US LNG terminal
LNG from the US Gulf Coast to Asia, current price spreads
projects and their level of progress vary considerably. Almost
make it the most commercially attractive destination for
all the terminals that have received approval thus far are so-
US gas. The expansion of the Panama Canal will also shave
called brownfield projects looking to outfit existing import
about a dollar off the cost of shipping LNG from the Atlan-
terminals with liquefaction equipment. The capital invest-
tic Basin to Asia.64 Indeed, more than half of the long-term
ment required to add liquefaction facilities to already opera-
offtake agreements from prospective US LNG terminals
tional import terminals is considerably lower than building
were signed by large Asian import agents or utilities, such as
a new liquefaction terminal from scratch.67 The primary
Japan’s Osaka Gas and Korea’s Kogas.65
reason for the lower capital cost is that much of the infra-
Some US LNG will reach European shores—Cheniere, for structure, including pipelines, storage tanks, loading berths
example, has contracts with Centrica in the UK and two and marine loading arms, is already in place. During the
Spanish utilities66—although on a regular basis the gas is previous decade, an estimated $100 billion was invested in
likely to be resold into the Asian market given existing ar- these underutilized US LNG import terminals.68
bitrage opportunities. Still, the absence of destination or
energypolicy@columbia.edu | SEPTEMBER 2014 | 21You can also read