An Accurate Clinical Implication Assessment for Diabetes Mellitus Prevalence Based on a Study from Nigeria - MDPI
←
→
Page content transcription
If your browser does not render page correctly, please read the page content below

processes
Article
An Accurate Clinical Implication Assessment for
Diabetes Mellitus Prevalence Based on a Study
from Nigeria
Muhammad Noman Sohail 1, * , Ren Jiadong 1 , Musa Uba Muhammad 1 ,
Sohaib Tahir Chauhdary 2 , Jehangir Arshad 2 and Antony John Verghese 3
 1    Department of Information Sciences and Technology, Yanshan University, Qinhuangdao 066000, China;
      jdren@ysu.edu.cn (R.J.); musaubamuhammad@stumail.ysu.edu.cn (M.U.M.)
 2    Department of Electrical and Computer Engineering, COMSATS University Islamabad, Islamabad 43600,
      Pakistan; sohaibchauhdary@hotmail.com (S.T.C.); jehangir@cuisahiwal.edu.pk (J.A.)
 3    Department of Management, American Hotel and Lodging Association, New York, NY 10006, USA;
      antomatter@gmail.com
 *    Correspondence: mn.sohail@stumail.ysu.edu.cn; Tel.: +86-1503-237-0085

 Received: 9 April 2019; Accepted: 10 May 2019; Published: 15 May 2019

 Abstract: The increasing rate of diabetes is found across the planet. Therefore, the diagnosis
 of pre-diabetes and diabetes is important in populations with extreme diabetes risk. In this
 study, a machine learning technique was implemented over a data mining platform by employing
 Rule classifiers (PART and Decision table) to measure the accuracy and logistic regression on
 the classification results for forecasting the prevalence in diabetes mellitus patients suffering
 simultaneously from other chronic disease symptoms. The real-life data was collected in Nigeria
 between December 2017 and February 2019 by applying ten non-intrusive and easily available clinical
 variables. The results disclosed that the Rule classifiers achieved a mean accuracy of 98.75%. The error
 rate, precision, recall, F-measure, and Matthew’s correlation coefficient MCC were 0.02%, 0.98%, 0.98%,
 0.98%, and 0.97%, respectively. The forecast decision, achieved by employing a set of 23 decision
 rules (DR), indicates that age, gender, glucose level, and body mass are fundamental reasons for
 diabetes, followed by work stress, diet, family diabetes history, physical exercise, and cardiovascular
 stroke history. The study validated that the proposed set of DR is practical for quick screening of
 diabetes mellitus patients at the initial stage without intrusive medical tests and was found to be
 effective in the initial diagnosis of diabetes.

 Keywords: data mining; cluster; clinical implications; diabetes; epidemiology; forecast; PART;
 Decision table; Weka; real-life patients; regression; machine learning

1. Introduction
      Diabetes mellitus (DM) is an exponentially growing disease across the developing countries of
the 21st century. Diabetes mellitus has now become a worldwide challenge and identified as the
risk factor of other chronic diseases such as hyperosmolar, diabetic ketoacidosis, and hyperglycemia
and, in extreme cases, death. Furthermore, diabetes also causes long-term complications, for instance,
cardiovascular disease, heart stroke, kidney failure, chronic ulcers, blindness, damage to the eyes,
and many more [1]. Williams wrote in his book “Williams textbook of Endocrinology” [2] that around
385 million people were affected with diabetes in 2013. If Diabetes mellitus is left untreated, this figure
can get higher; it can even lead to death. Around 425 million people had diabetes in the world by the
survey report of the International Diabetes Federation (IDF) in 2015 [3]. Also, the report indicates that

Processes 2019, 7, 289; doi:10.3390/pr7050289                                www.mdpi.com/journal/processes
Processes 2019, 7, 289                                                                               2 of 18

382 million people around the globe are affected by diabetes in developing countries alone and Africa
has 4.9% from this ratio.
     By the World Health Organization (WHO) [4], 321,100 deaths occurred in the African region due
to diabetes, out of which 79% of the population was under the age of 60; this is the maximum number
in any region of the world. The ratio of diabetes mellitus patients in rural and urban areas of Nigeria
varies from 0.67% to 12%, and this ratio has been estimated to more than double over the past two
decades [5]. According to the IDF report, the ratio of undiagnosed diabetic people in sub-Saharan
Africa (SSA) is estimated at 87%, out of which 8.7% in the male and 8.9% in the female population of
Nigeria. It is due to the lack of information and government resources [6]. In addition, the American
Diabetes Association (ADA) estimates that the prevalence was estimated in Nigeria as 20.01% in
both the male and female population [7]. Compared with the world population, the Nigerian health
organizations pointed out that the diabetes prevalence was 4.7% in 2010 and it was projected to be
5.8% by 2030 and even exceed 10% by 2040 [8]. However, this estimate comes from rural areas, and it
is expected to be more in urban slums.
     In this study, the fundamental objective was to develop a quick and accurate prediction assessment
scheme by using easily observable clinical features to identify patients with a high risk of diabetes.
For this purpose, the machine learning Rule classifiers (projective adaptive response theory (PART)
and Decision table) were used on the Weka 3.9.2 platform for acquiring accuracy in classification
assumptions. Afterward, the logistic regression (LR) was utilized on the classification results to predict
and forecast patients with a high risk of diabetes. This research can be applied to diabetes mellitus
patients who cannot afford the expenses of the medical laboratory and specifically those in remote
areas or villages with low socioeconomic status and excessive epidemiological risk.
     Correspondingly, the remaining paper is structured as follows: Section 2 explains the material
and methodology after the background description, Section 3 reviews the results, Section 4 discusses
the results and limitations, and Section 5 concludes the findings.

Background
      Numerous authors work to develop appropriate disease prediction algorithms. For instance,
Lélis et al. applied seven classification techniques in a Brazilian investigation to make a diagnosis of
meningococcal meningitis and verified that the model is affordable and accurate [9]. Susanne et al.
proposed a mathematical model to forecast the prevalence of diabetes by using attributes of sex, age,
risk factor status, and T2DM (type 2 diabetes mellitus) status and found T2DM prevalence is projected
to increase by 43%, and the incidence is projected to increase 147% by 2050 in Qatar [10]. Choi et al.
applied support vector machine (SVM) and artificial neural network (ANN) to screen the pre-diabetes
of 9251 individuals and performed a systematic assessment of the models using external and internal
cross-validation and concluded that the results of the SVM method are better than the ANN [11]. Amir
et al. proposed a time series prediction model for the diagnosis of diabetes patients [12]. In addition,
Olivera et al. utilized machine learning algorithms from ELSA-Brazil and identified individuals with
the highest risk of undiagnosed diabetes from readily available clinical data [13]. Sohail et al. performed
the classification results on Weka by machine learning by utilizing the dataset of different diseases
and concluded the accuracy ratio of the decision tree (86%), the Bayesian network (90%), the naïve
Bayesian (76%), the fuzzy cognitive map (94%), and K-nearest neighbor (KNN) (94%) [14]. Parampreet
et al. applied a cloud-based framework with the help of sensor devices to initially screen patients for
the prediction of diabetes [15]. Further, Hassan et al. proposed a unified machine-learning framework
for diabetes predications in big data [16]. There is considerable interest in determining how different
classification techniques from machine learning can be utilized as disease prediction tools [17–21].
These tools have been used to diagnose diabetes [22], glaucoma [23], meningitis [24], coronary artery
disease [25], asthma [26], cancer [27], hypertension [28], heart arrhythmia [29], tuberculosis [30],
and other diseases [31,32].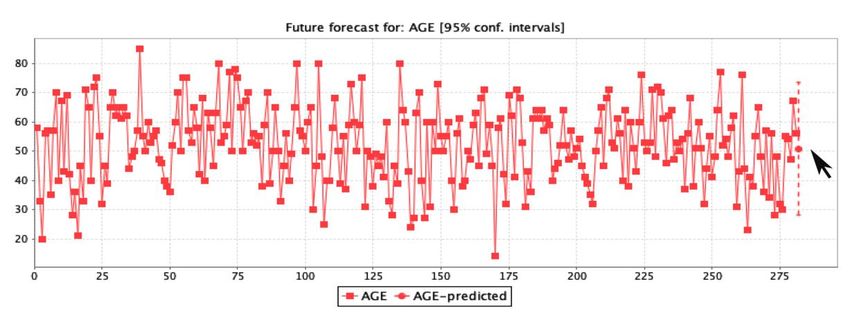
Processes 2019, 7, 289 3 of 18
Processes 2019, x, x FOR PEER REVIEW 3 of 18
2. Material
2. Material and
and Methods
Methods
2.1. Ethical Consents
2.1. Ethical Consents
The study was approved by the Natural Science Foundation of China Hebei province, the Yanshan
The study
University was
ethics approved and
committee, by the Natural Science
all experiments and Foundation
simulation of China Hebei
procedures province,
conformed to the
the
Yanshan University ethics committee, and all experiments and simulation procedures
Declaration of Helsinki. All participants provided written informed consent after having all proceduresconformed to
the Declaration
explained to them ofboth
Helsinki. Alland
verbally participants
in writing.provided written informed consent after having all
procedures explained to them both verbally and in writing.
2.2. Model Framework
2.2. Model Framework
Figure 1 shows the assessment framework used in this study for diabetes patient screening. The
assessments1were
Figure shows the assessment
performed framework
in a total usedInitially,
of six steps. in this study for diabetes
the real-life patient
diabetes screening.
mellitus The
data were
assessments
acquired andwere performed
preprocessed forin a total of
selection of six steps. Initially,
appropriate the real-life
attributes. Afterward,diabetes mellitus
this data data were
was utilized for
acquired and preprocessed for selection of appropriate attributes. Afterward, this
evaluation and assessment. Secondly, the updated plugins of two machine learning Rule classifiers data was utilized
for evaluation
(PART and table)
and Decision assessment.
were usedSecondly,
on Weka the updated
version 3.9.2plugins of two
“data mining machineforlearning
platform” Rule
classification
classifiers
measurements(PART andand Decision
Rule table)[33].
assessment wereInused on Weka
addition, versionregression
the logistic 3.9.2 “data miningwas
method platform”
utilized for
on
classification measurements and Rule assessment [33]. In addition,
the results of the machine learning classifiers to forecast the rule assessment. the logistic regression method
was utilized on the results of the machine learning classifiers to forecast the rule assessment.
Assessment framework
Figure 1. Assessment framework used
used in
in this study for clinical implication screening.
2.3. Data
2.3. Data Collection
Collection and
and Explanation
Explanation
The real-life
The real-life diabetes
diabetes mellitus
mellitus data
data of
of 1257
1257 patients
patients from
from December
December 20172017 to
to February
February 2019
2019 were
were
acquired from
acquired from four
four main
main hospitals
hospitals across
across Nigeria
Nigeria and
and carefully
carefully examined. Figure 22 demonstrate
examined. Figure the
demonstrate the
collection flow of data gathered from four principal hospitals in Nigeria namely
collection flow of data gathered from four principal hospitals in Nigeria namely Abdullahi Wase Abdullahi Wase
Specialist Hospital
Specialist Hospital (22.75%),
(22.75%), Ajingi
Ajingi General
General Hospital
Hospital (22.04%),
(22.04%), Federal
Federal Medical
Medical Center
Center Birnin-Kudu
Birnin-Kudu
(26.81%), and Gaya General Hospital (28.40%) located in the northwestern region
(26.81%), and Gaya General Hospital (28.40%) located in the northwestern region of Nigeria. of Nigeria. The
The data
data were collected through questionnaires, verbal interviews, and by consultation
were collected through questionnaires, verbal interviews, and by consultation of the medical of the medical
specialist after
specialist after the
the ethics
ethics committee
committee ofof the
the institute
institute where
where thethe research
research was
was carried
carried out
out approved
approved thethe
study protocols. The data collection flow of diabetes patients from the mentioned hospitals
study protocols. The data collection flow of diabetes patients from the mentioned hospitals is shown is shown
in Figure
in Figure 2,
2, and
and the
the number
number of
of patients
patients in
in each
each hospital
hospital is
is shown
shown in in Figure
Figure 3.
3.
Processes 2019, 7, x; doi: FOR PEER REVIEW www.mdpi.com/journal/processes
Processes 2019, x, x FOR PEER REVIEW                                                                          4 of 18

Processes 2019,
Processes       7, x289
          2019, x,   FOR PEER REVIEW                                                                          44of
                                                                                                                 of 18
                                                                                                                    18

                 Figure 2. The data collection flow of diabetes patients from the four hospitals.
                 Figure 2. The data collection flow of diabetes patients from the four hospitals.
                 Figure 2. The data collection flow of diabetes patients from the four hospitals.

                    Figure 3. Total number of diabetes patients recorded in the four hospitals.
                    Figure 3. Total number of diabetes patients recorded in the four hospitals.
2.4. Attributes Selection
2.4. Attributes     Figure 3.
                 Selection
      In our prediction       Total number
                            assessment     of of diabetesmellitus
                                               diabetes    patients recorded  in thethe
                                                                     prevalence,     fourdata
                                                                                          hospitals.
                                                                                              of 10 easily available
attributes/variables, namely age, gender, GLU (glucose level of the patient), BMI (body mass index of
      In our prediction
2.4. Attributes Selection assessment of diabetes mellitus prevalence, the data of 10 easily available
the patient), HYP (hypertension status), HCD (history of cardiovascular disease), FDH (family history
attributes/variables, namely age, gender, GLU (glucose level of the patient), BMI (body mass index
of diabetes),  PEX (physical
     In our prediction           exercise),
                            assessment     of STW   (work
                                               diabetes     stress status),
                                                          mellitus           and DIT
                                                                     prevalence,   the (diet
                                                                                        data of the  patient,
                                                                                                 10 easily    healthy
                                                                                                            available
of the patient), HYP (hypertension status), HCD (history of cardiovascular disease), FDH (family
and unhealthy). Outnamely
attributes/variables,    of 1257 records,    587 patient
                                  age, gender,             records level
                                                   GLU (glucose     were ofmissing   values in
                                                                              the patient),    the(body
                                                                                             BMI    body mass index
                                                                                                                index,
history of diabetes), PEX (physical exercise), STW (work stress status), and DIT (diet of the patient,
glucose
of        level, hypertension,
   the patient),                   cardiovascular
                   HYP (hypertension                  disease,
                                            status), HCD         work of
                                                             (history   stress status, family
                                                                           cardiovascular       diabetes
                                                                                             disease), FDHexperience,
                                                                                                              (family
healthy and unhealthy). Out of 1257 records, 587 patient records were missing values in the body
history
physicalofexercises,
            diabetes),and
                        PEX   (physical
                            diet           exercise),
                                 lifestyles.          STW
                                              Moreover,      (work
                                                           389        stress
                                                                records      status),
                                                                          were  removedand from
                                                                                            DIT (diet of the patient,
                                                                                                 assessment   dataset
mass index, glucose level, hypertension, cardiovascular disease, work stress status, family diabetes
healthy
because and    unhealthy).
          of missing  valuesOut     of 1257 records,
                               in pre-diabetes    status.587 patient records
                                                          Therefore,             were
                                                                       281 records      missing
                                                                                     with        values were
                                                                                           10 variables  in theused
                                                                                                                 body
                                                                                                                    in
experience, physical exercises, and diet lifestyles. Moreover, 389 records were removed from
mass   index, glucose
the prediction           level, hypertension, cardiovascular disease, work stress status, family diabetes
                 analysis.
assessment dataset because of missing values in pre-diabetes status. Therefore, 281 records with 10
experience, physical exercises, and diet lifestyles. Moreover, 389 records were removed from
variables
2.5.        were
     Attribute    used in the prediction analysis.
                Parameters
assessment    dataset  because of missing values in pre-diabetes status. Therefore, 281 records with 10
variables
      The  were
           10     used
              features  in the prediction
                        selected
2.5. Attribute Parameters                     analysis.
                                   in this study   were characterized as follows. Age and gender represented
demographic characteristics. A patient’s glucose level (mmol/L) has a relation with age and diet.
2.5. Attribute
Processes 2019, 7,Parameters
                   x; doi: FOR PEER REVIEW                           www.mdpi.com/journal/processes

Processes 2019, 7, x; doi: FOR PEER REVIEW                                           www.mdpi.com/journal/processes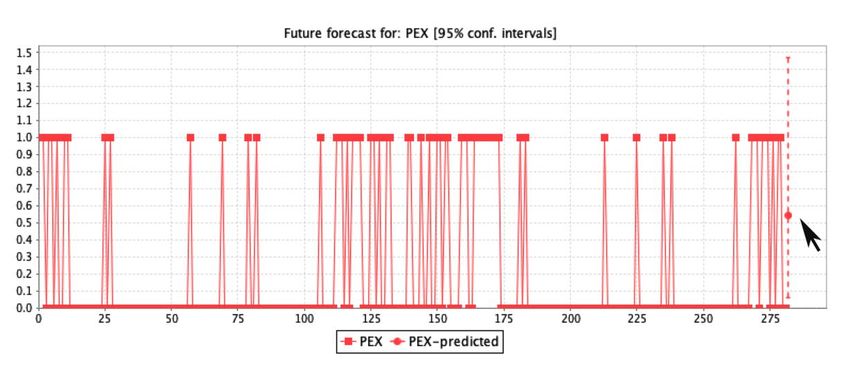
Processes 2019, 7, 289                                                                                                5 of 18

Family history of diabetes was defined as any family member previously diagnosed by a physician as
diabetic or pre-diabetic (Yes = 1, No = 0). BMI was calculated as body weight divided by the square of
height in meters and BMI ≥ 25 was defined as overweight. History of cardiovascular disease or stroke
was defined as the patient having been previously diagnosed with coronary heart disease or stroke
by a surgeon (Yes = 1, No = 0). Physical exercise indicated whether the patient engaged in exercise
(Yes = 1, No = 0). Work stress was measured to the patient’s subjective impression (Yes = 1, No = 0).
Diet was measured as a balanced and unbalanced diet (Yes = 1, No = 0). HYP was defined in three
ways: first, a systolic BP (blood pressure) ≥140 mmHg; second, medication for BP control; and third,
diastolic BP ≥ 90 mmHg.

2.6. Data Mining Platform
     Waikato Environment for Knowledge Analysis (Weka/v 3.9.2) was used for the preprocessing and
classification assessment of diabetes mellitus by updated plugins of the Kmean clustering algorithm
to assign the class to the dataset of 10 variables for testing as positive and negative status (positive
mean diabetes and negative mean normal status) [34]. The positive patients were declared as high in
diabetes status after assessment and negative as normal for the initial screening by proper forecast
assessment. The advantage of using Weka is the avoidance of overfitting and unnecessary complexity.
     In addition, Rule algorithms (PART and Decision table) were adopted for accurate measurements.
Moreover, the logistic regression was utilized on the assessment of classification to forecast diabetes
prevalence for clinical implications.
     After data preprocessing, the final dataset included 281 patient records with males and females
and 11 attributes. The population sampling included patients with diabetes mellitus status Type
1 (non-insulin dependent), Type 2 (insulin-dependent), and gestational diabetes. The 11 attributes
included 10 as input attributes and the one as the target attribute. The target attribute consisted of two
classes: one class obtained the diagnosis of diabetes tested positive and the second class was tested
negative by the Kmean finding within the clusters that are more related to each other at the significance
level of 0.05 [35].
     Kmean is a typical distance-based cluster algorithm and its distance is measured on similarities.
The process steps of the Kmean are to measure the distance between each object and the centers of the
cluster by Equations (1)–(3), as follows:

                         (t)
                                n                                                        o
                     Si        = ∀j, 1A jAkXp : kXp − mti k2 ≤ kXp − mtj k2 ∀j, 1 ≤ j ≤ k ∀j, 1A jAk,                    (1)

                                                                  1      X
                                                    mti +1 =                        X j,                                 (2)
                                                                  (t)
                                                                 Si           (t)
                                                                        x j ∈Si
                                                    Xk          Xn
                                                                             ( j)
                                               J=                       k xi − c j k2 ,                                  (3)
                                                       j=1        i=1

                                                                                                               ( j)
where n is the number of data points in the i clusters, k is the number of cluster centers, and k xi − c j k
                                                         ( j)
represents the Euclidean distance between xi                    and c j . In addition, the Kmean clustering algorithm is
composed of the following steps.

(i)   Place the K points into the considerable space as represented by the objects that are being clustered,
      which indicate the initial group of centroids.
(ii) Properly assign each object to the group that undoubtedly possesses the most adjacent centroid.
(iii) After assigning all objects, recalculate the prominent position of the K centroid.
(iv) Repeat the second and third step until the centroids are not able to shift significantly more. This
      efficiently produces the possible separation of group objects, which can accurately calculate the
      matrix to be minimized by Equation (4).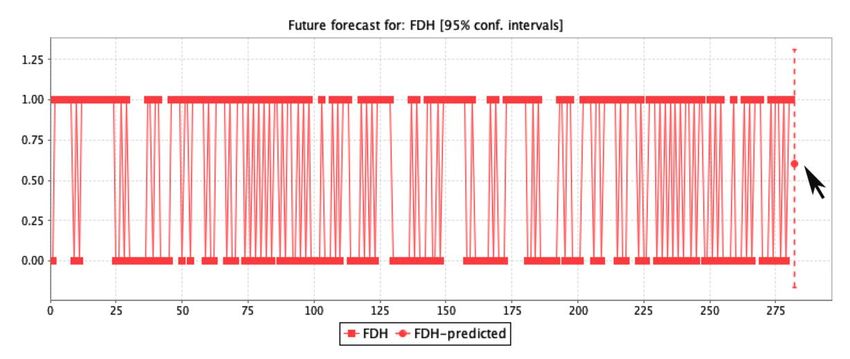
Processes 2019, 7, 289                                                                               6 of 18

                                          argminc j ∈C dist(ci , x)2 .                                  (4)

2.7. Rules Classification
      The machine learning algorithms PART and Decision table were utilized for the classification of
the dataset with a 10-fold cross-validation assessment. PART classifications are projected as discrete
rules to conquer the rule methods of any dataset and generate a rule set for a better understanding of
the decision list. In addition, PART works with a combination of C4.5 and Ripper [36]. The paramount
leaf in the rules assessment was generated by the fractional C4.5 decision tree repetitions. It compares
the data to the rules of each list, and vice versa, and assigns the items accordingly.
      The decision table summarizes the testing dataset and compares it with the training dataset
generated. In addition, it classifies the unknown dataset samples by the Wrapper method, which
helps to reduce the unknown values and produce better results with higher accuracy and minimal
error rates [37]. The first attribute in the rule tree is the most informative node, which is measured by
Equations (5) and (6):
                                                       Xk |D |
                                                                i
                                        IA = E ( D ) −            E ( Di ) ,                           (5)
                                                          i=1 |D|
                                           Xm count(c , x)          count(ci , x)
                                                            i
                                 E(X ) = −                     ·log               .                    (6)
                                               i=1      |x|                |x|
     The parameter selected for the PART classifier was 100 as the batch size with false in binary splits
by a confidence interval of 0.25%. The number of objects was set as 2, decimal number places as 2, fold
number as 3, error pruning as false, and seeds value as 1. In addition, the parameters for the Decision
table were 100 as the batch size with a cross value was 1 and the number of decimal places was 2 with
the best first in search results.

2.8. Kappa Statistics
     Kappa statistics have the consistency of frequent testing, which provides extended facts about
data collection in the research that is correct for variable measurements. It compares the model results
with the randomly generated classification. We adopted kappa stats measures based on values between
0 and 1 as in Equations (7)–(9) where the value 0 is invalid and 1 is the expected effect of the assessment.
Furthermore, kappa stats indicate the consistency of assessment.

                                       K = [P(A) − P(E)]/[1 − P(E)]                                     (7)

                                         P(A) = [(TP + TN )/N ]                                         (8)

                            P(E) = [(TP + FN ) ∗ (TP + FP) ∗ (TN + FN )/N2                              (9)

2.9. Logistic Regression Forecasting
     Logistic regression was implemented on the classification outcomes with the primary objective
to define the initial screening for disease diagnosis and prediction [38]. In most cases, the variables
of the logistic regression work to solve the two-way binary classifications. It predicts the continuous
values to maintain the sensitivity in the numbers field where the values are 0 and 1. The value 1 is
assigned only if the value is greater than the threshold (value > threshold); otherwise, it will be 0.
Hence, the range of output works in the logistic regression is between 0 and 1 with the addition of the
sigmoid function layers measured by Equations (10)–(13):

                                   P = α + β1 X1 + β2 X2 + . . . + βm Xm ,                             (10)

                                                     1
                                           σ(x)           ∈ [0, 1],                                    (11)
                                                  1 + e−x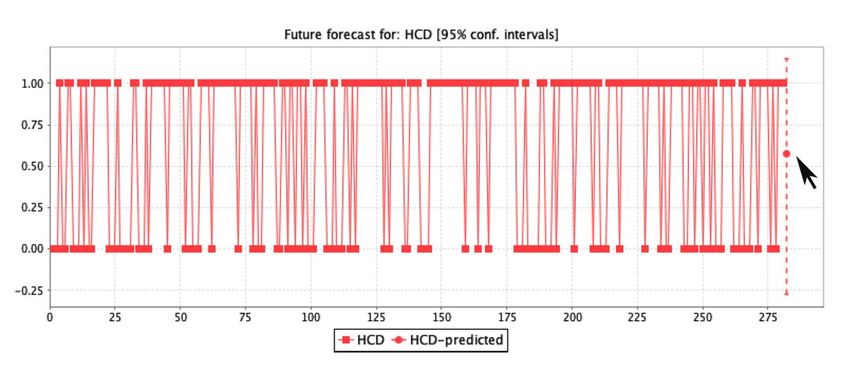
Processes 2019, 7, 289                                                                                 7 of 18

                                            Pr(Y = +1|X) ∼ β.X,                                         (12)

                                   Pr(Y = −1|X) = 1 − Pr(Y = +1|X).                                     (13)

     It consists of a positive and a negative group of values. The variable X will be assigned to the β
coefficient values, which represent the weight. Y indicates the patients with diabetes. The variations
between the values X and Y occur on the basis of weight.
     The parameters selected for the logistic regression forecast was 1 for a number of time units. The
confidence interval was set at 0.95%. The M5 method was chosen for attribute selection with a batch
size of 100, and the ridge was set as 1.0 E-8. After accurately setting up, it is easy to predict the outcome
of positive or negative. The sigmoid function σ(x) proposition is described as follows:

Proposition 1. A function f : (0,1) → R is absolutely a monotone on (0,1) if and only if it possesses a
power series expansion with non-negative coefficients, converging for 0 < x < 1.

Proof. If (f ) function is completely monotone in (0,1), then the power series expansion of (f ) function
in (0,1) has to be alternating because (−1)k f k ≥ 0. On the other hand, consider an alternating power
series of function f (x) converging for all 0 < x < 1 and its derivatives by Equations (14)–(16):

                             f (x) = a0 − a1 x + a2 x2 − a3 x3 . . . ai ≥ (0 < x < 1),                  (14)

                                   (−1) f 1 (x) = a1 − 2a2 x + 3a3 x3 + . . . ,                         (15)

                                           f 2 (x) = 2a2 − 6a3 x + . . .                                (16)


3. Results
     A total of 281 diabetes patients were evaluated; 121 (43.06%) were male and 160 (56.93%) were
female. Among the 281 records, 256 (91.10%) were not dependent on insulin (Type 1), 14 (4.98%) were
Gestational, and 11 (3.91%) were insulin dependent (Type 2). Initially, the dataset was divided into a
20:80 ratio for conducting training and testing. After training the machine, a 10-fold cross-validation
technique was implemented on an experimental platform of Weka for better assessment of the
classification. The dataset was divided into 10 samples. Each sample was utilized as validation data
from the retention process, while the remaining nine samples served as the training data. This process
was performed 10 times. The advantage of this process is the reduction in the error ratio and bias
correlation by random sampling.

3.1. Measurements
      Initially, the PART rule classifier was tested on the dataset to measure the classification accuracy
with the seed of random numbers selected for XVal. The percentage was 1, the confidence factor was
0.25%, the minimum number of objects was 2, and the number of folds was set to 3. After loop tests,
the average accuracy of the final result was 99.28%. Secondly, the same measurement was tested on the
Decision table rule classifier. The final result with an average accuracy of 98.22% was obtained in 0.77 s.
The subset value was 99.60%, and the average error was 0.03%. By employing the rule classification
(PART and Decision table), good predictive rules were obtained for the patient’s care. The outcomes in
the initial phase were the most appropriate with a mean accuracy of 98.75%; the error rate remained
at 0.02%.
      The results obtained for the classification accuracy are presented in Table 1 along with the attribute
details and the clustering instances for the classification. It is comprised of three sections. The
first section discusses the details of the properties used for the Weka platform for assessment, with
281 patients describing their age limits by classification type and improving the evaluation of positive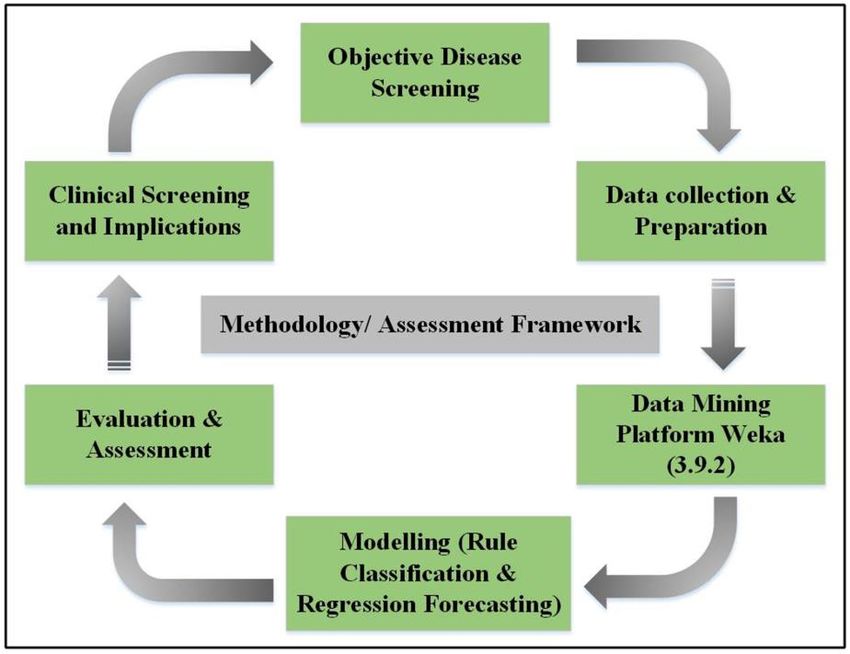
Processes 2019, 7, 289                                                                                                   8 of 18

and negative tested weights. Additionally, it provides accurate information and average classification
accuracy for PART and Decision table rule classifiers, including kappa statistics, mean error, true
positive rate, false positive rate, accuracy, recall rate, F-measure, Matthew’s correlation curve (MCC).,
Receiver operating characteristics (ROC), Precision recall curve (PRC) area ratios, and the time it takes
for a prediction analysis [39,40].

                Table 1. Diabetes type and the number of patients classified for the Rule assessment.

                         Patients                                                                            Class
  Diabetes Type                          Age           Weight                      Attributes
                         (N = 281)                                    “0”                             T_N             T_P
                                                                     Missing
          NID               256                         256.0        Values
          GTD               14         >10 10 and 20 and ≤40 = 58 patients
  •       From age >40 and ≤60 = 144 patients
  •       From age >60 and ≤80 = 76 patients
  •       From age >80 = 1 patient

                     Accuracy                                          99.28                                 98.22
                  Kappa statistics                                      0.98                                  0.96
               Mean absolute error                                      0.01                                  0.03
                 True positive rate                                     0.99                                  0.98
                 False positive rate                                    0.01                                  0.01
                      Precision                                         0.99                                  0.98
                       Recall                                           0.99                                  0.98
                     F-Measure                                          0.99                                  0.98
                        MCC                                             0.98                                  0.96
                     ROC area                                           0.99                                  0.99
                      PRC area                                          0.99                                  0.99
           Time taken to build the model                               0.10 s                                0.77 s
                 Average accuracy                                      99.28                                 98.22
              Mean average accuracy                                                  98.75%
                          Counts                         Cluster by Class                 Cluster by Diabetes Type
       Values                            Ratio
                         (N’ = 281)                     T_N             T_P            NID           GTD              IND
            0               138          49%             47              91            128              7             3
            1               143          51%             40             103            128              7             81
      1 NID = not insulin dependent; GTD = gestational diabetes patients; IND = insulin dependent; MCC = Matthew’s
      correlation curve; ROC = Receiver operating characteristics; PRC = Precision recall curve; N = number of patients;
      ≥greater than; ≤less than; % = percentage value; T_N = tested negative; T_P = tested positive; Values = two clusters
      0 and 1; N´ = total number of classified patients.

     The details of the cluster instance, as shown in Figure 4, was tested and classified as
positive/negative. Out of 281 instances, 138 (49.11%) were classified as the 0 cluster instance, among
them 47 (16.72%) were tested as negative, and 91 (32.38%) were tested as positive. One hundred
and forty-three (50.88%) were classified as a cluster 1 instance from which 40 (14.23%) were tested
as negative and 103 (36.65%) were tested as positive. In the final assessment, 51% were classified as
positive and 49% instances as negative. The values of these classifications were used as input to the
regression prediction phase.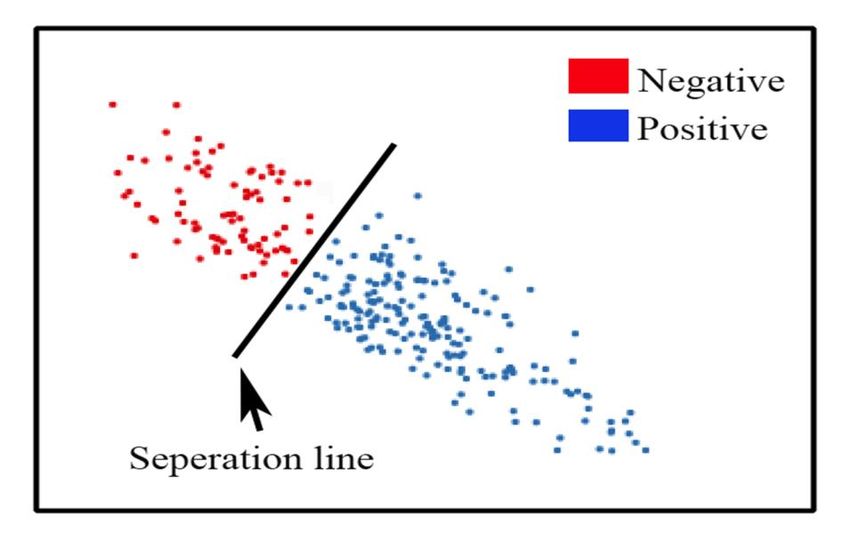
positive
 Processes and
           2019, 49%   instances
                 x, x FOR        as negative. The values of these classifications were used as input to9 the
                          PEER REVIEW                                                                    of 18
regression prediction phase.
 positive and 49% instances as negative. The values of these classifications were used as input to the
 regression
 Processes 2019,prediction
                 7, 289    phase.                                                                9 of 18

                   Figure 4. Evaluation of the Kmean clusters tested as positive and negative.
                     Figure 4. Evaluation of the Kmean clusters tested as positive and negative.
3.2. Rule Forecast Assessment
                     Figure 4. Evaluation of the Kmean clusters tested as positive and negative.
  3.2. Rule Forecast Assessment
       The predictive analysis represents the assessment for decision-making by determining the ratio
of3.2. Rule
        The Forecast
    patient          Assessment
             predictive  analysis
              characteristics.  Therepresents     the assessment
                                      forecast analysis            forindecision-making
                                                            obtained                      by determining
                                                                          the study is graphically        the ratio
                                                                                                    displayed  in
  of patient
FigureThe5a–g, characteristics.
                and the 23
             predictive           The   forecast
                             rules achieved
                         analysis   represents     analysis
                                               through        obtained   in the
                                                         the rule classification
                                                  the assessment                study is graphically
                                                                                  measurements
                                                                   for decision-making                displayed
                                                                                                 are described
                                                                                         by determining        inin
                                                                                                          the ratio
  Figure
Table      5a–g, and
        2 in terms
  of patient          the  23 rules
                   of the patients’
               characteristics.      achieved
                                 The initial     through
                                              screening
                                       forecast            the rule
                                                   analysisstage    classification
                                                                 of healthcare.
                                                             obtained              measurements   are described
                                                                        in the study is graphically displayed in in
  Table
  Figure2 5a–g,
           in terms
                 andofthe
                        the23patients’  initial screening
                              rules achieved     through thestage ofclassification
                                                               rule  healthcare. measurements are described in
 Table 2 in terms of the patients’ initial screening stage of healthcare.

                                                       (a)

                                                   Figure 5. Cont.
                                                        (a)

Processes 2019, 7, x; doi: FOR PEER REVIEW                                        www.mdpi.com/journal/processes

 Processes 2019, 7, x; doi: FOR PEER REVIEW                                        www.mdpi.com/journal/processes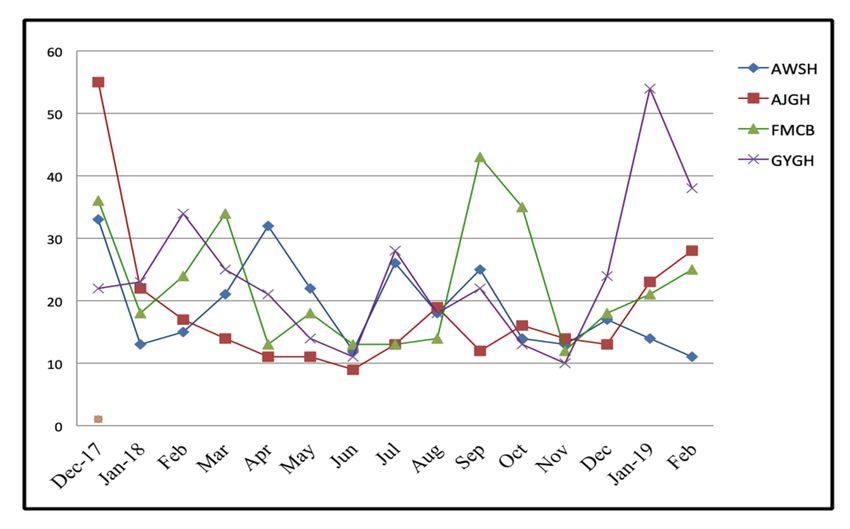
Processes
 Processes2019,
           2019,x,7,x 289
                      FOR PEER REVIEW                                                10 10
                                                                                         ofof1818

                                                 (b)

                                                 (c)

                                                 (d)

                                             Figure 5. Cont.

Processes 2019, 7, x; doi: FOR PEER REVIEW                     www.mdpi.com/journal/processes
Processes2019,
Processes 2019,x,7,x289
FOR PEER REVIEW 1111ofof1818
(e)
(f)
(g)
Figure
Figure5.5.(a–g)
(a–g)The
Theregression
regressionprediction
prediction assessment
assessment of the seven
seven main
mainfeatures
featuresused
usedfor
forthe
theanalysis
analysisof
ofclinical
clinicalsignificance.
significance.
Processes 2019, 7, x; doi: FOR PEER REVIEW www.mdpi.com/journal/processesProcesses 2019, 7, 289 12 of 18
Table 2. Twenty-three if-then rules achieved from the classification analysis.
Twenty-Three If-Then Rules Extracted from the Assessment Are:
IF the patient’s glucose level is (>101); THEN the patient is classified as tested
Rule 1:
positive with diabetes.
IF the patient’s glucose level is (>72); THEN the patient is classified as tested
Rule 2:
positive for diabetes, but the patient has to screen through the second stage test.
IF the patient’s blood pressure is (≤100); THEN the patient is classified as tested
Rule 3: negative for diabetes but this case also depends on the glucose level of the patient,
which takes patients for screening of the second stage.
IF the patient’s blood pressure is ( 25) and the patient also has no diabetes in
Rule 6: their family history and patient’s diet is unbalanced; THEN the patient is
classified as tested negative for diabetes.
IF the patient’s age is from (35 ≤ 49) and (BMI > 25) and the patient also has no
diabetes in their family history and the patient’s diet is unbalanced and the
Rule 7:
patient is without physical exercise; THEN the patient is classified as tested
positive for diabetes.
IF the patient’s age is from (35 ≤ 49) and (BMI > 25), and the patient also has no
diabetes in their family history, the patient’s diet is unbalanced, and the patient is
Rule 8:
with physical exercise but has no history of cardiovascular disease; THEN the
patient is classified as tested negative for diabetes.
IF the patient’s age is from (35 ≤ 49) and (BMI > 25), and the patient also has no
diabetes in their family history, the patient’s diet is unbalanced, and the patient is
Rule 9:
with physical exercise but has no history of cardiovascular disease; THEN the
patient is classified as tested positive for diabetes.
IF the patient’s age is (≤49) and (BMI > 25), and the patient also has no diabetes in
Rule10: their family history and the patient’s diet is balanced; THEN the patient is
classified as tested negative for diabetes.
IF the patient’s age is (≤49) and (BMI ≤ 25), and the patient also has diabetes in
Rule11:
their family history; THEN the patient is classified as tested negative for diabetes.
IF the patient’s age is (≤49) and (BMI > 25), and the patient also has diabetes in
Rule12:
their family history; THEN the patient is classified as tested positive for diabetes.
IF the patient’s age is (>49) and (BMI ≤ 25), and the patient also has a high work
Rule13: stress but no diabetes in their family history; THEN the patient is classified as
tested negative for diabetes.
IF the patient’s age is (>49) and (BMI > 25), and the patient also has a high work
Rule14: stress but no diabetes in their family history; THEN the patient is classified as
tested positive for diabetes.
IF the patient’s age is (>49) and the patient has a high work stress, and also has
Rule15: diabetes in their family history; THEN the patient is classified as tested positive
for diabetes.
IF the patient’s age is (>49) and (BMI >25), and the patient’s work stress is low
Rule16: and also has no diabetes in their family history but their diet is unbalanced;
THEN the patient is classified as tested positive for diabetes.
IF the patient’s age is (>49) and (BMI > 25), and the patient has no diabetes in
Rule17: their family history and has a balanced diet; THEN the patient is classified as
tested negative for diabetes.
IF the patient’s age is (>49) and (BMI > 25), and the patient’s work stress is low
Rule18: but they have diabetes in their family history; THEN the patient is classified as
tested positive for diabetes.Processes 2019, 7, 289 13 of 18
Table 2. Cont.
Twenty-Three If-Then Rules Extracted from the Assessment Are:
IF the patient’s age is (>49) and (BMI ≤ 25), and the patient has a low or medium
Rule19: work stress with hypertension and also their food is not balanced; THEN the
patient is classified as tested positive for diabetes.
IF the patient is male with age (>49) and (BMI ≤ 25), and the patient has a low or
medium work stress without hypertension and also their food is not balanced but
Rule20:
they have diabetes in their family history with cardiovascular disease; THEN the
patient is classified as tested positive for diabetes.
IF the patient is male with age (>49) and (BMI ≤ 25), and the patient has a low or
medium work stress without hypertension and their diet is not balanced, and
Rule21:
they have cardiovascular disease history in their family; THEN the patient is
classified as tested negative for diabetes.
IF the patient is female with age (>49) and (BMI ≤ 25), and the patient has a low
Rule22: or medium work stress without hypertension and their diet is not balanced;
THEN the patient is classified as tested negative for diabetes.
IF the patient’s age is (>49) and (BMI ≤ 25), and the patient has a low or medium
Rule23: work stress with balanced diet; THEN the patient is classified as tested negative
for diabetes.
The prediction assessment by logistic regression used in this study for clinical significance was
analyzed by the confidence interval of 0.95%. The patient features used were age, blood glucose, body
mass index, physical exercise, family history of diabetes, family cardiovascular history, and work stress
by the M5 method in regression. The results of the forecast prediction for diabetes mellitus patients
on the age feature show that patients up to 51 years could have a high death risk if the ratio of other
features include a glucose level of 120.45 mmol/L, BMI ≥ 23, physical exercise between 0.5 to 0.6, family
diabetes history of 0.6, cardiovascular stroke history of 0.61, and a work-stress ratio count of 1.08.
4. Discussion
In this study, a machine-learning technique was instigated on a data-mining platform with a
dataset of 281 patients suffering from diabetes. The data was collected only from Nigeria for the
assessment of diabetes mellitus prevalence by determining two rule classifiers (PART and Decision
tables) on 10 non-invasive and easily accessible medical attributes/variables. They include age (age of
the patient), gender (male and female), glucose level of the patient, body mass index of the patient,
hypertension, history of cardiovascular disease, family history of diabetes, physical exercise, stress of
work, and diet of the patient (healthy and unhealthy) to accurately measure diabetes mellitus ratio for
rapid and precise screening of patients suffering with diabetes mellitus status along with other chronic
disease symptoms.
Initially, during the assessment on the data mining platform (Weka), the dataset was divided into
two parts for training and testing in a 20:80 percent ratio. Twenty percent of the training data was used
to train the machine and assess the outcome. Whereas, 80 percent of the data was used for testing.
Furthermore, a complete dataset of 281 patients was analyzed on the experimental mode of Weka for
the final assessment of both classifiers together. The results of the Rule classification show the mean
accuracy of 98.75% with an error rate of 0.02%. In addition, the mean kappa stats were 0.97%, true
positive rate remained 0.97%, false positive rate 0.01%, precision 0.98%, recall 0.98%, F-matrix 0.98%,
MCC 0.97%, ROC area ratio 0.99%, and PRC area ratio 0.99%.
The outcomes of the non-invasive medical features used in this study indicate this assessment can
successfully help to predict the patients of diabetes and pre-diabetes without the need for preliminary
laboratory tests. In addition, the 23 rules generated during the assessment clearly show the main
features of individuals with diabetes. Therefore, this study raises the prediction that age is the
underlying and root variable, followed by a family history of diabetes, body mass index, gender,Processes 2019, 7, 289 14 of 18
work stress, physical exercise, diet lifestyle, hypertension, and cardiovascular family history. These
implementations are useful for substantial epidemiological threats and low socioeconomic status
regions around the world, such as Africa and other developing states.
The key strength of this study is its use of a unique approach to both classifiers with logistic
regression assessment to identify and forecast diabetes mellitus prevalence. Moreover, the use of
realistic health records collected from the four principal hospitals in the developing country of Nigeria
where the prevalence proportion of diabetes in men and women is high and explicitly mentioned
in the literature study. Hence, patients with diabetes mellitus can be screened by 23 generated
rules. Diabetes mellitus can be controlled through organizing appropriate educational programs in
developing countries to govern the widespread growth of diabetes mellitus. This can help people
reduce the burden of health hitches through awareness-raising activities. The classification assessment
proposed in this paper was set to test other well-known machine learning algorithms by the same data
to evaluate and compare classification accuracy results. Table 3 and Figure 6 clearly show that PART
and Decision table rule classifiers have been successful in clinically meaningful research.
Table 3. The rule classification average precision is compared to other machine learning classifiers
based on the same dataset.
Method Accuracy% Mean%
PART rule 99.28
98.75%
Decision table rule 98.22
MLP 73.82
Discrim 77.54
Logdisc 78.22
KNN 94.29
Logistic 85.35
BayesNet 74.76
NaïveBayes 76.35
Random Forest 76.66
LogitBoost 93.93
J48 98.17
SGD 76.62
SMO 77.26
ANN 89.84
RBF 75.71
FCM 94.78 1
1 It comprehensively compares the proposed classification results with the other machine learning classifiers on the
same dataset.Processes 2019, x, x FOR PEER REVIEW 15 of 18
Processes 2019, 7, 289 15 of 18
Figure 6. Comparisons of the rule classifier with other machine learning classifiers.
Limitation Figure 6. Comparisons of the rule classifier with other machine learning classifiers.
The dataset was divided into a 20:80 percentages. Initially, 20% was utilized for machine training
Limitation
and 80% were used for testing. Furthermore, 100% with 281 instances were used in performing
The dataset
experiments was divided
on Weka into the
to achieve a 20:80
meanpercentages.
accuracy ofInitially, 20% was This
both classifiers. utilized for machine
assessment training
study holds
and
two 80% were used
limitations. Onefor testing. aFurthermore,
comprises 100% with
division of training 281 instances
and testing data forwere used in performing
the meta-dataset and the
experiments
second is theon Weka
time to achieve
taken the metadata
to test the mean accuracy of both classifiers.
for classification. If the This assessment
metadata study on
is analyzed holds
the
two
samelimitations.
platform, theOneprocessing
comprisestimea division of training
can increase. and testing
However, data for
it depends onthe
themeta-dataset andused,
type of dataset the
second is theoftime
the number taken
seeds to test
input, andthe
themetadata
number of for classification.
experiments If the metadata
performed is analyzed
for acquiring on theresults.
the desired same
platform, the processing time can increase. However, it depends on the type of dataset used, the
5. Conclusions
number of seeds input, and the number of experiments performed for acquiring the desired results.
This study implements the machine learning rule classifiers (PART and Decision table) on a data
5. Conclusions
mining platform to identify possible diabetes and pre-diabetes in the initial clinical screening of a
patient
Thisthrough logistic regression
study implements forecast
the machine assessment
learning rule analysis.
classifiersTwo hundred
(PART and eighty-one
and Decision table) ondiabetes
a data
mellitus patients have been analyzed with 10 easily available non-invasive medical
mining platform to identify possible diabetes and pre-diabetes in the initial clinical screening of afeatures collected
from four
patient main hospitals
through logistic located in northwestern
regression Nigeria. The
forecast assessment classification
analysis. assessment
Two hundred andaccuracy was
eighty-one
98.75% and it was achieved through a set of 23-decision screening rules that can successfully
diabetes mellitus patients have been analyzed with 10 easily available non-invasive medical features influence
accurate initial
collected clinical
from four screening
main of diabetes
hospitals located in mellitus and pre-diabetes
northwestern patients.
Nigeria. The classification assessment
accuracy was 98.75% and it was achieved through a set of 23-decision and
Additionally, the obtained Rules classified the most considerable risks suggest
screening that that
rules diabetes
can
prevention and education programs can be applied in targeted community interventions.
successfully influence accurate initial clinical screening of diabetes mellitus and pre-diabetes patients. The study
helpsAdditionally,
in the initialthe diagnosis
obtained ofRules
diabetes and reduces
classified the most healthcare organization
considerable risks and problems.
suggest thatTherefore,
diabetes
such a study is found extremely significant for the states and regions with extreme
prevention and education programs can be applied in targeted community interventions. The study epidemic risk ratios
and low socioeconomic status across the globe.
helps in the initial diagnosis of diabetes and reduces healthcare organization problems. Therefore,
such a study is found extremely significant for the states and regions with extreme epidemic risk
Author Contributions: Writing—Original draft preparation, methodology, software, and formal analysis have
ratios andby
been done low socioeconomic
M.N.S.; status validation,
conceptualization, across thedata
globe.
curation, and visualization, has done by M.N.S., M.U.M.;
supervision, resources, project administration, and funding acquisition has done by R.J.; investigation has done by
Author
M.N.S., Contributions: Writing—Original
S.T.C., J.A.; finally writing—reviewdraft preparation,
and editing methodology,
has carefully done bysoftware, and formal
M.N.S., S.T.C., analysis have
J.A., A.J.V.
been done by M.N.S.; conceptualization, validation, data curation, and visualization, has done by M.N.S.,
This research
Funding:supervision,
M.U.M.; work hasproject
resources, been supported by NSFC
administration, andNatural
fundingScience Foundation
acquisition of Hebei
has done province
by R.J.; under
investigation
grant of No. 61572420, No. 61472341, and No. 61772449.
has done by M.N.S., S.T.C., J.A.; finally writing—review and editing has carefully done by M.N.S., S.T.C., J.A.,
Acknowledgments: We express our appreciation to “Yanshan University, Qinhuangdao, China” for accompanying
A.J.V.
us in this research.
Processes 2019, 7, x; doi: FOR PEER REVIEW www.mdpi.com/journal/processesProcesses 2019, 7, 289 16 of 18
Conflicts of Interest: The authors declare no conflict of interest.
Nomenclature
PART Projective adaptive response theory
F-measure Frequency matrix
CI Confidence interval
MCC Matthews’s correlation coefficient
DR Decision rules
DM Diabetes mellitus
T2DM Type 2 diabetes mellitus
GLU Glucose level
BMI Body mass index
HYP Hypertension
HCD History of cardiovascular disease
FDH Family diabetes history
PEX Physical exercise
STW Work stress
DIT Diet
LR Logistic regression
References
1. Khoury, N.; Attal, F.; Amirat, Y.; Oukhellou, L.; Mohammed, S.; Khoury, N. Data-Driven Based Approach to
Aid Parkinson’s Disease Diagnosis. Sensors 2019, 19, 242. [CrossRef]
2. Melmed, S.; Polonsky, K.S.; Larsen, P.R.; Kronenberg, H. Williams Textbook of Endocrinology, 13th ed.; Elsevier:
Amsterdam, The Netherlands, 2016.
3. Whiting, D.R.; Guariguata, L.; Weil, C.; Shaw, J. IDF Diabetes Atlas: Global estimates of the prevalence of
diabetes for 2011 and 2030. Diabetes Res. Clin. Pract. 2011, 94, 311–321. [CrossRef]
4. Cho, N.H.; Shaw, J.E.; Karuranga, S.; Huang, Y.; da Rocha Fernandes, J.D.; Ohlrogge, A.W.; Malanda, B.
IDF Diabetes Atlas: Global estimates of diabetes prevalence for 2017 and projections for 2045. Diabetes Res.
Clin. Pract. 2018, 138, 271–281. [CrossRef] [PubMed]
5. Shamshirgaran, S.M.; Jorm, L.; Lujic, S.; Bambrick, H. Health related outcomes among people with type 2
diabetes by country of birth: Result from the 45 and Up Study. Prim. Care Diabetes 2019, 13, 71–81. [CrossRef]
[PubMed]
6. Gan, D.; King, H.; Lefèbvre, P.; Mbanya, J.-C.; Silink, M.; Siminerio, L. Diabetes Atlas, 2nd ed.; Gent: Brussels,
Belgium, 2015.
7. American Diabetes Association. 1. Improving Care and Promoting Health in Populations: Standards of
Medical Care in Diabetes-2019. Diabetes Care 2019, 42, S7–S12. [CrossRef]
8. Tsobgny-Tsague, N.-F.; Lontchi-Yimagou, E.; Nana, A.R.N.; Tankeu, A.T.; Katte, J.C.; Dehayem, M.Y.;
Bengondo, C.M.; Sobngwi, E. Effects of nonsurgical periodontal treatment on glycated haemoglobin on type
2 diabetes patients (PARODIA 1 study): A randomized controlled trial in a sub-Saharan Africa population.
BMC Oral Health 2018, 18, 28. [CrossRef]
9. Lélis, V.-M.; Guzmán, E.; Belmonte, M.-V. A Statistical Classifier to Support Diagnose Meningitis in Less
Developed Areas of Brazil. J. Med. Syst. 2017, 41, 145. [CrossRef] [PubMed]
10. Awad, S.F.; O’Flaherty, M.; Critchley, J.; Abu-Raddad, L.J. Forecasting the burden of type 2 diabetes mellitus
in Qatar to 2050: A novel modeling approach. Diabetes Res. Clin. Pract. 2018, 137, 100–108. [CrossRef]
11. Choi, S.B.; Kim, W.J.; Yoo, T.K.; Park, J.S.; Chung, J.W.; Lee, Y.; Kang, E.S.; Kim, D.W. Screening for prediabetes
using machine learning models. Comput. Math. Methods Med. 2014, 2014, 618976. [CrossRef] [PubMed]
12. Talaei-Khoei, A.; Wilson, J.M.; Kazemi, S.-F. Period of Measurement in Time-Series Predictions of Disease
Counts from 2007 to 2017 in Northern Nevada: Analytics Experiment. JMIR Public Heal Surveill. 2019, 5,
e11357. [CrossRef]Processes 2019, 7, 289 17 of 18
13. Olivera, A.R.; Roesler, V.; Iochpe, C.; Schmidt, M.I.; Vigo, Á.; Barreto, S.M.; Duncan, B.B. Comparison of
machine-learning algorithms to build a predictive model for detecting undiagnosed diabetes—ELSA-Brasil:
Accuracy study. Sao Paulo Med. J. 2017, 135, 234–246. [CrossRef] [PubMed]
14. Sohail, M.N.; Jiadong, R.; Uba, M.M.; Irshad, M. A Comprehensive Looks at Data Mining Techniques Contributing
to Medical Data Growth: A Survey of Researcher Reviews; Springer: Singapore, 2019; pp. 21–26.
15. Kaur, P.; Sharma, N.; Singh, A.; Gill, B. CI-DPF: A Cloud IoT based Framework for Diabetes Prediction.
In Proceedings of the 2018 IEEE Annual Information Technology, Electronics and Mobile Communication
Conference, Columbia, Canada, 3 November 2018; pp. 654–660.
16. Mahmud, S.M.H.; Hossin, M.A.; Ahmed, M.R.; Noori, S.R.H.; Sarkar, M.N.I. Machine Learning Based
Unified Framework for Diabetes Prediction. In Proceedings of the 2018 International Conference on Big Data
Engineering and Technology (BDET 2018), Chengdu, China, 27 August 2018; pp. 46–50.
17. Srikanth, P.P.; Nilofer, V.; Siddiqui, I.; Dasari, P.; Ambica, B.; Venkata, V.B.V.E. Characteristic evaluation of
diabetes data using clustering techniques. Int. J. Comput. Sci. Netw. Secur. 2008, 8, 244–251.
18. Okpor, M.D. Prognostic Diagnosis of Gestational Diabetes Utilizing Fuzzy Classifier. Int. J. Comput Sci.
Netw. Secur. 2015, 15, 44.
19. Humayun, A.; Niaz, M.; Umar, M.; Mujahid, M. Impact on the Usage of Wireless Sensor Networks in
Healthcare Sector. Int. J. Comput. Sci. Netw. Secur. 2017, 17, 102–105.
20. Atmini, D.; Dwi, L.; Eminugroho, R. Sensitivity Analysis of Goal Programming Model for Dietary Menu of
Diabetes Mellitus Patients. Int. J. Model. Optim. 2017, 7, 7–14. [CrossRef]
21. Raimundo, M.S.; Okamoto, J., Jr. Application of Hurst Exponent (H) and the R/S Analysis in the Classification
of FOREX Securities. Int. J. Model. Optim. 2018, 8, 116–124. [CrossRef]
22. Alotaibi, M. Investigating the Role of Social Robot in improving diabetic Children Management and
awareness. Int. J. Comput. Sci. Netw. Secur. 2017, 17, 121.
23. Khawaja, A.P.; Cooke Bailey, J.N.; Wareham, N.J.; Scott, R.A.; Simcoe, M.; Igo, R.P.; Song, Y.E.;
Wojciechowski, R.; Cheng, C.-Y.; Khaw, P.T.; et al. Genome-wide analyses identify 68 new loci associated
with intraocular pressure and improve risk prediction for primary open-angle glaucoma. Nat. Genet. 2018,
50, 778–782. [CrossRef]
24. Dian, S.; Rahmadi, R.; van Laarhoven, A.; Ganiem, A.R.; van Crevel, R. Predicting Mortality of Tuberculous
Meningitis. Clin. Infect. Dis. 2018, 67, 1954–1955. [CrossRef] [PubMed]
25. Samy, G.; Gamal, N. A Framework for Social Network-Based Dynamic Modeling and Prediction of
Communicable Disease. Int. J. Model. Optim. 2019, 9, 30–33. [CrossRef]
26. Lamwong, J.; Pongsumpun, P. Age Structural Model of Zika Virus. Int. J. Model. Optim. 2018, 8, 17–23.
[CrossRef]
27. Verdial, F.; Madtes, D.; Hwang, B.; Mulligan, M.; Odem-Davis, K.; Waworuntu, R.; Wood, D.; Farjah, F. A
Prediction Model for Nodal Disease among Patients with Non-Small Cell Lung Cancer. Ann. Thorac. Surg.
2019. [CrossRef] [PubMed]
28. Kasiakogias, A.; Tsioufis, C.; Dimitriadis, K.; Konstantinidis, D.; Koutra, E.; Kyriazopoulos, K.;
Kyriazopoulos, I.; Liatakis, I.; Mantzouranis, M.; Philippou, C.; et al. P1540Comparison of the European
Society of Hypertension stratification and European Society of Cardiology HeartScore for prediction of
coronary artery disease and stroke in essential hypertension. Eur. Heart J. 2018, 39, 1540. [CrossRef]
29. Mustaqeem, A.; Anwar, S.M.; Majid, M.; Khan, A.R. Wrapper method for feature selection to classify cardiac
arrhythmia. In Proceedings of the 39th Annual International Conference of the IEEE Engineering in Medicine
and Biology Society, Jeju Island, Korea, 11–15 July 2017; pp. 3656–3659.
30. Romanowski, K.; Balshaw, R.F.; Benedetti, A.; Campbell, J.R.; Menzies, D.; Ahmad Khan, F.; Johnston, J.C.
Predicting tuberculosis relapse in patients treated with the standard 6-month regimen: An individual patient
data meta-analysis. Thorax 2019, 74, 291–297. [CrossRef] [PubMed]
31. Alfian, G.; Syafrudin, M.; Ijaz, M.; Syaekhoni, M.; Fitriyani, N.; Rhee, J. A Personalized Healthcare Monitoring
System for Diabetic Patients by Utilizing BLE-Based Sensors and Real-Time Data Processing. Sensors 2018,
18, 2183. [CrossRef] [PubMed]
32. Ijaz, M.; Alfian, G.; Syafrudin, M.; Rhee, J. Hybrid Prediction Model for Type 2 Diabetes and Hypertension
Using DBSCAN-Based Outlier Detection, Synthetic Minority Over Sampling Technique (SMOTE), and
Random Forest. Appl. Sci. 2018, 8, 1325. [CrossRef]Processes 2019, 7, 289 18 of 18
33. Kieviet, A. Werkzeuge der digitalen Transformation. In Lean Digital Transformation; Springer:
Berlin/Heidelberg, Germany, 2019; pp. 57–159.
34. Witten. Weka—Data Mining with Open Source Machine Learning Software in Java. Weka. 2016. Available
online: https://www.cs.waikato.ac.nz/ml/weka/ (accessed on 23 May 2018).
35. Fallah, M.; Niakan Kalhori, S.R. Systematic Review of Data Mining Applications in Patient-Centered
Mobile-Based Information Systems. Healthc. Inform. Res. 2017, 23, 262. [CrossRef] [PubMed]
36. Padillo, F.; Luna, J.M.; Ventura, S. A Grammar-Guided Genetic Programing Algorithm for Associative
Classification in Big Data. Cognit. Comput. 2019, 1–16. [CrossRef]
37. González, J.; Ortega, J.; Damas, M.; Martín-Smith, P.; Gan, J.Q. A new multi-objective wrapper method for
feature selection—Accuracy and stability analysis for BCI. Neurocomputing 2019, 333, 407–418. [CrossRef]
38. Muhammad, M.U.; Asiribo, O.E.; Noman, S.M. Application of Logistic Regression Modeling Using Fractional
Polynomials of Grouped Continuous Covariates. Niger. Stat. Soc. 2017, 1, 144–147.
39. Dubey, R.; Makwana, R.R.S. Computer-Assisted Valuation of Descriptive Answers Using Weka with
RandomForest Classification. In Proceeding of the Second International Conference on Microelectronics, Computing
& Communication Systems (MCCS 2017), 76th ed.; LNEE, Ed.; Springer: Singapore, 2019; pp. 359–366.
40. Rani, R.U.; Kakarla, J. Efficient Classification Technique on Healthcare Data. In Progress in Advanced Computing
and Intelligent Engineering, 713rd ed.; AISC, Ed.; Springer: Singapore, 2019; pp. 293–300.
© 2019 by the authors. Licensee MDPI, Basel, Switzerland. This article is an open access
article distributed under the terms and conditions of the Creative Commons Attribution
(CC BY) license (http://creativecommons.org/licenses/by/4.0/).You can also read