An Advanced Forest Fire Danger Forecasting System: Integration of Remote Sensing and Historical Sources of Ignition Data - MDPI
←
→
Page content transcription
If your browser does not render page correctly, please read the page content below
remote sensing
Article
An Advanced Forest Fire Danger Forecasting System:
Integration of Remote Sensing and Historical Sources
of Ignition Data
Masoud Abdollahi 1 , Tanvir Islam 2 , Anil Gupta 1,3 and Quazi K. Hassan 1, *
 1    Department of Geomatics Engineering, Schulich School of Engineering, University of Calgary,
      2500 University Dr. NW, Calgary, AB T2N 1N4, Canada; abdolahi@ucalgary.ca (M.A.);
      anil.gupta@gov.ab.ca (A.G.)
 2    NASA Jet Propulsion Laboratory, 4800 Oak Grove Drive, Pasadena, CA 91109, USA;
      tanvir.islam@jpl.nasa.gov
 3    Alberta Environment and Parks, 2938 11 Street NE, Calgary, AB T2E 7L7, Canada
 *    Correspondence: qhassan@ucalgary.ca; Tel.: +1-403-220-9494

 Received: 20 May 2018; Accepted: 11 June 2018; Published: 12 June 2018

 Abstract: Forest fire is one of the major natural hazards/disasters in Canada and many ecosystems
 across the world. Here, our objective was to enhance the performance of an existing solely remote
 sensing-based forest fire danger forecasting system (FFDFS), and its implementation over the
 northern region of the Canadian province of Alberta. The modified FFDFS was comprised of
 Moderate Resolution Imaging Spectroradiometer (MODIS)-derived daily surface temperature (Ts)
 and precipitable water (PW), and 8-day composite of normalized difference vegetation index (NDVI)
 and normalized difference water index (NDWI), where we assumed that cloud-contaminant pixels
 would reduce the risk of fire occurrences. In addition, we generated ignition cause-specific static
 fire danger (SFD) maps derived using the historical human- and lightning-caused fires during the
 period 1961–2014. Upon incorporating different combinations of the generated SFD maps with the
 modified FFDFS, we evaluated their performances against actual fire spots during the 2009–2011
 fire seasons. Our findings revealed that our proposed modifications were quite effective and the
 modified FFDFS captured almost the same amount of fires as the original FFDFS, i.e., about 77%
 of the detected fires on an average in the top three fire danger classes of extremely high, very high,
 and high categories, where about 50% of the study area fell under low and moderate danger classes.
 Additionally, we observed that the combination of modified FFDFS and human-caused SFD map
 (road buffer) demonstrated the most effective results in fire detection, i.e., 82% of detected fires on
 an average in the top three fire danger classes, where about 46% of the study area fell under the
 moderate and low danger categories. We believe that our developments would be helpful to manage
 the forest fire in order to reduce its overall impact.

 Keywords: human-caused static fire danger map; lightning-caused static fire danger map;
 normalized difference vegetation index; normalized difference water index; precipitable water;
 surface temperature

1. Introduction
     Forest fires are an integral part of ecosystems across the globe, including those in the Canadian
boreal region. In general, forest fires are perceived negatively for several reasons, such as: (i) loss of
forestry revenues [1]; (ii) expedition of global warming through releasing of carbon dioxide into
the atmosphere [2]; (iii) destruction of neighborhoods, critical infrastructure, and biodiversity [3];
and (iv) increase in respiratory diseases though deteriorating air quality [4], etc. At the same time,

Remote Sens. 2018, 10, 923; doi:10.3390/rs10060923                        www.mdpi.com/journal/remotesensing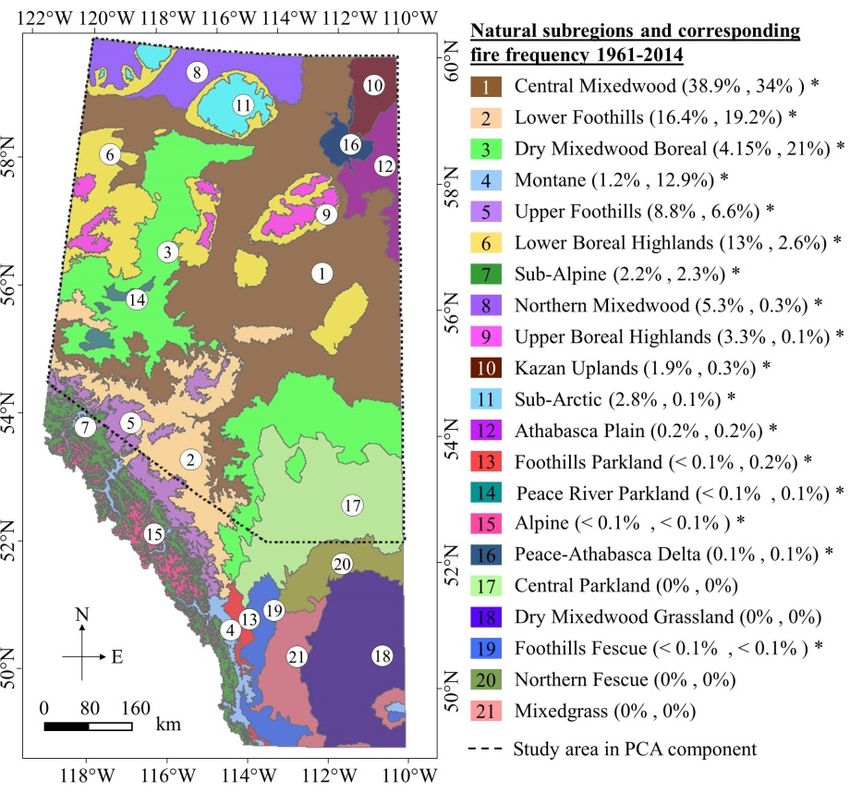
Remote Sens. 2018, 10, 923                                                                             2 of 14

there are some positive aspects including reviving healthy trees, extinguishing pests and diseases,
and providing nutrients for better regeneration. In order to quantify the balance between negative
and positive impacts, it is extremely important to have an efficient system to manage forest fires.
In this context, one of the critical steps to understanding the pre-fire conditions is the need of
formulating a forest fire danger forecasting system, which would be possible by using remote
sensing-based approaches.
      In recent decades, researchers have used satellite-based remote sensing approaches to study
fire danger conditions as remote sensors can acquire data continuously even in the remote areas of
the landscape. In general, we can divide the remote sensing-based approaches broadly into two
categories, such as monitoring systems that determine the fire danger conditions during and/or
after fire occurrences [5–7]; and forecasting systems that predict the fire danger conditions before
fire occurrences [1,8,9]. In fact, the forecasting systems should be studied more extensively as the
monitoring systems are not useful for the operational forest fire management purposes [10]. Some of
the key studies are summarized as follows:
•     Preisler et al. [11] employed the AVHRR-derived relative greenness (RG) and normalized
      difference vegetation index (NDVI) in calculating fire potential index (FPI) to determine the
      weekly distributions of three fire-related components (i.e., the total number of fires, total fires
      with a specific size, and probability of those fires which have a certain size) over the continental
      United States during the period 1985–2005. In determining the probability, they used two types
      of FPI values (i.e., FPI10 and FPI1000 obtained from 10-h and 1000-h time lag fuel moisture,
      respectively). Upon generating the probabilities, they compared the forecasted number of large
      fires and observed ones. The result showed that both FPI10 and FPI1000 could predict large fires.
•     Bisquert et al. [12] used Moderate Resolution Imaging Spectroradiometer (MODIS)-derived 16-day
      enhanced vegetation index (EVI) at 250 m spatial resolution, and daily surface temperature (Ts) at
      1 km spatial resolution to predict fire danger condition over the Galicia region, Spain during the
      period 2001–2006. They evaluated different combinations of input variables (e.g., difference
      between two 16-day images for EVI; average and maximum 2 to 16-day composites, and
      differences between two Ts images in the same composite period, and so on) along with fire
      history and period of year using logistic regression and artificial neural networks. They found the
      best predictor (i.e., combination of 8-day Ts images, fire history in each cell, and period of year)
      was able to classify 65% of the observed fires in the high fire danger class.
•     Chowdhury and Hassan [8] employed MODIS-derived products, such as 8-day composites of Ts
      at 1 km, NDVI and normalized multiband drought index (NMDI) at 500 m, and daily precipitable
      water (PW) at 1 km resolution to develop a Forest Fire Danger Forecasting System (FFDFS).
      They forecasted the fire danger conditions at daily scale over the forest areas in Alberta during
      2009–2011 in five fire danger classes (i.e., low, moderate, high, very high, and extremely high), and
      demonstrated that ~77.39% of the fire events fell into the high to extremely high categories. Note
      that this study was based on the earlier research conducted in the Earth Observation Laboratory at
      The University of Calgary, and was focused on forecasting fire dangers at 8-day time-scale [1,13].
•     Li et al. [14] studied MODIS-derived 16-day composites of RG and vegetation danger index (VDI)
      at a 250 m spatial resolution in conjunction with historical fire events in order to determine fire
      danger conditions over Northern China for the period 2008–2011. They compared RG and VDI
      values for fire spot locations at three times: (i) before the fire (2008 and 2009); (ii) during the fire
      events (2010); and (iii) after fire occurrence (2011). They showed that RG values were more than
      70% at the fire spot locations before the fire occurring, and VDI values were positive.
•     Liu et al. [15] used: (i) MODIS-derived 8-day Ts and surface reflectance data; (ii) Advanced
      Spaceborne Thermal Emission and Reflection Radiometer (ASTER)-derived digital elevation
      model (DEM) at 30 m spatial resolution; and (iii) historical lightning-caused fire data to generate
      the potential fire risk at a 0.5◦ × 0.5◦ spatial resolution over a mountainous area in China during
      the period 2000–2006. They produced five fire risk classes (i.e., low to extremely high); and found
Remote Sens. 2018, 10, 923 3 of 14
that ~68.8% of the historical fires fell under the three fire risk classes (i.e., relatively high, high,
and extremely high).
• Arganaraz et al. [16] employed MODIS-derived 8-day vegetation and canopy water
content-related indices (e.g., NDVI, EVI, and normalized difference water index (NDWI), etc.) to
estimate live fuel moisture content (LFMC) and, subsequently, to predict fire danger conditions
within different land cover classes in the forest area of Gran Chaco in Argentina during three fire
seasons (i.e., 2003, 2012, and 2013). Then, they classified the modeled LFMC values into four fire
danger classes (i.e., low, moderate, high, and extremely high) at a monthly scale, and observed
that ~60% of the burn pixels contained high and extremely high danger classes.
• Yu et al. [17] used: (i) MODIS-derived 8-day Ts at 1 km, surface reflectance at 500 m, and fire
mask at 1 km data; (ii) Shuttle Radar Topography Mission (SRTM)-derived DEM at 30 m; and (iii)
Tropical Rainfall Measuring Mission (TRMM)-derived 8-day accumulated precipitation data at
0.25◦ × 0.25◦ , to forecast fire risk at a 8-day scale in Cambodia. They reported that the predicted
risk in comparison to the MODIS-derived fire spots had good agreement (i.e., r2 ≈ 0.987).
In general, most of the above-mentioned systems had either coarse spatial or temporal resolutions.
In contrast, Chowdhury and Hassan’s proposed method had not only demonstrated its ability to
forecast danger conditions at daily time-scales with 500 m spatial resolution, but also over Canadian
boreal forested regions. Despite this, it had several issues, such as: (i) only one variable (i.e., PW) was
available on a daily time-scale; (ii) it applied a gap-filling algorithm [13] to infill the cloud-contaminant
pixels that was not only time consuming, but also unable to eliminate all the cloudy pixels; and (iii) it
did not incorporate the source of ignition, including lightning- and human-caused fires, in the makeup
of the system. In order to address these issues, our objectives were three-fold. Firstly, we exploited
historical fire occurrences caused by both lightning and human activities in order to generate
cause-specific static fire danger (SFD) maps. Secondly, we opted to enhance the legerity of the
existing system (i.e., FFDFS) described in our earlier studies [1,8,13] by: (a) employing a daily-scale Ts;
(b) removing the gap-filling algorithm upon the assumption that the cloud-contaminant pixels would
exhibit low fire danger conditions; and (c) replacing the NMDI using NDWI, as this would be simpler
to compute. Finally, we combined the remote sensing-based danger conditions (as outlined in the first
step) with the two SFD maps, and evaluated their overall achievements.
2. Materials
2.1. Study Area
Our study area is located between 52–60◦ N latitudes and 110–120◦ W longitudes in the northern
part of the Canadian province of Alberta (see Figure 1). Since our goal was to forecast fire danger in the
forest areas, we focused on four different forest land cover types mentioned in Table 1. The elevation
in this area varies between 162 and 3596 m above mean sea level, and the mean annual temperature
and precipitation vary from −3.6 to 1.1 ◦ C, and between 377–535 mm, respectively. Thus, the area is
known for short summers, and long and cold winters in the area [18].
2.2. Data Requirement
In this study, we employed three datasets including four different products from Terra MODIS,
54-years of fire occurrence data (see Figure 2), and two geographic information system (GIS) layers
(roads and natural subregions; Table 1). Of the natural subregions we selected 17 natural subregions in
generating the fire ignition source SFD maps. The reason we chose these subregions was that they had
experienced at least one fire during the period 1961–2014 (Figure 1).Remote Sens. 2018, 10, 923 4 of 14
Remote Sens. 2018, 10, x FOR PEER REVIEW 4 of 14
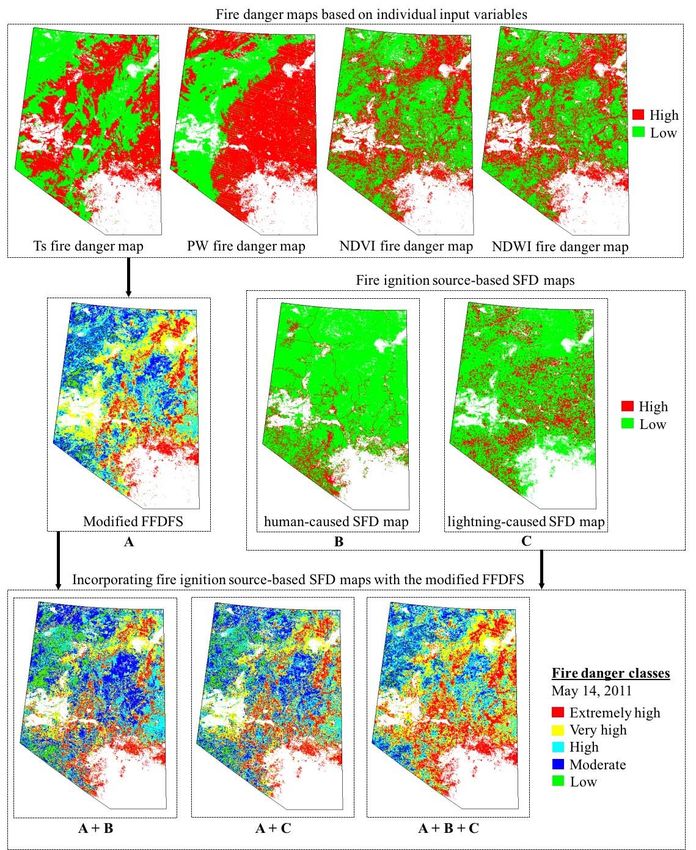
Figure1.1. Map
Figure Map illustrating
illustrating the
the location
location of
of the
the study
study area,
area, and
and fire
fire frequency
frequency (percentage
(percentage of
of lightning-
lightning-
and human-caused
and human-caused in in parenthesis,
parenthesis, respectively)
respectively) in
in all
all 21
21 natural
natural subregions
subregions during
during the
the period
period of
of
1961–2014in
1961–2014 inAlberta,
Alberta,Canada.
Canada. TheThe asterisk
asterisk marks
marks denote
denote the
the subregions
subregions where
whereweweobserved
observedatatleast
least
onefire
one fireoccurrence
occurrenceduring
duringthetheperiod
periodofofinterest.
interest.
Table1.
Table 1. Description
Description of
of the
the employed
employeddatasets
datasetsin
inthe
thescope
scopeof
ofthis
thisstudy.
study.
Source Period Description Purpose
Source Period Description
Historical lightning-caused fire dataset Used as calibrationPurposedataset in generating
1961–2000
consisting of 16087 no. fires Used as calibration dataset in
Historical lightning-caused fire dataset the lightning-caused SFD map
1961–2000
Historical lightning-caused fire dataset generating
Utilized the lightning-caused
in validating the lightning-caused
consisting of 16087 no. fires
2001–2014 SFD map
consisting of 7888 no. fires SFD map
Alberta Forest Service Historical
Historical lightning-caused
human-caused fire datasetfire dataset EmployedUtilized in validating
in validating thethe
human-caused
2001–2014
1961–2014 consisting of 7888 no. fires lightning-caused SFD map
consisting of 26776 no. fires the SFD map
Alberta Forest Service
Historical
Historical human-caused
fire dataset with the firefiresizes
dataset
≥1 Employed in validating the
1961–2014 Employed in evaluating the map
generated
2009–2011 hectares, consisting of 26776
consisting of 2772 no. fires
fire spots within human-caused the SFD
daily fire danger maps
Historical
four forest fire dataset
land cover types with the fire sizes ≥ 1
of interest Employed in evaluating the
2009–2011 hectares,
Daily surface consisting of
temperature 2772
(i.e., fire spots within
MOD11A1) generated daily fire danger maps
four forest land cover types of interest
at 1 km spatial resolution
Daily surface temperature (i.e., MOD11A1) Used as an input into the model
Daily precipitable water (i.e., MOD05L2) at 1
at 1 km spatial
2009–2011 km spatial resolution resolution
Used as an input into the model
Moderate Resolution Daily precipitable water (i.e., MOD05L2)Utilized at in calculating NDWI and NDVI,
8-day composite
2009–2011 of resolution
1 km spatial surface reflectance (i.e.,
Imaging and subsequently employed as input into
MOD09A1) at 500 m spatial resolution
Spectroradiometer Utilized in calculating NDWI and
the model
8-day composite of surface reflectance (i.e.,
(MODIS) Used NDVI, and subsequently
in extracting the intended employed
four forest
MOD09A1) at 500 m spatial resolution
Moderate Resolution Imaging as input into the model
land cover types, i.e., (i) deciduous
Spectroradiometer (MODIS) Annual land cover map (i.e., MCD12Q1) at
2008 Usedforest;
broadleaf in extracting the intended
(ii) evergreen four
broadleaf
500 m spatial resolution
forest;forest land coverneedleleaf
(iii) evergreen types, i.e., forest; and
Annual land cover map (i.e., MCD12Q1) at (i) deciduous broadleaf forest;
2008 (iv) deciduous needleleaf forest
500 m spatial resolution (ii) evergreen broadleaf forest;
2006 Alberta natural subregions as GIS layer (iii) evergreen needleleaf forest; and
Government of Alberta Employed in generating the SFD maps
2000 Alberta road network as GIS layer (iv) deciduous needleleaf forest
2006 Alberta natural subregions as GIS layer Employed in generating the
Government of Alberta
2000 Alberta road network as GIS layer SFD mapsRemote Sens. 2018, 10, 923 5 of 14
Remote Sens.
Remote Sens. 2018,
2018, 10,
10, x
x FOR
FOR PEER
PEER REVIEW
REVIEW 55 of
of 14
14
Figure 2.
Figure
Figure 2. Frequency
2. Frequency distribution
Frequency distribution ofofthe
distributionof the (a)
the(a) lightning-
(a)lightning- and
lightning-and (b)
and(b) human-caused
(b)human-caused
human-causedfire occurrences
fire
fire in in
occurrences
occurrences in 17
17
natural
17
natural subregions
natural
subregions of of
subregions
of Alberta from
Alberta
Alberta from
from 1961–2014.
1961–2014.
1961–2014.
3. Methods
3.
3. Methods
Methods
Our proposed
Our
Our proposed method
proposed method included
method included three
included three major
three major components
major components (Figure
components (Figure3)
(Figure 3)including:
3) including: (i)
including: (i) generating
(i) generating of
generating of
of
fire ignition
fireignition
fire source-based
ignitionsource-based SFD
source-basedSFD maps;
SFDmaps; (ii)
maps;(ii) enhancing
(ii)enhancing the
enhancingthe performance
the performance of
performanceof FFDFS;
of FFDFS; and
FFDFS; and (iii)
and (iii) incorporating
(iii) incorporating
incorporating
SFD
SFD maps
maps with
with enhanced
enhanced FFDFS
FFDFS and
and validations.
validations.
SFD maps with enhanced FFDFS and validations.
Figure 3.
Figure 3. Schematic
Schematic diagram
diagram of
of the
the enhanced
enhanced forest
forest fire
fire danger
danger forecasting
forecasting system.
system.
Figure 3. Schematic diagram of the enhanced forest fire danger forecasting system.
3.1. Generating
3.1. Generating of of Fire
Fire Ignition
Ignition Source-Based
Source-Based SFD
SFD Maps
Maps
3.1. Generating of Fire Ignition Source-Based SFD Maps
In general,
In general, people
people useuse road
road networks
networks to to visit
visit parks,
parks, campgrounds,
campgrounds, and and other
other recreation
recreation facilities,
facilities,
In general, people use road networks to visit parks, campgrounds, and other recreation facilities,
and also to commute to the municipalities and industrial zones located within
and also to commute to the municipalities and industrial zones located within forested regions; as forested regions; as
and also to commute to the municipalities and industrial zones located within forested regions;
such, the chance of forest fire occurrences increases in the vicinity of the roads network
such, the chance of forest fire occurrences increases in the vicinity of the roads network [19–21]. Thus, [19–21]. Thus,
as such, the chance of forest fire occurrences increases in the vicinity of the roads network [19–21].
we created
we created aa 500
500 mm buffer
buffer zone
zone on
on both
both sides
sides of
of the
the roads
roads located
located within
within four
four forest
forest land
land cover
cover types
types
Thus, we created a 500 m buffer zone on both sides of the roads located within four forest land cover
(Table 1). We then produced a human-caused SFD map with two classes, a
(Table 1). We then produced a human-caused SFD map with two classes, a high danger class inside high danger class inside
types (Table 1). We then produced a human-caused SFD map with two classes, a high danger class
the buffer
the buffer zone,
zone, and
and aa low
low danger
danger class
class outside
outside the
the buffer
buffer zone.
zone.
inside the buffer zone, and a low danger class outside the buffer zone.
In studying
In studying thethe spatio-temporal
spatio-temporal patterns
patterns of
of lightning-caused
lightning-caused fire fire incidents,
incidents, Krawchuk
Krawchuk et et al.
al. [22]
[22]
In studying the spatio-temporal patterns of lightning-caused fire incidents, Krawchuk et al. [22]
divided Alberta’s central-eastern landscape into 10 km 2 cells for the period 1983–1993.
divided Alberta’s central-eastern landscape into 10 km2 cells for the period 1983–1993. We used a cell
2 We used a cell
divided Alberta’s central-eastern landscape into 10 km cells for the period 1983–1993. We used a cell
size with
size with an an area
area of
of 99 km
km2 for
2 for 1961–2000
1961–2000 within
within forested
forested areas
areas ofof Alberta.
Alberta. WeWe hypothesized
hypothesized thatthat the
the
lightning-caused fires might follow a specific spatial distribution pattern over a
lightning-caused fires might follow a specific spatial distribution pattern over a long period of timelong period of time
which might
which might bebe used
used asas aa base
base to
to generate
generate aa SFD
SFD map.
map. ToTo do
do so,
so, we
we took
took the
the following
following four
four steps:
steps: (i)
(i)Remote Sens. 2018, 10, 923 6 of 14
size with 2
Remote Sens.an area
2018, 10, xofFOR
9 km
PEERfor 1961–2000
REVIEW within forested areas of Alberta. We hypothesized that 6 ofthe
14
lightning-caused fires might follow a specific spatial distribution pattern over a long period of time
which
we createdmightabe meshusedlayeras a basebased to on
generate
MODIS a SFD
gridmap.
line To do so,
at 500 m we tookresolution;
spatial the following (ii)four
we steps:
merged (i) the
we
created a pixels
adjacent mesh layer in thisbasedmeshonlayer MODIS grid line
in order at 500 maspatial
to generate mesh layerresolution; (ii) we merged
with equivalent 9 kmthe adjacent
2 (i.e., 6×6
pixels or in 3this
kmmesh spatial layer in orderarea
resolution) to generate
per pixel;a (iii)
mesh welayer
masked with equivalent
the generated9mesh km2 (i.e.,
layers × 6 pixels
6 using four
or 3 km
forest land spatial
coverresolution)
types in Alberta; area per andpixel; (iii) we
(iv) finally, wemasked
overlaidthe thegenerated
lightning-caused mesh layers fire spots using four
during
forest
the land 1961–2000
period cover typesover in Alberta; and (iv)mesh
the generated finally, we overlaid
layer in order the lightning-caused
to create a SFD map;fire which spotshad during
two
the period
classes, i.e.,1961–2000
(i) high danger over classes
the generated
where atmesh least layer
one firein happened
order to create during a SFD map; which
the period 1961–2000; had two
and
classes,
(ii) low dangeri.e., (i) classes
high danger whereclassesno fire where
happened at least
overonethe fire
same happened
time period. during the period 1961–2000;
and (ii) low danger classes where no fire happened over the same time period.
3.2. Enhancing the Performance of FFDFS and Their Validations
3.2. Enhancing the Performance of FFDFS and Their Validations
Upon implementing the proposed modifications on FFDFS, we generated daily fire danger maps
basedUpon on the implementing
existing framework the proposeddescribedmodifications
in Chowdhury on FFDFS, we generated
and Hassan [8] (Figure daily4). fire
Indanger maps
this process,
based on the existing framework described in Chowdhury and
we clipped the model inputs (i.e., 8-day composites of surface reflectance, daily Ts and PW) within Hassan [8] (Figure 4). In this process,
we
the clipped
forestedthe areasmodel inputs in
described (i.e., 8-day
Table 1. composites
Then, usingofsurfacesurfacereflectance
reflectance,data daily Ts and
during thePW) within
8-day the
period
forested areas described in Table 1. Then, using surface reflectance
(j), we calculated 8-day composites of NDVI and NDWI for our study area in the same period of time data during the 8-day period (j),
we
(i.e.,calculated
NDVI , NDWI 8-day ). composites
These two vegetationof NDVI and NDWI
indices wereforemployed
our study as area in the same
synthetic dailyperiodindicesofintime the
(i.e., NDVI , NDWI ). These two vegetation indices were
model over the next 8-day period (j + 1) assuming that vegetation greenness and water content
j j employed as synthetic daily indices in the
model over the next 8-day period (j + 1) assuming that vegetation
changes would be negligible in such a short period of time. Using the two types of variables per day greenness and water content changes
would
(i.e., actualbe negligible
daily Ts in and suchPWa; synthetic
short period dailyof NDVI
time. Using
and NDWI the two), we types
then of variablesthe
calculated perstudyday area
(i.e.,
actual daily
daily average-value Ts i and PW ; synthetic daily NDVI and
fori each input variable jin i day (i.e., NDWI j ), we then calculated the
Ts , PW , NDVI , NDWI ). Then, by study area daily
average-value
comparing the for each input
variable variable at
specific-value inai given
day (i.e., Tsiwithin
pixel , PWi , NDVI j , NDWI
our study areaj ).inThen, by comparing
i day (i.e., Ts , PW ,
the variable specific-value at a given pixel within our
NDVI , NDWI ) with the daily average-value in the whole study area for the relevant variablestudy area in i day (i.e., Ts i , PW i , NDVI
in thej ,
NDWI
same day j ) with
(i.e., calculated in previous step), we classified each input variable during the i daysame
the daily average-value in the whole study area for the relevant variable in the into
day (i.e., calculated in previous step), we classified each input
two fire danger classes (i.e., high or low) assuming that the following conditions might support firevariable during the i day into two fire
danger
occurrence: classes (i.e., high or low) assuming that the following conditions might support fire occurrence:
• higher temperature than daily average (i.e., Ts ≥ Ts );
higher temperature than daily average (i.e., Tsi ≥ Tsi );
• lowerprecipitable
lower precipitablewater
waterthan
thandaily
dailyaverage
average(i.e., PWi ≤≤ PW
(i.e., PW PW); i );
• lowerlevel
lower levelof
ofvegetation
vegetationgreenness
greennessthan
thandaily
dailyaverage
average(i.e., NDVI j ≤≤NDVI
(i.e., NDVI NDVI);j );
oror
• lower vegetation water content than daily average (i.e., NDWI ≤
lower vegetation water content than daily average (i.e., NDWI j ≤ NDWI ).jNDWI ).
Figure
Figure 4.
4. The
The schematic
schematic diagram
diagram of
of employed
employed method,
method, along
along with
with characteristics
characteristics of
of danger
danger condition
condition
in
in day (i +
day (i + 1) using the
1) using the model
model input
input variables
variables including:
including: actual
actual daily
daily surface
surface temperature
temperature (Ts
(Tsi)) and
and
precipitable water (PWi ); and synthetic daily normalized difference vegetation index (NDVI j ) and
precipitable water (PW ); and synthetic daily normalized difference vegetation index (NDVI ) and
normalized
normalized difference water index
difference water (NDWI ).).
index (NDWI
j
Finally, we combined these fire danger classes in i day in order to generate fire danger map for
next day (i.e., i +1). The generated fire danger map consisted of five classes: (i) extremely high, where
all four input variables were classified as high fire danger; (ii) very high, where at least three inputRemote Sens. 2018, 10, 923 7 of 14
Finally, we combined these fire danger classes in i day in order to generate fire danger map for next
day (i.e., i +1). The generated fire danger map consisted of five classes: (i) extremely high, where all
four input variables were classified as high fire danger; (ii) very high, where at least three input
variables were classified as high fire danger; (iii) high, where at least two of the input variables were
classified as high fire danger; (iv) moderate, where at least one of the input variables was classified as
high fire danger; and (v) low, where none of the four input variables were classified as high fire danger.
3.3. Incorporating SFD Maps with Enhanced FFDFS
We incorporated the SFD maps (described in Section 3.2) with the enhanced FFDFS in order to
modify the generated daily fire danger maps in Section 3.1. As such, we evaluated these combinations:
(i) enhanced FFDFS plus human-caused SFD map;
(ii) enhanced FFDFS plus lightning-caused SFD map; and
(iii) enhanced FFDFS plus both the human- and lightning-caused SFD maps.
In such modifications, we assigned the generated fire danger classes into a higher class where the
SFD maps showed “high fire danger” conditions. However, the generated fire danger classes remained
unchanged where the SFD maps showed “low fire danger” conditions. Using the new combinations,
we generated a new set of daily fire danger maps in order to forecast fire danger conditions.
In order to determine the best combination of remote sensing-based data and SFD maps in
forecasting forest fire danger conditions, we evaluated the remote sensing-based daily fire danger
maps (i.e., generated in Section 3.2), and enhanced ones based on the SFD maps by overlaying the
ground-based forest fire spots during the period 2009–2011. In this case, we calculated both the
percentage of detected fires and the daily occupied area by each fire danger class. Note that in the
evaluation phase, we employed those fire spots that burned an area equal to, or greater than, 1 hectare,
because a burned area of less than 1 hectare might not be detected by the spatial resolution employed
in this study (i.e., 500 m). Upon evaluating the daily fire danger maps, we compared those with the
results reported by Chowdhury and Hassan [8] in order to find the best system in forecasting forest
fire danger conditions.
4. Results and Discussion
4.1. Generating of Fire Ignition Source-Based SFD Maps
We compared both the human- (i.e., road buffer) and lightning-based SFD maps against the
ground-based forest fire spots during the periods of 1961–2014 and 2001–2014, respectively (Figure 5).
We found that 65.3% and 78.8% of the fires occurred within the high danger class of the human-caused
SFD on an average during the periods 1961–2000 and 2001–2014, respectively, while 87.8% and 12.2%
of the study area fell under the low and high danger classes, respectively. It is interesting to note
that the historical human-caused fires during the period 1961–2014 showed an increasing trend since
2001 (Figure 2). In fact, our analysis revealed that an increment of 13.5% (i.e., from 65.3% to 78.8%)
on average during the 2001–2014 period, in comparison to 1961–2000, occurred within the 500 m
distance from the roads’ center. This might be related to the fact that human accessibility to the forested
areas increased due to several factors. Those included: (i) the expansion of the oil and gas companies’
activities in the heart of forested lands; (ii) the establishment of more recreation facilities and camps
near the roads; (iii) the relatively warmer weather; and (iv) cheaper vehicles to increase the number
of visitors [20,23]. In addition, the observed results were similar to the literature that indicated road
networks could be employed as a good indicator to detect human-caused fires [24,25].Remote Sens. 2018, 10, 923 8 of 14
Remote Sens. 2018, 10, x FOR PEER REVIEW 8 of 14
Figure 5. Dynamics
Figure 5. Dynamicsofofhuman-
human-andand lightning-caused
lightning-caused SFDSFD
mapsmaps in terms
in terms of theirofpercentage
their percentage of
of detected
detected fires and percentage of area under each of the danger
fires and percentage of area under each of the danger classes. classes.
4.2. Enhacing the Remote Sensing-Based FFDFS and Its Incorporation with the SFD Maps
In case of the lightning-caused SFD map, we observed that 38.4% of the fire events fell within
Upon of
the extent implementing
the high danger the class;
proposed
whilemodifications
80.8% and 19.2% on of
thethe
remote
study sensing-based
area fell under FFDFS,
the low andand
combining that with the 500 m road buffer and lightning-caused SFD map,
high danger classes, respectively. Our findings of a relative smaller amount of detected fires would be we evaluated their
performance
quite normal against
due to the thefact
ground-based forestoffire
that the location spots during
lightning the period
strikes would 2009–2011
be random fire seasons
as influenced by
(Table 2). We conditions
atmospheric found a reasonable
[22,26,27].amount of fires,actual
In addition, i.e., about 77% of would
fire events the firealso
events fell inon
depend thevegetation
top three
fire
coverdanger classes
(in other of extremely
words, high, very
fuel availability), high,
their andand
states, high categories
fuel continuity (Table 2). In fact, our findings
[22,28–30].
were quite similar in comparison to the outcome of the original FFDFS (i.e., about 77%) reported in
4.2. Enhacingand
Chowdhury the Remote
HassanSensing-Based FFDFS and
[8]. We also calculated the Itsareas
Incorporation
under eachwith ofthe
theSFD
fire Maps
danger classes, where
aboutUpon50% of the study areathe
implementing fellproposed
under lowmodifications
and moderateondanger classessensing-based
the remote (Table 3). We wereFFDFS, unable
and
to compare this result as Chowdhury and Hassan [8] did not report
combining that with the 500 m road buffer and lightning-caused SFD map, we evaluated their a similar analysis.
It is interesting
performance againsttothe note that our proposed
ground-based forest modifications
fire spots during werethequite
periodeffective. For example,
2009–2011 the
fire seasons
use of cloud-contaminant
(Table 2). We found a reasonable pixels in the image
amount as low
of fires, i.e.,danger reduced
about 77% of thethe computational
fire timetop
events fell in the and no
three
significant impact on the outcomes. In fact, another study reported a negative
fire danger classes of extremely high, very high, and high categories (Table 2). In fact, our findings correlation between
cloudiness
were quite and forest
similar in fire occurrences
comparison [31].
to the Additionally,
outcome the computation
of the original FFDFS (i.e., of NDWI
about was
77%)relatively
reported
simple, which was also used in describing fire danger conditions in other
in Chowdhury and Hassan [8]. We also calculated the areas under each of the fire danger classes, studies [16,32]. Finally, the
time step of Ts, i.e., from 8-day to daily-scale, would be useful as the
where about 50% of the study area fell under low and moderate danger classes (Table 3). We were temperature would be known
as moreto
unable dynamic
compare inthis
the result
shorter astime-scale.
Chowdhury and Hassan [8] did not report a similar analysis.
It is interesting to note that our proposed modifications were quite effective. For example, the use
of cloud-contaminant pixels in the image as low danger reduced the computational time and no
significant impact on the outcomes. In fact, another study reported a negative correlation between
cloudiness and forest fire occurrences [31]. Additionally, the computation of NDWI was relatively
simple, which was also used in describing fire danger conditions in other studies [16,32]. Finally,
the time step of Ts, i.e., from 8-day to daily-scale, would be useful as the temperature would be known
as more dynamic in the shorter time-scale.Remote Sens. 2018, 10, 923 9 of 14
Table 2. Comparison of the modified FFDFS and its integration with road buffers and lightning-caused SFD maps against the ground-based forest fire spots in terms
of fire detection performance.
Modified FFDFS + Road
Original FFDFS Modified FFDFS Modified FFDFS + Road Buffer Modified FFDFS + Lightning
Buffer + Lightning
Year Danger Class
% of:
Detected Fires Cumulative (↓) Detected Fires Cumulative (↓) Detected Fires Cumulative (↓) Detected Fires Cumulative (↓) Detected Fires Cumulative (↓)
Extremely High 8.96 8.96 10.39 10.39 19.48 19.48 19.48 19.48 31.17 31.17
Very High 28.36 37.31 33.12 43.51 29.87 49.35 29.22 48.70 38.31 69.48
2009 High 36.57 73.88 28.57 72.08 28.57 77.92 27.27 75.97 23.38 92.86
Moderate 20.90 94.78 22.73 94.81 18.18 96.10 20.78 96.75 7.14 100.00
Low 5.22 100.00 5.19 100.00 3.90 100.00 3.25 100.00 0.00 100.00
Extremely High 14.88 14.88 8.08 8.08 15.66 15.66 24.75 24.75 40.91 40.91
Very High 30.95 45.83 43.94 52.02 49.49 65.15 36.36 61.11 37.37 78.28
2010 High 30.36 76.19 26.77 78.79 16.67 81.82 20.71 81.82 12.63 90.91
Moderate 19.64 95.83 15.66 94.44 12.63 94.44 15.15 96.97 8.59 99.49
Low 4.17 100.00 5.56 100.00 5.56 100.00 3.03 100.00 0.51 100.00
Extremely High 15.45 15.45 11.11 11.11 36.30 36.30 25.19 25.19 49.63 49.63
Very High 36.59 52.03 41.48 52.59 31.11 67.41 31.85 57.04 28.15 77.78
2011 High 30.08 82.11 26.67 79.26 17.78 85.19 27.41 84.44 17.04 94.81
Moderate 13.82 95.93 14.07 93.33 8.89 94.07 10.37 94.81 5.19 100.00
Low 4.07 100.00 6.67 100.00 5.93 100.00 5.19 100.00 0.00 100.00
Extremely High 13.09 13.09 9.86 9.86 23.81 23.81 23.14 23.14 40.57 40.57
Very High 31.97 45.06 39.51 49.37 36.83 60.64 32.48 55.62 34.61 75.18
2009–2011 High 32.34 77.39 27.34 76.71 21.01 81.64 25.13 80.75 17.68 92.86
Moderate 18.12 95.51 17.49 94.19 13.23 94.87 15.43 96.18 6.97 99.83
Low 4.49 100.00 5.81 100.00 5.13 100.00 3.82 100.00 0.17 100.00Remote Sens. 2018, 10, 923 10 of 14
Table 3. Comparison of the modified FFDFS and its integration with road buffers and lightning-caused SFD maps against the ground-based forest fire spots in terms
of areas under the fire danger classes *.
Modified FFDFS Modified FFDFS + Road Buffer Modified FFDFS + Lightning Modified FFDFS + Road Buffer + Lightning
Year Danger Class
Area (%) Cumulative (↑) Area (%) Cumulative (↑) Area (%) Cumulative (↑) Area (%) Cumulative (↑)
Extremely High 2.57 100.00 5.24 100.00 7.77 100.00 9.84 100.00
Very High 21.75 97.42 22.39 94.76 22.96 92.23 23.42 90.16
2009 High 26.95 75.67 27.81 72.37 28.75 69.27 29.37 66.74
Moderate 34.72 48.72 32.10 44.56 29.71 40.52 27.72 37.37
Low 14.00 14.00 12.46 12.46 10.81 10.81 9.65 9.65
Extremely High 1.94 100.00 4.61 100.00 7.13 100.00 9.16 100.00
Very High 21.77 98.07 22.17 95.39 22.78 92.88 23.07 90.84
2010 High 25.51 76.30 26.76 73.22 27.81 70.10 28.78 67.77
Moderate 36.13 50.79 33.58 46.46 30.99 42.29 29.05 38.99
Low 14.66 14.66 12.88 12.88 11.30 11.30 9.94 9.94
Extremely High 2.56 100.00 4.88 100.00 7.61 100.00 9.33 100.00
Very High 21.10 97.44 21.87 95.12 22.39 92.40 22.96 90.67
2011 High 25.72 76.34 27.26 73.25 27.88 70.01 29.13 67.71
Moderate 35.98 50.62 33.20 45.99 30.76 42.13 28.66 38.58
Low 14.64 14.64 12.79 12.79 11.37 11.37 9.92 9.92
Extremely High 2.36 100.00 4.91 100.00 7.50 100.00 9.44 100.00
Very High 21.54 97.64 22.14 95.09 22.71 92.50 23.15 90.55
2009–2011 High 26.06 76.10 27.28 72.95 28.15 69.79 29.09 67.40
Moderate 35.61 50.04 32.96 45.67 30.48 41.64 28.47 38.31
Low 14.43 14.43 12.71 12.71 11.16 11.16 9.84 9.84
* In the original FFDFS, Chowdhury and Hassan [8] did not report occupied aresa under each of the fire danger classes.Remote Sens. 2018, 10, 923 11 of 14
Once we added the road buffer to the modified FFDFS, the amount of detected fires increased
from about 77% to 82%, which demonstrated the effectiveness of employing such a buffer zone
around the road networks in detecting fire events. As a matter of fact, such an improvement was
expected as roadsides would be used by the people for various activities, as described in Section 4.1.
When we incorporated the lightning-caused SFD map with modified FFDFS, the amount of detected
fires improved from about 77% to 81%, which was similar to the addition of road buffer to the modified
FFDFS. Finally, when we incorporated both road buffer and lightning-caused SFD map with the
modified FFDFS, we observed a very large improvement, i.e., about 16% in the amount of detected fires
by the system. In this case, about 93% of the fires fell in the top three fire danger classes, which were the
highest among all the combinations evaluated. In addition to the amount of detected fires by each of
the proposed combinations with the modified FFDFS, we also calculated the area under each of the fire
danger classes in order to comprehend the system performance (Table 2). Then, we compared the area
in the bottom two fire danger classes, i.e., moderate and low classes for the three combinations with
the modified FFDFS. In this case, we found that the combination of the road buffer with the modified
FFDFS was best, e.g., about 46% of the area fell under the low and moderate danger classes, which was
about 4% less compared to that of the modified FFDFS. The decrease in overlap continued when we
incorporated the lightning-caused SFD map with the modified FFDFS. In this case, the reduction
happened from about 50% to about 42%. Finally, employing both the road buffer and lightning-caused
SFD map with the modified FFDFS caused a decrease of 12% falling (i.e., from about 50% to 38%).
The reason for the loss in area would be related to assigning the generated moderate fire danger class
into a higher class where the human- (road buffer) and/or lightning-caused SFD maps showed a “high
fire danger” condition. From an operational point of view, it would be highly desirable to keep more
and more area under the low and moderate danger classes at the highest possible level. That way
fire-fighting efforts could be concentrated over the top three fire danger classes of extremely high, very
high, and high. Consequently, we considered that the incorporation of the human-caused SFD with
the modified FFDFS was the best from an operational perspective.
Figure 6 shows an example of fire danger maps generated on 14 May 2011 by the modified remote
sensing-based FFDFS using the individual variable (i.e., Ts, PW, NDVI, and NDWI)-specific danger
conditions, which was then integrated with the human- (road buffer) and lightning-caused SFD maps.
As the remote sensing-derived variables were dynamic in nature at daily (for Ts, and PW) and 8-day
time scales (for NDVI, and NDWI), they would be the prime controller of the final outcomes depicted
in Panels A, A + B, A + C, and A + B + C.
Despite, the reasonable performance of the modified FFDFS in conjunction with the road
buffer-based SFD map, some of the fires, i.e., about 18% on an average during 2009–2011 fell
under the moderate and low fire danger classes. This issue could be improved by integrating other
variables, such as: (a) vegetation phenological stages, as that would affect the fuel availability for fire
occurrences [33]; (b) atmospheric conditions, as those would regulate the lightning strikes [22,26,27];
and (c) topographical features, as those might influence the vegetation conditions [34].Remote Sens. 2018, 10, 923 12 of 14
Remote Sens. 2018, 10, x FOR PEER REVIEW 12 of 14
Figure 6. Example of fire danger maps produced on 14 May 2011 by the modified remote sensing-
Figure 6. Example of fire danger maps produced on 14 May 2011 by the modified remote sensing-based
based FFDFS using the individual variable (Ts, PW, NDVI, and NDWI)-specific danger conditions;
FFDFS using the individual variable (Ts, PW, NDVI, and NDWI)-specific danger conditions; which
which was then integrated with the human- and lightning-caused SFD maps.
was then integrated with the human- and lightning-caused SFD maps.
5. Concluding Remarks
5. Concluding Remarks
In this paper, we demonstrated a simple, but effective framework for forest fire danger
In this paper, we demonstrated a simple, but effective framework for forest fire danger forecasting
forecasting and its implementation over the forested regions in the northern portion of Alberta. We
and its implementation over the forested regions in the northern portion of Alberta. We first applied
first applied three modifications on the original FFDFS: (i) improving the temporal resolution of the
three modifications on the original FFDFS: (i) improving the temporal resolution of the employed
employed Ts from 8-day to daily-scale; (ii) reducing the system computation time by removing the
Ts from 8-day to daily-scale; (ii) reducing the system computation time by removing the gap-filling
gap-filling algorithm upon assuming that the cloud-contaminant pixels would exhibit low fire danger
algorithm upon assuming that the cloud-contaminant pixels would exhibit low fire danger conditions;
conditions; and (iii) substituting the employed NMDI by a simpler vegetation index of NDWI. In
and (iii) substituting the employed NMDI by a simpler vegetation index of NDWI. In addition,
addition, we evaluated the outcome of modified FFDFS by combining two fire ignitions source-based
we evaluated the outcome of modified FFDFS by combining two fire ignitions source-based SFD maps
SFD maps derived from historical human- and lightning-caused fires during 1961–2014. Then we
examined the outcomes of the different combinations against the actual fire spots during the fireRemote Sens. 2018, 10, 923 13 of 14
derived from historical human- and lightning-caused fires during 1961–2014. Then we examined the
outcomes of the different combinations against the actual fire spots during the fire seasons of 2009–2011.
Among all of the combinations, we found that the integration of modified FFDFS and a road buffer
(human-caused SFD map) demonstrated the most effective results in fire detection, i.e., about 82%
on an average in the top three fire danger classes, where about 46% of the study area fell under the
moderate and low danger categories. Despite these favourable results, we strongly recommend that
our proposed system should be thoroughly evaluated before being implemented in other ecosystems
in Canada and elsewhere in the world.
Author Contributions: Conceptualization: M.A. and Q.K.H.; formal analysis: M.A. and Q.K.H.; funding
acquisition: M.A. and Q.K.H.; investigation: M.A., T.I., A.G., and Q.K.H.; methodology: M.A. and Q.K.H.;
supervision: Q.K.H.; and validation: M.A. and Q.K.H.
Acknowledgments: This study was partially funded by the: (i) Ministry of Science, Research, and Technology
of Iran via offering the PhD scholarship to M.A.; and (ii) Natural Sciences and Engineering Research Council of
Canada Discovery Grant to Q.K.H. We would also like to thank NASA and Alberta Forest Service for providing
MODIS and fire spots data, respectively, at free of cost.
Conflicts of Interest: The authors declare no conflict of interest.
References
1. Akther, M.S.; Hassan, Q.K. Remote Sensing-Based Assessment of Fire Danger Conditions Over Boreal Forest.
IEEE J. Sel. Top. Appl. Earth Obs. Remote Sens. 2011, 4, 992–999. [CrossRef]
2. Booth, B.; Bellouin, N. Black carbon and atmospheric feedbacks. Nature 2015, 519, 167–168. [CrossRef]
[PubMed]
3. Ahmed, M.R.; Rahaman, K.R.; Hassan, Q.K. Remote Sensing of Wildland Fire-Induced Risk Assessment at
the Community Level. Sensors 2018, 18, 1570. [CrossRef] [PubMed]
4. Williamson, G.J.; Bowman, D.M.; Price, O.F.; Henderson, S.B.; Johnston, F.H. A transdisciplinary approach
to understanding the health effects of wildfire and prescribed fire smoke regimes. Environ. Res. Lett. 2015,
11, 125009. [CrossRef]
5. Sow, M.; Mbow, C.; Hély, C.; Fensholt, R.; Sambou, B. Estimation of Herbaceous Fuel Moisture Content
Using Vegetation Indices and Land Surface Temperature from MODIS Data. Remote Sens. 2013, 5, 2617–2638.
[CrossRef]
6. Qi, Y.; Dennison, P.E.; Spencer, J.; Riano, D. Monitoring live fuel moisture using soil moisture and remote
sensing proxies. Fire Ecol. 2012, 8, 71–87. [CrossRef]
7. Wang, L.; Qu, J.J.; Hao, X. Forest fire detection using the normalized multi-band drought index (NMDI) with
satellite measurements. Agric. For. Meteorol. 2008, 148, 1767–1776. [CrossRef]
8. Chowdhury, E.H.; Hassan, Q.K. Development of a New Daily-Scale Forest Fire Danger Forecasting System
Using Remote Sensing Data. Remote Sens. 2015, 7, 2431–2448. [CrossRef]
9. Bisquert, M.M.; Sánchez, J.M.; Caselles, V. Fire danger estimation from MODIS Enhanced Vegetation Index
data: Application to Galicia region (north-west Spain). Int. J. Wildl. Fire 2011, 20, 465. [CrossRef]
10. Chowdhury, E.H.; Hassan, Q.K. Operational perspective of remote sensing-based forest fire danger
forecasting systems. ISPRS J. Photogramm. Remote Sens. 2015, 104, 224–236. [CrossRef]
11. Preisler, H.K.; Burgan, R.E.; Eidenshink, J.C.; Klaver, J.M.; Klaver, R.W. Forecasting distributions of large
federal-lands fires utilizing satellite and gridded weather information. Int. J. Wildl. Fire 2009, 18, 508–516.
[CrossRef]
12. Bisquert, M.M.; Caselles, E.; Snchez, J.M.; Caselles, V. Application of artificial neural networks and logistic
regression to the prediction of forest fire danger in Galicia using MODIS data. Int. J. Wildl. Fire 2012, 21,
1025–1029. [CrossRef]
13. Chowdhury, E.H.; Hassan, Q.K. Use of remote sensing-derived variables in developing a forest fire danger
forecasting system. Nat. Hazards 2013, 67, 321–334. [CrossRef]
14. Li, X.; Lanorte, A.; Telesca, L.; Song, W.; Lasaponara, R. Assessment of MODIS-Based NDVI-Derived Index
for Fire Susceptibility Estimation in Northern China. In Computational Science and Its Applications; Springer:
Berlin, Germany, 2015; Volume 9155, pp. 193–203, ISBN 978-3-319-21469-6.Remote Sens. 2018, 10, 923 14 of 14
15. Liu, W.; Wang, S.; Zhou, Y.; Wang, L.; Zhu, J.; Wang, F. Lightning-caused forest fire risk rating assessment
based on case-based reasoning: A case study in DaXingAn Mountains of China. Nat. Hazards 2016, 81,
347–363. [CrossRef]
16. Arganaraz, J.P.; Landi, M.A.; Bravo, S.J.; Gavier-Pizarro, G.I.; Scavuzzo, C.M.; Bellis, L.M. Estimation of Live
Fuel Moisture Content From MODIS Images for Fire Danger Assessment in Southern Gran Chaco. IEEE J.
Sel. Top. Appl. Earth Obs. Remote Sens. 2016, 9, 5339–5349. [CrossRef]
17. Yu, B.; Chen, F.; Li, B.; Wang, L.; Wu, M. Fire Risk Prediction Using Remote Sensed Products: A Case of
Cambodia. Photogramm. Eng. Remote Sens. 2017, 83, 19–25. [CrossRef]
18. Downing, D.J.; Pettapiece, W.W. Natural Regions and Subregions of Alberta; Government of Alberta:
Edmonton, AB, Canada, 2006.
19. Costafreda-Aumedes, S.; Vega-Garcia, C. ANN multivariate analysis of factors that influence human-caused
multiple fire starts. In Advances in Forest Fire Research; Imprensa da Universidade de Coimbra:
Coimbra, Portugal, 2014; Volume 4, pp. 1787–1798, ISBN 9789892608846.
20. Wang, Y.; Anderson, K.R. An evaluation of spatial and temporal patterns of lightning- and human-caused
forest fires in Alberta, Canada, 1980–2007. Int. J. Wildl. Fire 2010, 19, 1059–1072. [CrossRef]
21. Martínez, J.; Vega-Garcia, C.; Chuvieco, E. Human-caused wildfire risk rating for prevention planning in
Spain. J. Environ. Manag. 2009, 90, 1241–1252. [CrossRef] [PubMed]
22. Krawchuk, M.A.; Cumming, S.G.; Flannigan, M.D.; Wein, R.W. Biotic and abiotic regulation of lightning fire
inititation in the mixedwood boreal forest. Ecology 2006, 87, 458–468. [CrossRef] [PubMed]
23. Camp, P.E.; Krawchuk, M.A. Spatially varying constraints of human-caused fire occurrence in British
Columbia, Canada. Int. J. Wildl. Fire 2017, 26, 219–229. [CrossRef]
24. Guo, F.; Su, Z.; Wang, G.; Sun, L.; Lin, F.; Liu, A. Wildfire ignition in the forests of southeast China: Identifying
drivers and spatial distribution to predict wildfire likelihood. Appl. Geogr. 2016, 66, 12–21. [CrossRef]
25. Adab, H.; Kanniah, K.D.; Solaimani, K.; Sallehuddin, R. Modelling static fire hazard in a semi-arid region
using frequency analysis. Int. J. Wildl. Fire 2015, 24, 763–777. [CrossRef]
26. Abatzoglou, J.T.; Kolden, C.A.; Balch, J.K.; Bradley, B.A. Controls on interannual variability in
lightning-caused fire activity in the western US. Environ. Res. Lett. 2016, 11. [CrossRef]
27. Podur, J.; Martell, D.L.; Csillag, F. Spatial patterns of lightning-caused forest fires in Ontario, 1976–1998.
Ecol. Model. 2003, 164, 1–20. [CrossRef]
28. Frost, C. Presettlement fire frequency regimes of the United States: A first approximation. In Fire in Ecosystem
Management: Shifting the Paradigm from Suppression to Prescription; Proceedings of the Tall Timbers Fire Ecology
Conference, Tallahassee, FL, USA, 14–16 April 1998; Tall Timbers Research Station: Tallahassee, FL, USA, 1998;
Volume 20, pp. 70–81.
29. Calef, M.P.; Varvak, A.; McGuire, A.D. Differences in human versus lightning fires between urban and rural
areas of the boreal forest in interior Alaska. Forests 2017, 8, 422. [CrossRef]
30. Kilinc, M.; Beringer, J. The spatial and temporal distribution of lightning strikes and their relationship with
vegetation type, elevation, and fire scars in the northern Territory. J. Clim. 2007, 20, 1161–1173. [CrossRef]
31. Živanovic, S.; Zigar, D. Monitoring of cloudiness in the function of the forests fire protection.
Acta Agric. Serbica 2016, 41, 3–15. [CrossRef]
32. Bisquert, M.; Sánchez, J.; Caselles, V. Modeling Fire Danger in Galicia and Asturias (Spain) from MODIS
Images. Remote Sens. 2014, 6, 540–554. [CrossRef]
33. De Angelis, A.; Bajocco, S.; Ricotta, C. Phenological variability drives the distribution of wildfires in Sardinia.
Landsc. Ecol. 2012, 27, 1535–1545. [CrossRef]
34. Abdollahi, M.; Hassan, Q.K.; Chowdhury, E.H.; Gupta, A. Exploring the relationships between topographical
elements and forest fire occurrences in Alberta, Canada. In Remote Sensing of Hydro-Meteorological Hazards;
Petropoulos, G., Islam, T., Eds.; CRC Press: Boca Raton, FL, USA, 2017.
© 2018 by the authors. Licensee MDPI, Basel, Switzerland. This article is an open access
article distributed under the terms and conditions of the Creative Commons Attribution
(CC BY) license (http://creativecommons.org/licenses/by/4.0/).You can also read