An Assessment of the Impacts of Climate Change on the Great Lakes - by Scientists and Experts from Universities and Institutions in the Great ...
←
→
Page content transcription
If your browser does not render page correctly, please read the page content below
An Assessment of the Impacts of
Climate Change on the Great Lakes

  by Scientists and Experts from Universities and
      Institutions in the Great Lakes Region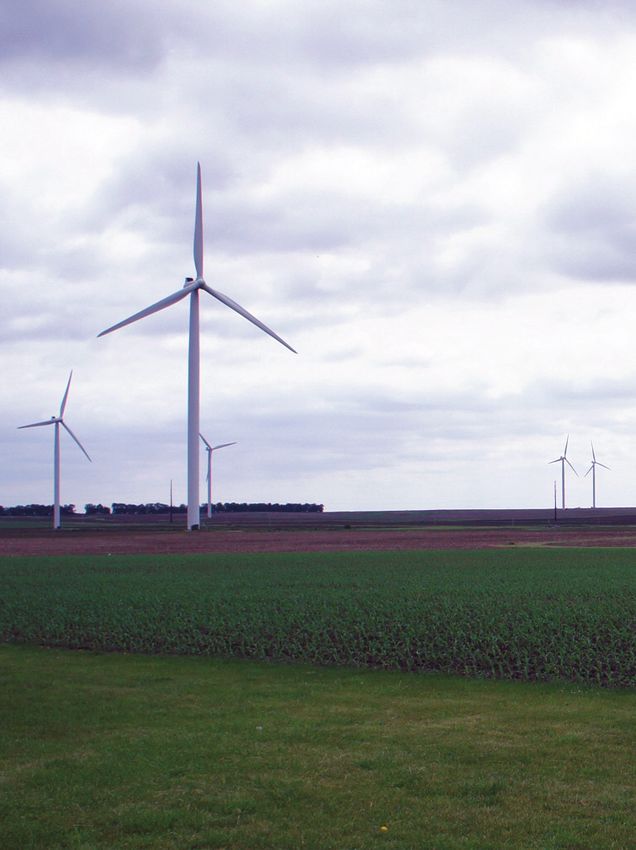
The Environmental Law & Policy Center, in concert with the Chicago Council on Global Affairs,
commissioned the following scientists and experts to produce this report pro bono to educate
policymakers and the public about the significant changes affecting the Great Lakes, and the
vital importance of taking actions now to protect our natural resources.

                                      Donald Wuebbles, University of Illinois
                                     Bradley Cardinale, University of Michigan
                                         Keith Cherkauer, Purdue University
                            Robin Davidson-Arnott, University of Guelph, Ontaria, Canada
                                    Jessica Hellmann, University of Minnesota
                                      Dana Infante, Michigan State University
                                 Lucinda Johnson, University of Minnesota, Duluth
                                Rob de Loë, University of Waterloo, Ontario, Canada
                                             Brent Lofgren, NOAA GLERL
                                     Aaron Packman, Northwestern University
                             Frank Seglenieks, Environment and Climate Change Canada
                 Ashish Sharma, University of Notre Dame and University of Illinois at Urbana-Champaign
                                     Brent Sohngen, The Ohio State University
                                 Michael Tiboris, Chicago Council on Global Affairs
                                  Daniel Vimont, University of Wisconsin, Madison
                                      Robyn Wilson, The Ohio State University
                          Kenneth Kunkel, North Carolina State University and NOAA CICS-NC
                         Andrew Ballinger, North Carolina State University and NOAA CICS-NC

Table of Contents
Executive Summary..................................................................................................................1
1. Introduction............................................................................................................................5
       1.1 Importance of the Great Lakes........................................................................................6
       1.2 Climate change: From global to the Great Lakes region............................................7
       1.3 Potential risks and vulnerabilities for the Great Lakes.............................................8
       1.4 Public perception of the Great Lakes: Value and vulnerability..................................8
2. Regional climate change in the Great Lakes..................................................................9
       2.1 Air temperature changes and trends........................................................................10
       2.2 Precipitation trends...................................................................................................13
       2.3 Extreme events..........................................................................................................13
       2.4 Cold-season processes (snow and ice).......................................................................14
3. Changes in the Great Lakes...............................................................................................16
     3.1 Changes in lake temperature and stratification.........................................................16
     3.2 Great Lakes ice cover trends.....................................................................................17
     3.3 Hydrologic trends......................................................................................................18
     3.4 Changes in lake level.................................................................................................20
4. Changes in Great Lakes watershed hydrology.............................................................21
     4.1 Climate change effects on lake hydrology..................................................................21
     4.2 Land use / land cover change.....................................................................................22
     4.3 Agricultural watersheds and agricultural impacts.....................................................23
     4.4 Urban watersheds and urban impacts on the Great Lakes..........................................24
     4.5 Water quality impacts on the Great Lakes..................................................................25
5. Impacts on lake ecology...................................................................................................26
     5.1 Mixing and oxygenation............................................................................................27
     5.2 Biodiversity and invasive species..............................................................................27
     5.3 Nutrient loading and algal blooms.............................................................................29
     5.4 Fish............................................................................................................................31
     5.5 Wildlife......................................................................................................................34
     5.6 Coastal ecosystems...................................................................................................36
     5.7 Coastal processes......................................................................................................37
6. Public and economic impacts of changes to the Great Lakes....................................39
     6.1 Shipping....................................................................................................................40
     6.2 Water supply.............................................................................................................40
     6.3 Infrastructure............................................................................................................41
     6.4 Recreation.................................................................................................................43
     6.5 Public health..............................................................................................................45
     6.6 Impacts on Indigenous People in the Great Lakes Basin............................................46
     6.7 Industrial needs for water..........................................................................................46
7. Conclusions ........................................................................................................................48
References.........................................................................................................................49
Executive Summary
Introduction                                                       of migratory birds and waterfowl. More than 3,500 species
Climate change is causing significant and far-reaching             of plants and animals use its large network of streams,
impacts on the Great Lakes and the Great Lakes region.             lakes, inland wetlands, coastal marshes and forests. Many
In recent years, our planet has experienced some of the            of these species are rare or are found nowhere else.
warmest temperatures ever recorded, record-breaking
weather extremes, powerful storms, increasing tragic               The Great Lakes are large enough to themselves influence
flooding from rising sea levels and associated storm surge,        weather in the region. The Lakes moderate temperatures
huge wildfires, and continued melting of glaciers and polar        throughout the year, helping to cool nearby lands in the
sea ice. The accelerating pattern of changes in the Earth’s        summer and warm them in winter. Their humidity feeds
climate is affecting the Great Lakes. Here, we draw on the         cloud cover and precipitation both over the lakes and
array of existing research to assess how the shifting global       downwind. That causes both “lake effect” snowstorms,
climate impacts the unique Great Lakes region.                     and summer rainfall that provides ideal growing conditions
                                                                   for orchards in Michigan’s “fruit belt.”
The Great Lakes have an enormous impact, seen and unseen,
on the 34+ million people who live within its Basin. These         Climate change presents challenges to the Great Lakes,
millions of people rely on the freshwater lakes for drinking       with complicated effects and inter-relationships.
water, fisheries, recreation, and commerce and industry.
The Great Lakes contain 5,500 cubic miles of freshwater,           Air Temperature Increases
one of the very largest freshwater resources in the world.         The Great Lakes region has tracked global increases in
The Great Lakes support one of the world’s largest regional        temperature and outpaced trends in some parts of the
economies similar to those of whole developed nations.             contiguous United States. Between 1901-1960 and 1985-
Agriculture, industrial manufacturing, fishing, and recreation     2016, the Great Lakes basin has warmed 1.6°F in annual
together form an economic engine. Regional fisheries alone         mean temperature, exceeding average changes of 1.2°F for
represent a $7 billion per year industry. Tourism generates        the rest of the contiguous United States. By the end of the
$16 billion more.                                                  21st century, global average temperatures are expected
                                                                   to rise an additional 2.7°F to 7.2°F, depending on future
Heavy human use over the past two centuries has taken its          greenhouse gas emissions, with corresponding changes in
toll in the forms of habitat loss and fragmentation, influxes of   the Great Lakes region.
invasive species, and polluted air, water, and sediments. Soil
and nutrient runoff from agricultural fields and concentrated      Heavy Precipitation and Flooding
animal feedlot operations (CAFOs) imperil water quality and        A warmer atmosphere holds more moisture, increasing
wildlife populations in many parts of the basin, threatening       the frequency and intensity of heavy rain and snow
public and wildlife health and the economic vitality of the        events. Overall U.S. annual precipitation increased 4%
region. Climatic changes now underway further stress these         between 1901 and 2015, but the Great Lakes region saw
ecosystems, alternatively raising and lowering lake levels         an almost 10% increase over this interval with more of
and threatening the region in new ways.                            this precipitation coming as unusually large events. In
                                                                   the future, precipitation will likely redistribute across the
The Great Lakes sustain remarkable populations of fish and         seasons. We expect wetter winters and springs, while
habitats for wildlife. More than 170 species of fish live in       summer precipitation should decrease by 5-15% for most
the lakes, streams, rivers, and connecting waterways. Trout,       of Great Lake states by 2100.
sturgeon, walleye, lake whitefish and other varieties of fish
are once again becoming plentiful among the five Great             These increases in precipitation will likely increase flooding
Lakes. The basin’s ecosystems support wolves and moose             across the Great Lakes region. In cities with abundant roofs,
while providing resting and breeding grounds for large flocks      concrete, and other impermeable surfaces, this will likely

1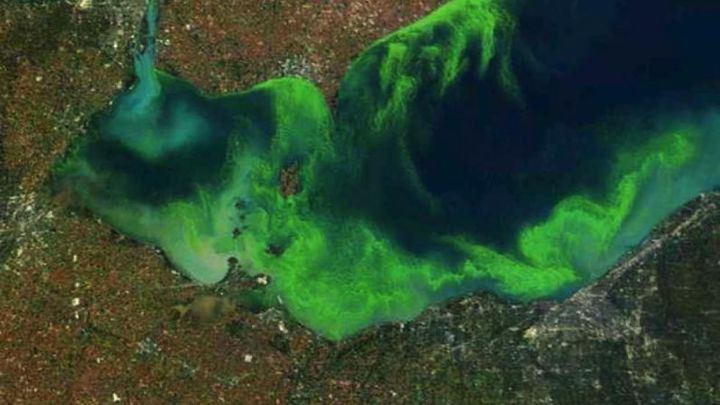
damage homes, roadways, and other infrastructure. In rural
areas, intense rains and melting snows will increase runoff      Yet, even with increased water management in agricultural
and erode soils. In rural areas, increased flooding will also    watersheds, climate change will likely reduce crop yields
cause soil erosion. In combination with more unpredictable       for both soybean and maize by 10% - 30% by mid-century in
precipitation and warmer temperatures, these effects could       the southern parts of the Great Lakes watershed. Soybean
seriously curtail Midwestern agricultural production.            and maize production will likely move northward.

Extreme Weather                                                  Urban Issues
Climate change is causing more extreme weather across            In the summer, high temperatures and heat waves cause
the United States. Heat waves have become more common            poorer air quality, which harms public health, especially
since the 1960s while extreme cold temperatures have             for the most vulnerable people – the elderly and children
generally decreased. Intense summer storms occur more            with asthma. For the many millions of people living in
often as temperatures rise.                                      urban areas across the Great Lakes states, heat waves
                                                                 and summer air pollution events increase the risk for heat-
Extreme weather events have already taken their toll on          related illness, respiratory diseases, and death.
the Midwest. The 2012 Midwestern heat wave and drought
caused more than $30 billion in economic damage, 123             Projected increases in extreme precipitation will likely
deaths, and harmful long-term health impacts across most         exacerbate flooding, especially in winter, spring, and
of the central and western United States.                        during summer thunderstorms. Extreme winter rain events
                                                                 in 2017 and 2018 led to serious flooding. Rain events
Extremely warm days (above 90°F) will increase for states        exceeding 6 inches now occur regularly, exceeding the
bordering the Great Lakes, especially in the southern parts      capacity of culverts and storm sewers to handle runoff.
of the region. By century’s end, the region will experience      Under-resourced communities in low-lying, flood-prone
30 to 60 additional days each year of these extremely warm       areas have become vulnerable to infrastructure damage,
temperatures. Areas within the Great Lakes Basin will see        transportation barriers, and displacement from homes due
an increase of 17 to 40 extremely warm days as annual            to these intensified floods.
average temperatures continue to rise.
                                                                 Water Quality and Consumption
Meanwhile, in states surrounding the Great Lakes, the            Climate change will likely threaten drinking water quality
number of extremely cold days (with temperature less than        and place great stress on water infrastructure. For example,
32°F) will decrease significantly. Lake effect snowfalls could   in southern Wisconsin, extreme precipitation could rise by
be even more dramatic, particularly across the Lake Ontario      10% to 40%, overloading water treatment infrastructure,
snowbelt in upper western areas of New York state where          increasing sewer overflows, and increasing the quantity
three- and four-feet snowstorms are already routine.             of water-born pathogens flowing into streams, rivers, and
                                                                 Lake Michigan.
Agriculture, Irrigation, and Decreased Crop Yields
Changes in seasonal precipitation are already affecting          The Great Lakes have higher levels of E. coli bacteria than
farmers in Midwestern states, with planting delays caused        other U.S. coastal regions. This untreated effluent is a
by spring flooding and excessively wet soil conditions.          public health hazard and economically costly to mitigate.
Delayed planting puts crops at greater risk during hotter        Cities like Chicago have spent enormous sums to protect
and drier conditions later in the growing season, and that       against water pollution. Nutrients (primarily nitrogen and
increases the demand for irrigation to mitigate crop losses.     phosphorous) run off from farms into surface waters during
Hot temperatures interfere with pollination in corn and other    intense rain events. These excess nutrients threaten human
crops, thereby reducing yields.                                  health both directly (e.g., “blue baby” syndrome) and

                                                                                                                           2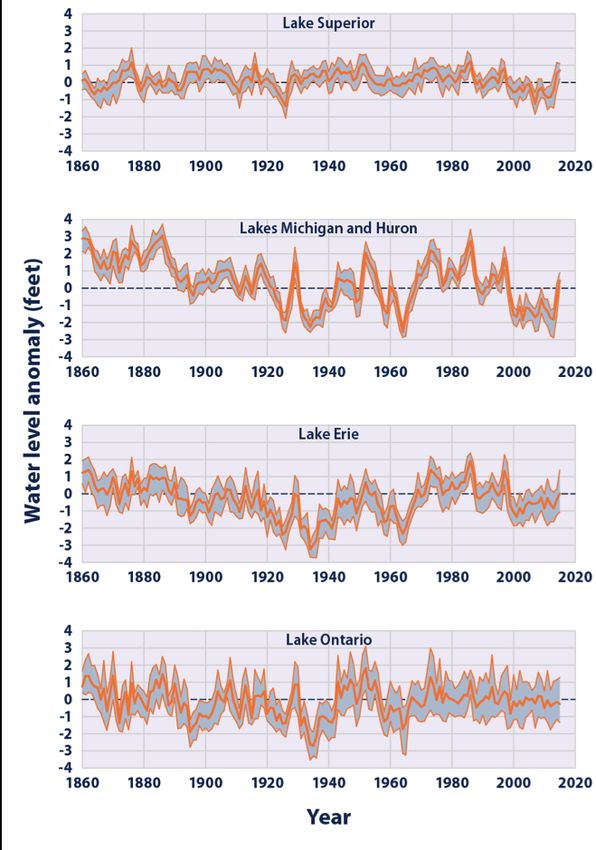
indirectly by contributing to toxic harmful algal blooms in      For example, game fish like bluegill, smallmouth bass,
shallow water bays of the Great Lakes and the “dead zone”        largemouth bass, and brown bullhead have migrated
in the Gulf of Mexico that has decimated shellfisheries.         poleward as water warms in those areas. This may
                                                                 increase diversity of species in some Ontario lakes by as
In 2011, Lake Erie experienced the largest harmful algal         much as 81% by the end of the century. Growth rates of
bloom in its recorded history, with peak intensity more than     yellow perch, lake whitefish, and many others, however,
three times greater than any previously observed blooms. In      are likely to decrease.
2014, 500,000 people in the Toledo area were without safe
local drinking water supplies for 72 hours because of toxic      Wildlife
algae blooms in western Lake Erie. Algal blooms will likely      The Great Lakes region supports many species of mammals,
become more frequent in the future as higher temperatures        birds, amphibians, reptiles, and macroinvertebrates. As air
and heavy precipitation mix heavy nutrient loads with            temperatures increase and precipitation patterns shift,
warmer waters. These pollutants have dramatically raised         habitat conditions, soil moisture, and other conditions will
the cost of water treatment.                                     shift, thereby driving some wildlife species northward and
                                                                 others westward. Individual species however, will respond
Lake Ecology                                                     in different ways to local conditions such as ice cover on
Climate change has already increased bacteria levels in the      lakes and specific patterns of regional precipitation.
Great Lakes, as the water warms earlier in the spring and
warming contributes to vertical mixing that changes lake         Among mammals, moose may be especially vulnerable to
ecosystems. Sewer overflows, the dumping of ship ballast         climate change. In Minnesota, moose populations have
water, and nutrient runoff from agriculture and industry         already declined precipitously. Moose density is expected
all contribute to growth of bacteria and several invasive        to also decline at southern parts of the Ontario region and
species in the lakes. Heavier rainstorms and warmer              increase at northern extents. Milder winters increase
weather exacerbate these challenges.                             overwinter survival in white-tailed deer allowing them to
                                                                 expand northward into habitats historically dominated by
Hundreds of new species of pathogenic bacteria, viruses,         moose.
protozoa, and non-native species could be introduced and
flourish in the warming conditions, displacing local native      With water levels falling and temperature rising, diseases
species. While climate change may not directly drive lake        like botulism will increase, spreading more disease and
species extinct, the persistence of many native species          killing more birds that consume fish. Birds could also
will be threatened as they confront more invasive species,       suffer from phenological mismatch, as the insect species
species replacements, and proliferating pest and disease         they relied on for food hatch earlier with warmer springs or
organisms.                                                       decline as vegetation shifts northward.

Fish                                                             Shipping, Power Generation and Shorelines
Fish respond sensitively to water temperature, assembling        Fluctuating lake levels resulting from climate change
in distinct cold, cool, and warm water groupings. This means     greatly affect the ability of ships to safely navigate
that warmer temperatures, seasonal weather shifts, and           shallow portions of the Great Lakes’ channels and harbors.
storms that bring a quick influx of water will all affect fish   Both lower lake levels and higher water temperatures
species. The geographic ranges of fish, demographics within      pose technical challenges for power generation. Changing
species, system productivity, species-specific productivity,     lake levels affect marinas, docks, and shoreline homes and
the spatial arrangement of species, and their physiological      other buildings.
state and performance will all change in response.

3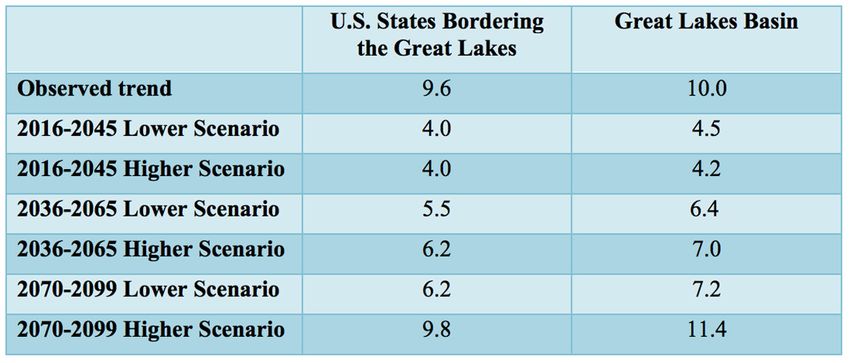
Recreation and Beach Closures
The Great Lakes Commission estimated that boating
contributed approximately $9 billion to the Great Lakes
economy in 2003. Boating activities such as skiing could be
affected by warming temperatures, shifts in the length of
seasons, and changes in lake levels.

It’s become common in recent years for beaches in Chicago
and Michigan to close or be under swim advisories because
of bacterial contamination. Beach closures are expected
to increase as heavy precipitation exacerbates issues
associated with runoff and pushes up bacterial counts as
well as algal blooms and E. coli alerts.

                                     Conclusion
                                     We should not and cannot take the vast natural resources of
                                     the Great Lakes for granted. Allowing the Great Lakes to be
                                     degraded through human activities, including climate change,
                                     is not an option. For economic, aesthetic, recreational, and
                                     ecological reasons, the Great Lakes should be restored to be
                                     healthy, unpolluted, and productive. We must reduce the effects
                                     of climate change on the Great Lakes.

                                     Public support for protecting the Great Lakes is strong across
                                     the region. Scientific analyses clearly show that climate
                                     change has already greatly affected the region and that these
                                     impacts will continue and expand as the pace of climate change
                                     accelerates. It is critical that we recognize the importance of
                                     one of the world’s most abundant freshwater resources and
                                     ensure its protection for generations to come.

                                                                                                       4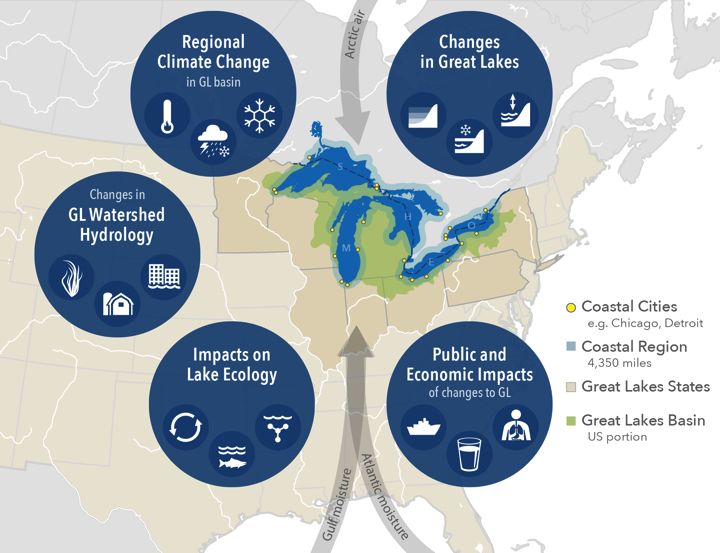
1. Introduction
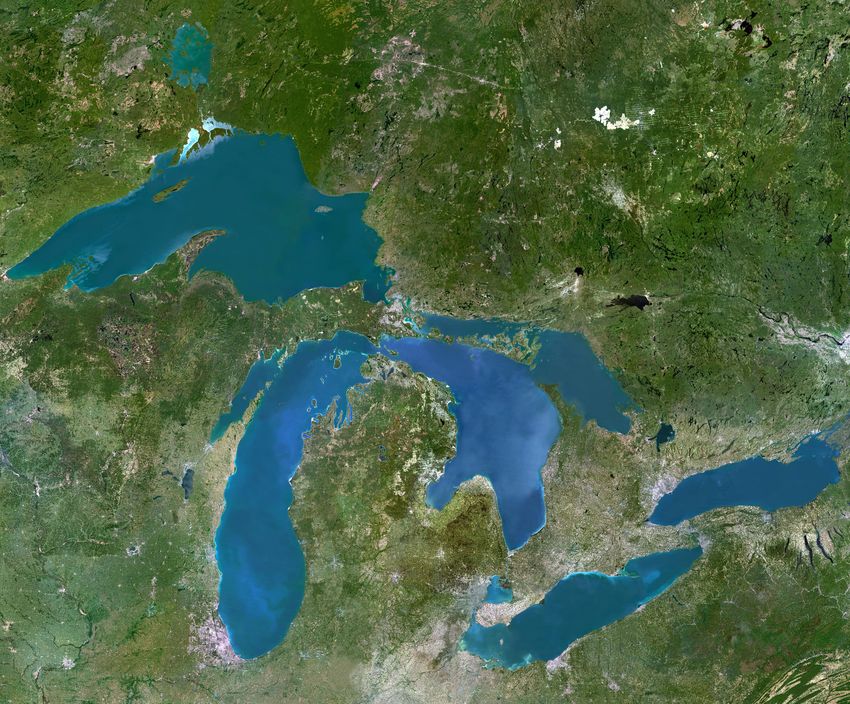
The North American Great Lakes are amongst the largest freshwater resources on our planet. The five Great Lakes
(Superior, Michigan, Erie, Huron, and Ontario) cover a total area of more than 94,000 square miles (243,000
square kilometers) with over 9,000 miles (14,500 kilometers) of shoreline. They hold 5,500 cubic miles (22,700 cubic
kilometers) of freshwater, which is enough water to cover the area of the continental United States with almost 10
feet (3 meters) of water. They also include 5,000 tributaries and have a drainage area of 288,000 square miles. The
watersheds comprising the Great Lakes Basin span major areas of the United States and Canada (see Figure 1).
Figure 1. A schematic diagram highlighting the
focus areas and themes of the assessment and
the major impact pathways.
The Great Lakes are extremely important both to humans and to wildlife – they are an abundant freshwater
resource for water supplies, industry, shipping, fishing, and recreation, as well as a rich and diverse ecosystem.
However, over the last two centuries, the Great Lakes and the broader basin have been significantly affected
by human activities, leading to habitat loss and fragmentation, invasive species, and an influx of biological and
chemical pollutants that present substantial environmental challenges (e.g., Riley, 2014). These impacts have
impaired water quality, threatened wildlife populations, and jeopardized the health and economic vitality of
the region. Now, climate change is adding new challenges and significant additional stress to conditions in and
surrounding the Great Lakes (Melillo et al., 2014; Sharma et al., 2018).
This report assesses the current and projected impacts of climate change on the Great Lakes. This assessment
aims to evaluate the effects of climate change on the Great Lakes, its shorelines, regional land use, biodiversity,
and urban cities on the lakes. The assessment does not aim to address all of the basins feeding the lakes or the
states around the lakes. This study provides an update on prior analyses of such impacts – including GLISA
(2016), McDermid et al. (2015), Walsh et al. (2014), Pryor et al. (2014), Wuebbles et al. (2010), Wuebbles and
Kling (2006), Wuebbles and Hayhoe (2004), Kling et al. (2003), and Lofgren et al. (2002). The Midwest chapter
from Volume II of the 4th National Climate Assessment (USGCRP, 2018) also includes some discussion of the
impacts of climate change on the Great Lakes; this assessment is intended to be a more thorough look at those
current and potential impacts.
5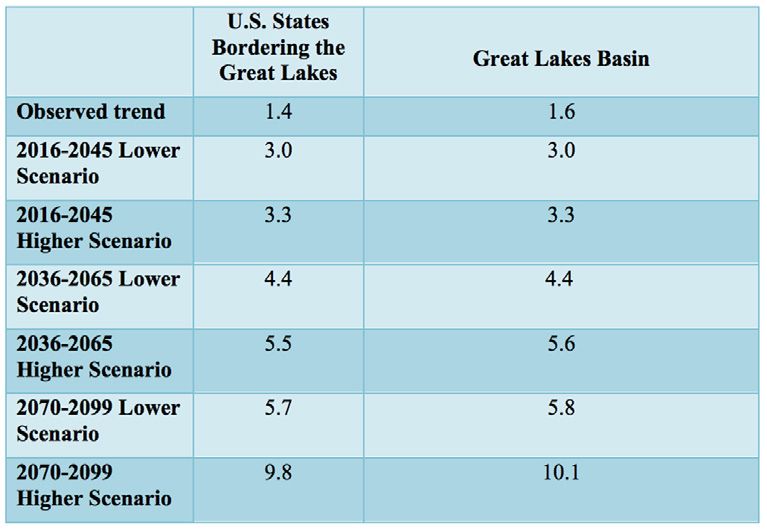
1.1 Importance of the Great Lakes
By total area, the Great Lakes is the largest group of freshwater lakes on Earth, and second largest by total volume,
containing 21% of the world’s surface fresh water by volume. They contain 95% of the surface water in the
United States and 84% of the surface fresh water available in North America (https://www.epa.gov/greatlakes/
great-lakes-facts-and-figures).

About 34 million people rely on the Great Lakes for drinking water, jobs, and their way of life (their choices for
recreation, etc.) — about 24 million people in the U.S. and about 9.8 million in Canada. That’s roughly 8 percent
of the U.S. population and 32 percent of Canada’s (University of Wisconsin Sea Grant Institute 2018). The
United States draws more than 40 million gallons (151 million liters) of water from the Great Lakes every day –
more than half used for electrical power production, with the rest used for drinking water, industrial production,
and agriculture.

The Great Lakes support one of the world’s largest regional economies, including a $7 billion fishing and $16
billion tourism industry. Accounting for agricultural production within the region, commercial and sport fishing,
industrial manufacturing, and tourism and recreation, the Great Lakes’ economic activity surpasses that of most
developed nations. A third of the basin’s land is used for agriculture. Tourists spend hundreds of millions of dollars
each year in the basin with more than 60 million people annually visiting the many parks that dot the shores. The
lakes and their waterways serve as shipping conduits to transport bulk cargo from the basin to the markets of the
world. Canals, rivers, straits, locks and channels connect the lakes together to form one of the busiest shipping
areas in the world. Over 150 million tons of cargo are transported over the Great Lakes each year, supporting
44,000 jobs (https://www.mlive.com/news/muskegon/index.ssf/2009/03/sat_transporting_goods_by_ship.
html). Since 1959, more than 2 billion metric tons of iron, coal, steel, oil, grains, and other products have been
shipped over the Great Lakes.

A large variety of fish and wildlife species is supported by the waters and lands of the Great Lakes Basin. More
than 170 species of fish inhabit the Great Lakes, their tributaries, and connecting waterways. These include lake
trout, lake sturgeon, lake whitefish, walleye, landlocked Atlantic salmon, and associated forage fish species. The
Great Lakes basin also provides critical breeding, feeding, and resting areas, as well as migration corridors, for
waterfowl, colonial nesting birds, neotropical migrants, and many other species of migratory birds. In general, the
region of the Great Lakes contains an immense network of streams, lakes, inland wetlands, coastal marshes, and
forests. These habitats support more than 3,500 species of plants and animals, including more than 200 globally
rare species and 46 species found nowhere else in the world. The Great Lakes Basin provides the diverse habitats
needed by more than 180 fish species to complete their life cycles. A critical stopover region for more than 350
migratory bird species, the basin provides resources to sustain hundreds of millions of birds along their migratory
routes each year. In addition to supporting fish and wildlife populations, the diverse habitats of the basin provide
numerous critical ecological services, including water filtration and storage, flood control, nutrient cycling, and
carbon storage. These diverse habitats are also important to the culture of the native people in the Great Lakes
region.

The Great Lakes also play an important role in influencing local weather patterns across the region. The Great
Lakes influence daily weather by 1) moderating temperatures in all seasons, producing cooler summers and warmer
winters; 2) increasing cloud cover and precipitation over and just downwind of the lakes during winter; and 3)
decreasing summertime convective clouds and rainfall over the lakes (Scott and Huff, 1996; Notaro et al., 2013).

                                                                                                                    6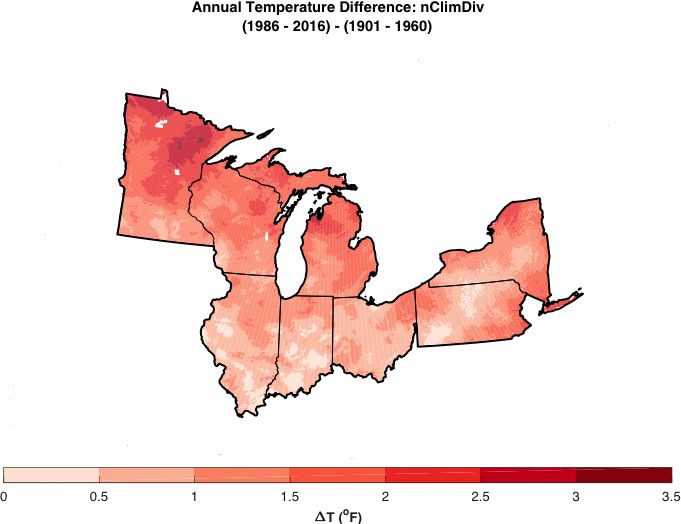
These effects range from moderate (e.g., mild cooling breezes that help lakeshore orchards and vineyards flourish)
to extreme (e.g., harsh lake effect snow and ice storms that close airports, shut down interstate freeways, and
knock out power grids). The Great Lakes therefore provide diverse benefits and challenges to the weather of the
surrounding urban and rural landscapes.

        1.2 Climate change: From global to the Great Lakes region
The global climate continues to change rapidly compared to the pace of natural variations that have occurred
throughout Earth’s history. Trends in globally averaged temperature, sea level rise, upper-ocean heat content,
land-based ice melt, Arctic sea ice, depth of seasonal permafrost thaw, and other climate variables provide
consistent evidence of a warming planet. These observed trends are robust and have been confirmed by multiple
independent research groups around the world (USGCRP, 2017; IPCC, 2013).

The global annual-average temperature has increased by 1.8°F (1.0°C) from 1901 through 2016 (as calculated
from instrumental records over both land and oceans) (USGCRP, 2017). Sixteen of the 17 warmest years in the
measurement record (which spans over 130 years) occurred in the period from 2001 to 2017. (The one exception
in the highest 17 warm years was 1998, a major El Niño year.). The global average temperature for 2016 was the
warmest on record, surpassing 2017 and 2015 by a small amount. The years 2017 and 2015 far surpassed the 4th
warmest year on record, 2014, by 0.29°F (0.16°C), four times greater than the difference between 2014 and the
next warmest year, 2010 (NCEI, 2016).

The frequency and intensity of extreme heat and heavy precipitation events are increasing throughout most of
the world, including the Great Lakes region. These trends are consistent with the expected response to a warming
climate and are likely to continue. Observed and projected trends for some other types of extreme events, such
as floods, droughts, and severe storms, have more variable regional characteristics. The shift to warmer winters,
greater winter precipitation, and more intense rainfall is likely to increase flooding in Great Lakes cities.

The 4th U.S. National Climate Assessment (USGCRP, 2017), building upon prior assessments of the science
(e.g., IPCC, 2013; Melillo et al., 2014) and extensive new evidence, concludes that it is extremely likely that
human activities, especially emissions of greenhouse gases and land use change, are the dominant cause of global
warming since at least the mid-20th century. For the last century, there are no convincing alternative explanations
for the observed warming supported by observational evidence. Natural variability cannot account for the amount
of global warming observed over the industrial era. Changes in solar output and internal variability can only
contribute marginally to the changes in climate observed over the last century, and there is no convincing evidence
for natural cycles that could explain the changes in climate over the last century. The warming over recent decades
cannot be attributed to the Sun; in fact, extremely accurate satellite observations show that solar output has
declined slightly over the last four decades (USGCRP, 2017).

Global climate is projected to continue to change over this century and beyond. The magnitude of climate change
beyond the next few decades will depend primarily on the amount of greenhouse (heat-trapping) gases emitted
globally and on the remaining uncertainty in the sensitivity of Earth’s climate to those emissions. With significant
reductions in the emissions of greenhouse gases, the global annually averaged temperature rise could be limited to
3.6°F (2°C) or less. Without major reductions in these emissions, the increase in annual average global temperatures
relative to preindustrial times could reach 9°F (5°C) or more by the end of this century (USGCRP, 2017).

7
Similarly, annual average temperature over the contiguous United States increased by 1.8°F (1.0°C) for the period
1901–2016 and is projected to continue to rise. As with the global changes, there have been marked increases
in temperature extremes across the United States. The number of high temperature records set in the past two
decades far exceeds the number of low temperature records. Heavy precipitation events in most parts of the
United States have also increased in both intensity and frequency since 1901. There are important regional
differences in these trends, with the largest increases occurring in the U.S. Northeast and Midwest.
1.3 Potential risks and vulnerabilities for the Great Lakes
Prior studies have shown that global climate change is already affecting both the climate of the Great Lakes
region and the physical behavior of the Great Lakes themselves (e.g., Melillo et al., 2014, and other reference
above). Regional weather extremes in temperature and precipitation are intensifying (Winkler et al., 2012). In
recent decades, a number of changes in the climate of the Great Lakes region have been documented, including a
significant warming trend (Schoof, 2013; Zobel et al., 2017a,b), an increase in extreme summertime precipitation
(Kunkel et al. 2003, 2012; Zobel et al., 2018), changing lake levels (Gronewold et al., 2013a), and changing trends
in lake-effect snows (Norton et al., 1993; Kunkel et al., 1999; Bard and Kristovich, 2012; Notaro et al., 2013; Clark
et al., 2016; Suriano and Leathers, 2017). The region has also recently witnessed unprecedented extreme changes
in the timing of precipitation and runoff, with important implications for flooding, soil erosion, nutrient export,
and agricultural practices (Carpenter et al., 2017; Kelly et al., 2017). Warm, wet winters are producing extensive
early-season flooding, which threatens people and infrastructure. Associated runoff and soil erosion are also a
concern for future agricultural productivity.
Further changes in climate projected over the coming decades are likely to add significantly to the vulnerabilities
and risks to the Great Lakes and the Great Lakes Region. There are many vulnerabilities and risks discussed in this
assessment, including potential changes in lake water levels and their effects on coastal erosion and wave damage,
effects on lake temperature and stratification, effects on water quality, effects on the ecology and wildlife in both
the lakes and the region, and effects on the public and the economy of the Great Lakes region. Figure 1 highlights
the basic topics and themes that are covered throughout the rest of this report.
1.4 Public perception of the Great Lakes: Value and vulnerability
A binational poll conducted by the International Joint Commission’s Water Quality Board in 2015 indicates
that the vast majority (85%) of the residents in the Great Lakes basin feel it is important to protect the Great
Lakes, largely for the provision of drinking water and the fact that they are a valuable resource with economic,
recreational, and environmental importance (IJC, 2016). Residents were less certain whether the health of the
Great Lakes is increasing, getting worse, or staying the same. The poll indicated that 56% believe the lakes are
getting worse or staying the same. When asked about problems facing the Great Lakes and the surrounding
tributaries, residents were most likely to identify pollution (roughly 50%), while a significant minority (31%) did
not know what the biggest threat might be. Although the majority of respondents (78%) felt they personally
played a role in protecting the Great Lakes through their own education and decision making, many (30%) were
unsure what specifically they could do. These high levels of concern and personal responsibility exist despite the
fact that only 42% of residents in the basin use the lakes for leisure or recreational purposes.
Residents responding to the poll did not directly identify climate change as a threat to the Great Lakes. However,
many of the top issues mentioned by residents are exacerbated by climate change, in particular the trends in the
8region for increasing temperature and precipitation moving into the future. For example, residents were concerned about pollution (including runoff) and invasive and endangered species, threats that become greater under the impacts of a changing climate. Agricultural runoff, a major threat to lakes, and in particular Lake Erie, occurs during spring storms and will worsen as the intensity of spring rainfall events increases (Michalak et al., 2013). Similarly, the movement and loss of species is often exacerbated by shifting habitat needs as the climate warms (Ryan et al., 2018). This binational poll was replicated in 2018 (IJC, 2018), affirming that public support for protecting the Great Lakes remains high (up by 3% points to a total of 88%). This report also indicated that 55% of residents are willing to pay more for consumer products as a result of regulations designed to restore and protect the Lakes. In a new question about the top ten issues facing the Great Lakes, 73% of residents ranked climate change as having an extremely negative impact, just behind other issues exacerbated by climate change (e.g., invasive species, algae blooms, and runoff). Residents in the Great Lakes were not keen to engage socially or politically in these issues (only ~30%), but the majority were willing to be more careful about what they dispose down the drain (83%) and with their water use (74%). An annual poll on climate change perception in the United States finds that 70% of Americans believe global warming is happening, and these beliefs are becoming increasingly certain over time (Leiserowitz et al., 2018; Howe et al., 2015). For the Great Lakes states and provinces, these numbers ranged from a low of 64% (in Indiana) to a high of 77% (in New York) (Marlon et al., 2018). In addition, approximately 60% of Americans were worried about global warming and believe that it is affecting weather in the United States (increasing extreme heat, droughts, flooding, and water shortages) (Leiserowitz et al., 2017). For the Great Lakes states, this sense of worry about climate change ranged from a low of 49% (in Indiana) to a high of 67% (in New York). At the county level, concern and belief increased more in urban areas than in rural areas (Marlon et al., 2018). In general, beliefs about climate change were largely driven by political orientation and ideology (Hornsey et al., 2016), explaining why we see this variation in the Great Lakes states where political ideology is more evenly divided among liberals, moderates, and conservatives relative to portions of the rest of the country (IJC, 2016). 2. Regional climate change in the Great Lakes The climate is changing over the Great Lakes and is projected to change much more over the coming century. This section summarizes the observed and projected changes in climate variables such as near-surface air temperature and precipitation over the Great Lakes and bordering U.S. states. The methodology used in these analyses is similar to that used in the 4th National Climate Assessment (USGCRP, 2017), and is based on the analyses of observational datasets for past changes and from modeling and downscaled datasets for projections produced for NCA4. Projections use a weighting system for global climate models, that are then statistically downscaled for temperature and precipitation at about 6 km resolution across the continental United States. The methodology is described in more detail in the Supplementary Material. The projected global average temperatures are expected to rise an additional 2.7°F to 7.2°F if greenhouse gas emissions from fossil fuels in energy and transportation systems continue to rise over the 21st century (see Figure 2). Future pathways range from assuming continued large dependence on fossil fuels as a high scenario, called Representative Concentration Pathway 8.5 W/m2 (RCP8.5), to a low scenario, RCP4.5, assuming rapid reductions in the use of fossil fuels after mid-century, to a very low RCP2.6 scenario, assuming major emissions- 9
reduction actions. As discussed below, the Great Lakes regional climate shows strong signals of weather extremes
that get even stronger in the future (refer to the Supplementary Material for details on the selection of historical
observational datasets and the ensemble of statistically downscaled future projections).

                                                 Figure 2. Multi-model simulated time series from 1900
                                                 to 2100 for the projected change in global annual mean
                                                 surface temperature relative to 1901–1960 for a range of
                                                 the Representative Concentration Pathways (RCPs). These
                                                 scenarios account for the uncertainty in future emissions
                                                 from human activities (as analyzed with the 20+ models
                                                 from around the world used in the most recent international
                                                 assessment [IPCC, 2013]). Source: USGCRP (2017)

       2.1 Air temperature changes and trends
Of the many indicators of climate, temperature is one of the most important, because it affects our lifestyles
and our decision-making. For example, temperature data are used by builders and insurers for planning and
risk management and by energy companies and regulators to predict demand and to set utility rates. As the
most widely and consistently observed climate variable, air temperature is very convenient for users. Long-term
temperature trends are also an important indicator of the changes occurring in climate.

                                                              In the Great Lakes region, the U.S. states bordering
                                                              the Great Lakes have seen an overall increase in
                                                              annually averaged temperature of 1.4°F for the
                                                              period 1985-2016 relative to 1901-1960, with the
                                                              largest changes at the higher latitudes (see Figure 3
                                                              and Table 1). For the extent of the Great Lakes Basin
                                                              (see Figure 1), the temperature change is 1.6°F over
                                                              this time period. These trends are higher than the
                                                              overall change of 1.2°F over the contiguous United
                                                              States (and found globally) for the trends over these
                                                              time periods (USGCRP, 2018).
                                                                  Figure 3. Observed changes in annually-averaged
                                                                  temperature (°F) for the U.S. states bordering the
                                                                  Great Lakes for present-day (1986–2016) relative to
                                                                  1901–1960. Derived from the NOAA nClimDiv dataset
                                                                  (Vose et al. 2014). Source: NOAA/NCEI.

                                                                                                                        10
Table 1. Change in annually-averaged temperature (°F) for U.S.
states bordering the Great Lakes and for the smaller area of
the Great Lakes basin. The observed trend is the difference for
annually-averaged temperature for 1986-2016 period relative
to 1901-1960. The future projections for annually-averaged
temperature due to emissions from the higher (RCP8.5) and
lower (RCP4.5) scenarios are shown for the periods 2030 (2016-
2045), 2050 (2036-2065), and 2085 (2070-2099) time periods.
Table 2. Change in annual precipitation (as equivalent
rainfall) (%) for U.S. states bordering the Great Lakes
and for the smaller area of the Great Lakes basin.
The observed trend is the difference for annual
precipitation for 1986-2016 period relative to 1901-1960.
The future projections for annual precipitation due to
emissions from the higher (RCP8.5) and lower (RCP4.5)
scenarios are shown for the periods 2030 (2016-2045),
2050 (2036-2065), and 2085 (2070-2099) time periods.
Table 3. Change in annual snowfall (%) for U.S. states
bordering the Great Lakes and for the smaller area of the
Great Lakes basin. The observed trend is the difference for
annual snowfall for 1986-2013 period relative to 1954-1983. The
future projections for annual snowfall are calculated based
on the ensemble mean of 10 statistically-downscaled GCMs
by Hybrid Delta for the higher (RCP8.5) and lower (RCP4.5)
scenarios (Byun and Hamlet, 2018) associated with three
30-yr periods centered on 2020s, 2050s, and 2080s. Also, the
values for the future periods represent the projected changes
relative to observed mean for 1976-2005.
Table 4. Land use and land cover for the Great Lakes basin, based on data for
year 2011. Change from 2001 to 2011 is also shown. Data derived from U.S.
National Land Cover Database (NLCD) for the U.S. side, and the Ontario Land
Cover Compilation V2.0 for the Canadian side of the basin. (Data from SOLEC,
in review).
11The projected changes in annual average temperature for the U.S. states bordering the Great Lakes are shown in
Figure 4 for the higher (RCP8.5) and lower (RCP4.5) emissions scenarios for the 2085 (2070-2099) time period
relative to 1976-2005. The patterns of warming over these states for the 2030 (2016-2045) and 2050 (2036-2065)
time periods are similar but with smaller temperature changes. Averaged over the entire Great Lakes region, slightly
greater increases are projected in summer than winter, and average maximums are expected to rise slightly faster
than average minimums. These seasonal variations are reversed in the northern Great Lakes region, with winter
temperature rising more than summer and average minimums warming more than average maximums (WICCI,
2011; IPCC, 2013; USGCRP, 2017). Table 1 shows that projected changes in temperature for these scenarios are
3.3, 5.5, and 9.8°F (1.8, 3.1, and 5.4°C) for the 2030, 2050, and 2085 time periods for the higher scenario, and
3.0, 4.4, and 5.7°F (1.7, 2.4, and 3.2°C) for the
2030, 2050, and 2085 time periods for the lower
scenario. The projected changes in temperature
for the Great Lakes Basin are similar but
slightly higher for the same time periods and
scenarios (see Table 1). Not surprisingly, there
is little difference in the projected effects on
temperature over the next few decades between
the different scenarios, but large differences
between the scenarios by the end of the century.
Similar projections along with monthly changes
were found by Zhang et al. (2018). The potential
societal and ecological impacts on our planet,
including those associated with the Great Lakes,
are likely to increase in proportion to annual
average temperature (Stern et al., 2006; Melillo
et al., 2014).
Figure 4. Projected change in annually-
averaged temperature (°F) for U.S.
states bordering the Great Lakes from
the (a) higher (RCP8.5) and (b) lower
(RCP4.5) scenarios for the 2085 (2070-
2099) time period relative to 1976-2005.
Source: NOAA/NCEI
122.2 Precipitation trends
Annual precipitation averaged across the United States has increased by approximately 4% from 1901 to 2015
(USGCRP, 2017). Figure A1 shows that there is a generally positive trend for U.S. states bordering the Great
Lakes in annual precipitation for present-day (1986–2016) relative to 1901–1960, but with strong local variations
in the trend across the states. There is a 9.6% increase in annual precipitation averaged over these states (Table
2), while the Great Lakes Basin shows a comparable 10.0% increase. The largest increasing trends are for fall-
season (~15.8% for the bordering states), with summer (9.9%) precipitation also being larger relative to winter
precipitation (7.7%) and spring precipitation (7.0%).
The patterns of projected future annual precipitation changes over the U.S. states bordering the Great Lakes
states and for the Great Lakes Basin for the earlier periods are similar but with smaller changes (Figure A2; Table
2). The greatest differences arise in how precipitation change is distributed across seasons, with future increases
concentrated in winter and spring months for both emission scenarios, while summer precipitation decreases by
5% to 15% for most of the Great Lake states by the end of the century (Byun and Hamlet, 2018). The likely
reason for this trend is that increasing warming with time will allow the atmosphere to hold more moisture and
thus generate higher precipitation. As in temperatures, there is little difference in the effects between scenarios
over the next few decades, but larger differences between the scenarios by the end of the century. The likely reason
for this trend is that increasing warming with time will allow the atmosphere to hold more moisture and thus
generate higher precipitation.
2.3 Extreme events
Along with the overall changes in climate, there is strong evidence of an increasing trend in the intensity in
some types of extreme weather events over recent decades. Changes in the characteristics of extreme weather
events are particularly important for human safety, infrastructure, agriculture, water quality and quantity, and
natural ecosystems. For example, heatwaves have become more frequent in the United States since the 1960s,
while extreme cold temperatures and cold waves have become less frequent (USGCRP, 2017). These extreme
temperature conditions provide a direct risk to the public of the Great Lakes region (Patz et al., 2014). For
example, the 2012 Midwestern heat wave and drought caused more than $30B in economic damage, and 123
direct deaths. It contributed to considerable long-term health impacts across most of the central and western
United States (Rippey, 2015). The chances for record-breaking high temperature extremes have increased and
will continue to increase as the global climate warms. Recent record-setting hot years are projected to become
common in the near future for the United States, as annual average temperatures continue to rise.
Heavy rainfall is increasing in intensity and frequency across the United States and globally and is expected to
continue to increase (Karl and Knight, 1998; O’Gorman and Schneider, 2009). The largest observed changes in
extreme precipitation in the United States have occurred in the Midwest and Northeast. Changes in climate are
increasing the likelihood for these types of severe events. Past and projected trends remain uncertain for some
types of severe storm events, including the intensity and frequency of tornadoes, hail, and damaging thunderstorm
winds. Tornado activity in the United States has become more variable, particularly during the 2000s, with a
decrease in the number of days per year with tornadoes and an increase in the number of tornadoes on days when
they do occur (USGCRP, 2017).
The number of future extremely warm days (with temperature greater than 90°F) is projected to increase for the
states bordering the Great Lakes, especially in the southern parts of the region, but less so near the Lakes (Figure
13A3). By the end of the century there is a projected increase of 60 extremely warm days in the Great Lakes states
for the higher scenario and 30 days for the lower scenario. Areas within the Great Lakes Basin show similar trends,
with an increase of 40 extremely warm days projected for the higher scenario and 17 for the lower scenario, based
on an average over the basin. For midcentury, 2050s, the number of days greater than 90°F for the U.S. states
bordering the Great Lakes is projected to increase by 30 days for the higher scenario and 21 for the lower (17 for
the Great Lakes basin with the higher scenario and 11 for the lower). For 2085, hot days with >100°F are projected
to increase by 17 days for the higher scenario and 5 for the lower scenario (8 for the Great Lakes basin with the
higher scenario and 2 for the lower, relative to none in the recent 30-year period).
The number of extremely cold days (with minimum temperature less than 32°F) is projected to decrease dramatically
over the century because of wintertime warming in the states bordering the Great Lakes (Figure A4). The largest
decrease in freezing days is projected for the most northern states and for the Great Lakes Basin, consistent with
regional variations in winter temperature trends. There is a projected decrease of 33 days for the higher scenario
and 21 for the lower scenario (42 for the Great Lakes Basin with the higher scenario and 27 for the lower scenario).
For midcentury, 2050, the number of days less than 32°F for the U.S. states bordering the Great Lakes is projected
to decrease by 20 days for the higher scenario and 17 for the lower (25 for the Great Lakes Basin with the higher
scenario and 21 for the lower). By the 2030s, the Great Lakes Basin is projected to see 15-16 fewer freezing days
per year. Similarly, the frost-free season (and the corresponding growing season) should also lengthen throughout
the century for these scenarios.
The number of days projected to have high temperatures under 32°F (these are days that do not get above freezing,
so different than the previous paragraph) are also projected to decrease, by as many as 56 days in the Great Lakes
Basin by the end of the century for the higher scenario and 31 days for the lower scenario.
The amount of precipitation coming in extreme events has already increased over the last five decades in the
Great Lakes region (USGCRP, 2017), and is projected to increase further over the coming decades. The amount
of precipitation occurring in storms with a 5-year return period is projected to increase by 18.7% by 2085 for
the higher scenario and 10.8% for the lower scenario (20.8% and 11.3%, respectively, for the Great Lakes Basin)
(Figure A5). The amount of precipitation in such extreme storms is projected to increase by 7-8% by the 2030s
and by 9-12% by the 2050s. The precipitation from what are currently considered to be 1 in 50 and 1 in 100-year
storms are projected to increase similarly, meaning that very large amounts of precipitation are expected from
these once-unusual events.
2.4 Cold-season processes (snow and ice)
With a changing climate, both rain and snow precipitation patterns are expected to change over the Great Lakes,
complicating projections of snow processes. While the increase in precipitation may lead to more snow fall in
individual events, the winter warming trend across the United States will lead to a reduction in the number of
snow events compared to rain events. Further, warming can lead to shifts in seasonal distributions of snow cover in
the Great Lakes. As a result, rising temperatures in the Great Lakes states have had little effect on historical total
annual snowfall across the region (Figure A6 and Table 3), but their effect on reducing seasonal duration of snow
cover is more pronounced (Brown and Mote, 2009; Notaro et al., 2014). Some areas affected by lake effect snows
have actually experienced significant increases in seasonal snowfall in recent decades (e.g., Burnett et al., 2003).
Despite small overall trends in snow fall during the historical record, by the end of the century, annual total snowfall
14over Great Lakes states is projected to decrease by 50% for the higher scenario and 30% for the lower scenario
(Figure A7 and Table A1). This results in substantial reductions in snow cover, with days of snow depth greater
than 5.9 inches (15 cm) reduced from the historical average of 61 days for the entire region to 19 days for the
higher scenario or 35 days for the lower scenario by the end of the century (Chin et al, 2018; results are consistent
with findings of Notaro et al., 2014). The projected snowfall reductions are not uniform in the Great Lakes
states. The snowfall amounts are projected to decrease slightly less within the Great Lakes Basin in comparison
to the total Great Lakes states, possibly due to lake-effect snow in the basin. Lake-effect snow is largely limited to
Michigan (the upper peninsula and western parts of the lower peninsula), upper Indiana, northern Ohio, parts of
Ontario to the east of Lakes Superior and Huron, and parts of New York and Pennsylvania to the east of Lakes
Erie and Ontario. More southerly states in the basin will have more reduction in snow than more northerly states
because of the (climatological) greater frequency of days when mean daily temperature goes above 32°F. Similarly,
far northern latitudes may experience less reduction in snow cover due to the (climatological) greater frequency of
days when the mean temperature stays below 32F.
Projections suggest that more precipitation will fall as rain and less as snow during the cold season, particularly
in southern Great Lakes states under the high emission scenario. Changing climate is expected to shift the
hydrological cycle in several ways simultaneously: increasing temperatures, decreasing snowfall, and increasing
spring rainfall. This would lead to early spring snowmelt and increasing flood risks in many watersheds (Byun et
al., 2018; Cherkauer and Sinha, 2010). During periods of colder temperatures, lower snow accumulations could
also cause greater freezing of soils, at least in the near term, further exacerbating winter and spring flood risk,
especially following rain on snow events (Sinha and Cherkauer, 2010).
LAKE EFFECT SNOWS
Some of the heaviest snowfalls on record in the United States were generated by the Great Lakes. For
example, three- to four-foot snowstorms are routine in the Lake Ontario snow belt, including the upper
western areas of New York in the fall and winter. On January 8, 2011, a snowband spanning virtually the
entire north-south length of Lake Michigan curled into South Bend, Indiana, hammering the city with some
of the highest snowfall rates ever seen outside of the Lake Ontario snow belt (https://weather.com/storms/
winter/news/great-lakes-snowbelts-lake-effect-snow-records). Lake Erie has also had large effects from
northeast Ohio to western New York. Prior to the U.S. Thanksgiving in 2014, a multi-day event covering the
Buffalo area with up to 88 inches of lake-effect snow, bringing city activity to a grinding halt.
The ingredients for lake effect snow are straightforward and come together a number of times each fall and
winter. Cold air from Canada pours over the still unfrozen, relatively warm Great Lakes. The lake moisture and
instability from this temperature contrast build one or more bands of snow, which are then deposited over
locations downwind from the lakes. Climate change, including warmer lake temperatures, could enhance
these effects when the conditions are appropriate for snowfall. The observed trend of precipitation tending
to occur in larger events throughout the Great Lakes basin could also mean larger lake effect snowfalls when
the conditions are ripe.
153. Changes in the Great Lakes
Climate is a coupled surface-atmosphere process. This means that climate change alters the exchange of heat
between the atmosphere and the Great Lakes. This changes the overall temperature and ice cover of the lakes,
and also changes the timing of overturnings (seasonal mixing of lake water) associated with seasonal thermal
changes. Although projections of climate change show increases in both precipitation and evapotranspiration
in the Great Lakes Basin, observations to date have not shown significant long-term trends. The state of science
on the projection of the net effect on lake level has undergone a major change of course in the last several years,
changing from projections of large drops in lake level under older methodologies to smaller drops on average and
the possibility of a small rise in lake levels through the end of this century.
3.1 Changes in lake temperature and stratification
Climate change in the Great Lakes involves both direct input of heat to the Lakes by increased downward
longwave emissions by greenhouse gases, and inhibited loss of heat to the air by turbulent heat fluxes associated
with the effects of the lakes. This should be expected to increase water temperatures within the lakes, but will also
have particular influences on the temperature profile within the lakes and the phenology (timing) of the lakes’
temperature structure (i.e., timing of particular events that occur during the seasonal cycle). Figure 5b shows the
change in summer temperatures in the Great Lakes from 1994 to 2013 (USGCRP, 2018) – all of the Great Lakes
show a significant increase over the 20 year period, especially Lake Superior.
Figure 5. The duration of seasonal ice cover decreased in most areas of the Great
Lakes between 1973 and 2013, while summer surface water temperature (SWT)
increased in most areas between 1994 and 2013. (a) The map shows the rate of change
in ice cover duration. The greatest rate of decrease in seasonal ice cover duration
is seen near shorelines, with smaller rates occurring in the deeper central parts of
Lakes Michigan and Ontario, which rarely have ice cover. (b) The map shows the rate
of change in summer SWT. The greatest rates of increase in summer SWT occurred
in deeper water, with smaller increases occurring near shorelines. Source: USGCRP
2018); adapted from Mason et al. (2016) by Kaye Lafond of NOAA GLERL.
16You can also read