An early glimpse at the 2021 marketing year - Iowa State ...
←
→
Page content transcription
If your browser does not render page correctly, please read the page content below
A Business Newsletter for Agriculture
Vol. 25, No. 5                         www.extension.iastate.edu/agdm                                     March 2021

               An early glimpse at the 2021 marketing year
                  By Chad Hart, extension economist, 515-294-9911, chart@iastate.edu

At the Ag Outlook Forum                 derecho reduced yield potential
each year, USDA provides its            enough to bring corn production
projections for the agricultural        below 14.2 billion bushels. Thus,
                                                                                Handbook updates
year ahead. The 2021 Forum              the 2020 corn crop was larger
                                                                                For subscribers of the
reflected the ongoing challenges        than the 2019 crop, but by a much
                                                                                handbook, the following
with COVID as all of the sessions       smaller amount than originally
                                                                                updates are included.
were virtual and much of the            projected. The COVID impact
discussion hinged on agriculture’s      to crops mainly came through            Historical Corn Yields by County
rebound from the physical and           biofuels, as biofuel consumption        – A1-12 (6 pages)
economic impacts from the               was reduced via the stay-at-home        Historical Soybean Yields by
pandemic. In general, the view          orders to reduce the spread of          County – A1-13 (6 pages)
for agriculture in 2021 is positive.    the virus. Given the timing of          Corn and Soybean County Yields
Most agricultural markets,              the pandemic, the biofuel usage         – A1-14 (4 pages)
including the major ones for            decline appeared in the spring          2021 Iowa Farm Custom Rate
Iowa, have recovered nicely from        and summer of 2020, showing up          Survey – A3-10 (5 pages)
the depths of the price declines        in the corn grind for ethanol for       Please add these files to your
that struck the markets in 2020.        the 2019 crop. Total corn usage         handbook and remove the out-
And the outlook builds upon the         for the 2019 crop was lower than        of-date material.
improvement in the latter half of       previous years because of that
2020, providing projections of          drop, along with a fall in exports.                          continued on page 6
better agricultural returns in 2021.    However, this past fall, ethanol
                                        production partially recovered
2020 was a challenging year,
with COVID, a drought, and a
                                        and export sales have surged to a
                                        record pace. For the 2020 crop,
                                                                               Inside . . .
derecho impacting the crop sector.      USDA has outlined a significant        A trip through the science of a
For corn, the 2020 crop started         increase in corn usage, with           warming planet.................... Page 3
out with huge potential, as early       exports leading the way. The           Ag Decision Maker unveils new
projections had the crop as the         growth in usage reduces projected      look for 25th anniversary..... Page 4
first 15 billion bushel crop on         ending stocks and the corn market
the strength of increased corn                                                 Ground beef demand remains
                                        has seen a sizable improvement         strong................................... Page 6
plantings. But the drought and
                                                         continued on page 2

                                                                                Ag Decision Maker is compiled by
                                                                                         extension ag economists
                                                                                Ann Johanns, aholste@iastate.edu
                                                                                     extension program specialist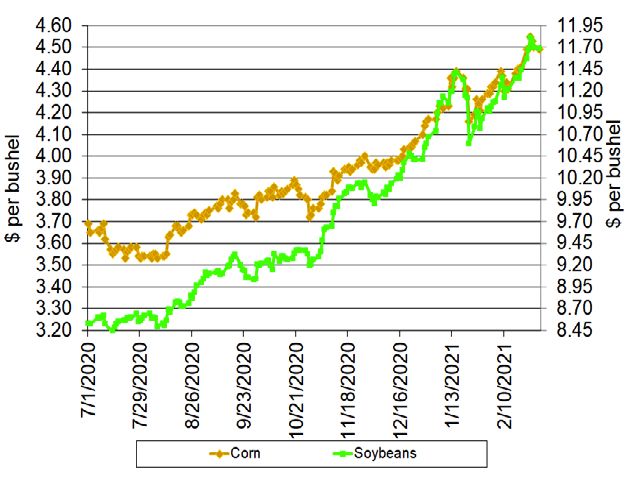
2                                         March 2021

An early glimpse at the 2021 marketing year, continued from page 1

in prices, with the 2020 season-average
                                                Table 1. US corn supply and use (Source: USDA)
price estimate holding at $4.30 per
                                                Marketing Year (2020 = 9/1/20 to 8/31/21)    2019       2020      2021
bushel, nearly 75 cents above the 2019
estimate. For 2021, USDA outlines a             Area Planted            (million acres)       89.7       90.8       92
major acreage battle among the major            Yield                   (bushels/acre)       167.5        172    179.5
row crops, but projects a 1.2 million           Production              (million bushels)   13,620     14,182   15,150
acre increase in corn plantings. That,          Beginning Stocks        (million bushels)    2,221      1,919    1,502
combined with a trend yield of 179.5
                                                Imports                 (million bushels)      42          25       25
bushels per acre, leads to a projection
of corn production above 15 billion             Total Supply            (million bushels)   15,883     16,127   16,677
bushels once again. However, the                Feed & Residual         (million bushels)    5,903      5,650    5,850
growth in expected production is fairly         Ethanol                 (million bushels)    4,852      4,950    5,200
well matched by continued growth in             Food, Seed, & Other     (million bushels)    1,430      1,425    1,425
usage, as USDA sees higher feed and
                                                Exports                 (million bushels)    1,778      2,600    2,650
residual usage, a larger ethanol grind,
and another record for exports. With            Total Use               (million bushels)   13,963     14,625   15,125
a small increase in projected ending            Ending Stocks           (million bushels)    1,919      1,502    1,552
stocks, the 2021 season-average price           Season-Average Price    ($/bushels)           3.56       4.30     4.20
estimate remains nearly steady, at
$4.20 per bushel.
                                                Table 2. US soybean supply and use (Source: USDA)
Many of the storylines for corn are in         Marketing Year (2020 = 9/1/20 to 8/31/21)     2019     2020     2021
play for soybeans as well. However,            Area Planted           (million acres)        76.1     83.1       90
the trade effects are more amplified           Yield                  (bushels/acre)         47.4     50.2     50.8
for beans, given the market’s relative
                                               Production             (million bushels)     3,552    4,135    4,525
dependence on exports. The 2020
soybean crop statistics reflect a general,     Beginning Stocks       (million bushels)       909      525      120
but partial, recovery for the crop from        Imports                (million bushels)        15        35      35
prevented planting problems and trade          Total Supply           (million bushels)     4,476    4,695    4,680
disruptions that hit the 2019 crop.            Crush                  (million bushels)     2,165    2,200    2,210
Acreage and production increased, but
                                               Seed & Residual        (million bushels)       105      125      124
the drought and derecho limited the
growth in supplies. Export sales this          Exports                (million bushels)     1,682    2,250    2,200
past fall provided a significant boost         Total Use              (million bushels)     3,952    4,575    4,534
to the soybean market. The growth              Ending Stocks          (million bushels)       525      120      145
in exports is expected to reduce 2020          Season-Average Price ($/bushels)              8.57    11.15    11.25
ending stocks to 120 million bushels
and raised the 2020 season-average                           Thus, USDA’s projections reveal that the healthy
price estimate to $11.15 per bushel. For 2021,               market recovery that already occurred for Iowa crop
soybean area is projected to leap again as soybeans          agriculture will continue. Even with projections of
are expected to see the largest gains in acreage, to 90      record supplies for corn and soybeans, crop prices are
million acres. Given trend yields, the combination           expected to roughly hold steady. The price strength
pushes expected production to over 4.5 billion               is supported by strong international demand and
bushels. But as with corn, soybean usage is expected         steady domestic use. The surge in export sales in
to match production. Domestic crush for livestock            2020 has continued as the calendar turned to 2021
feed and biofuel usage is projected to rise once             and USDA indicates it will continue. While COVID
again. And even though the export segment declines           did reduce activity in many parts of the US and global
slightly, soybean exports still hold at 2.2 billion          economies, it did not hamper agricultural trade and
bushels. The 2021 season-average price estimate for          US agriculture is enjoying the benefits of that.
soybeans improves to $11.25 per bushel.

                                                                                                     continued on page 3
3                                            March 2021

An early glimpse at the 2021 marketing year, continued from page 2

The futures markets for corn and               Figure 1. 2021/22 projected season-average prices
soybeans have remained bullish on the          (derived from futures)
outlook for the 2021 crops. Even after
the release of the latest USDA
projections, the markets have
maintained prices above the USDA
projections. USDA’s 2021 price
projections are $4.20 for corn and
$11.25 for soybeans. Futures at the
end of February projected season-
average prices for the 2021 crops of
$4.50 for corn and $11.70 for
soybeans.

For more market outlook through the
month, the latest outlook presentation
is always available on the Ag Decision
Maker Outlook page, www.extension.
iastate.edu/agdm/outlook.html.

                A trip through the science of a warming planet
                     By Don Hofstrand, retired extension value added agriculture specialist
                     Reviewed by Dr. Eugene Takle, retired professor emeritus Iowa State University

This article is the first in a series focused on the            Examples include the
causes and consequences of a warming planet                     National Aeronautics and
Is the earth getting warmer? If it is, what is causing          Space Administration
it to warm? Moreover, if it is getting warmer, what             (NASA), the National
impact will it have on the earth’s climate? Most                Oceanic and Atmospheric
important, how will a changing climate impact us?               Administration (NOAA),
                                                                the Intergovernmental Panel
Many people believe that the planet is getting warmer           on Climate Change (IPCC)
and the warming is caused by human activity.                    among others.
Moreover, they believe that the warming is causing
the earth’s climate to change in ways that are a threat         The series is also an attempt to help you understand
to us and future generations. Some prefer to believe            these concepts by using common, everyday examples.
that the planet is not warming. Others believe the              Although the earth and its climate are complex, many
world is warming but don’t believe it is caused by              of the forces that drive the world’s climate are familiar
human activity. Many people are somewhere in the                to us because they are the same ones we experience in
middle and aren’t sure what to believe.                         our everyday lives.

Join me for a trip through the current scientific               Before we start, we should clarify the commonly
evidence of a warming planet and the resulting                  used terms of global warming and climate change.
changes in the planet’s climate. This series is an              Although these terms are often used interchangeably,
attempt to clarify these issues based on science                they have different meanings. Global warming is
from leading institutions around the world.                     the increase in the average temperature of Earth's
                                                                near-surface air and oceans. As the Earth warms,
                                                                                                      continued on page 4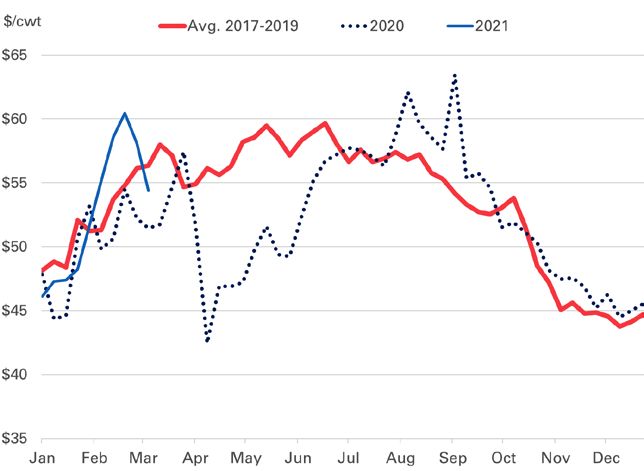
4                                          March 2021

A trip through the science of a warming planet, continued from page 4

it causes changes in the earth’s climate. Changes                Research concepts that are often misunderstood
in the earth’s climate include rising sea levels,                and used incorrectly are correlation and causation.
changing precipitation patterns, increasing severity             Correlation is a relationship between two variables.
and occurrence of extreme weather events such as                 For example, you may have put fertilizer on your
droughts and floods, and many others.                            garden during a rainy period and your garden plants
                                                                 grew larger. So you may conclude that there is a
Understanding the world of research                              correlation between the fertilizer application and the
Scientific research increases our understanding of               growth of the garden plants.
the Earth and the environment in which we live. It
requires careful investigation and analysis.                     With causation, a change in one variable causes
                                                                 a change in another variable. Although there is a
One research study does not make something a fact.               correlation between fertilizer and plant growth, there
The results of an individual research study often just           is no proof that the application of the fertilizer was
raise questions for further investigation. To establish          what caused the plants to grow bigger. Your garden
something as a fact requires a “body of research.”               may already have sufficient fertilization but was in
Not until several studies, focused on a question from            need of water. So, although the garden plants grew
various perspectives, come to the same conclusion,               larger when the fertilizer was applied, the fertilizer
do scientists conclude with reasonable confidence                did not cause the larger plant growth. It was the
that something is a fact.                                        rainfall that caused the plants to grow larger.
In this series, we will focus on “peer-reviewed”                 It is common for people to assume causation just
research. These are scientific research studies                  because correlation exits. This mistake usually leads
where other scientists (peers of the researcher) are             to faulty analysis.
anonymously called upon to review the research to
see if it was done properly. This review doesn’t mean
that the research should show a predetermined result.
Rather, it means that the research followed proper
“scientific methods and procedures.” If the reviewers
find errors in how the research was conducted, the
research study may be rejected and the reputation
of the scientists who did the research may be
questioned.

If the research is accepted by the reviewers and
published in a research journal, other researchers
will see if they can come up with the same results
using different techniques or data sets. If the results
cannot be replicated, the reputation of the researcher,
along with that of the peer reviewers and the research
journal, may be called into question.

Climate deniers often claim that climate researchers
skew their research results to come up with findings
that will promote themselves and increase their
chances of obtaining funding for further research.
But the process outlined above will cause researchers
to be conservative in their findings because they do
not want to suffer the consequences of being proven
wrong.
5                                         March 2021

               Ag Decision Maker unveils new look for 25th
               anniversary
                  By Ann Johanns, extension program specialist, 515-337-2766, aholste@iastate.edu

If you haven't noticed yet, we have a new and                The website improvements wouldn't have been
improved look to our website! The Ag Decision                possible without the help of Liisa Jarvinen, who has
Maker, published by Iowa State University Extension          been involved in numerous website projects at Iowa
and Outreach, unveiled a new design Jan. 16.                 State.

The new site offers the same timely information              Another addition are recorded presentations on Ag
Iowans and farmers across the Midwest have                   Market Outlook with Chad Hart, with changes or
depended on for years, but in a more mobile-friendly         reports impacting the markets. These videos and
format.                                                      more can be found on the Ag Market Outlook page,
                                                             www.extension.iastate.edu/agdm/outlook.html
The site includes a wide range of resources for both
crop and livestock producers, including whole                Since its launch, Ag Decision
farm resources, business development resources,              Maker has supported
information for cooperatives and the energy markets.         the efforts of the Farm
                                                             Management Team, and we
This has been a multi-year project to make the               look forward to continuing
materials more accessible and mobile friendly. We            that virtual presence along
cleared out some dated materials that weren’t relevant       with going back to more in-
anymore, with mobile friendly being our real goal.           person events.
The site continues to be
updated monthly with some
updates that occur more
often, including market prices
and farm business data.

The goal of Ag Decision
Maker is to keep producers
and the industry informed,
so they can make timely
decisions for their operation.

Links to videos and current
webinars, www.extension.
iastate.edu/agdm/info/
meetings.html are also
available, including farm
bill information, farmland
leasing information, the Farm
Financial Planning Program,
www.extension.iastate.edu/
farmanalysis/, at Iowa State
and much more.

                                                                                                continued on page 6
6 March 2021
Ground beef demand remains strong
By Lee Schulz, extension livestock economist, 515-294-3356, lschulz@iastate.edu
In 2020, the ingredients for a home- Figure 1. Cost of cheeseburger ingredients, 1991-2020
prepared, quarter-pound cheeseburger
totaled $1.84 per burger (Figure 1).
This is based on US Department of
Agriculture, Economic Research Service
calculations using data from the US
Bureau of Labor Statistics. Ground beef
made up the largest cost at $1.03 and
cheddar cheese accounted for $0.34.
The lettuce, tomato and bun were
$0.06, $0.23, and $0.18, respectively. In
real terms, i.e., 2020 dollars, this same
cheeseburger would have cost $1.76 to
prepare in 2019. Higher ground beef
prices accounted for all of the increase
between 2019 and 2020. Ground beef
prices rose 8%, translating into a $0.08
per burger hike.
The only time the cost of an at-home
cheeseburger was higher was in 2015. Notes: Costs based on annual average prices. Prices adjusted for inflation to
Then a cheeseburger cost $1.86 with 2020 dollars.
ground beef at $1.04 and the other Source: USDA, Economic Research Service using US Bureau of Labor
Statistics price data.
ingredients similar to recent values.
Last year’s 27.153 billion pounds of With ground beef so popular, why not grind the
US commercial beef production was a sizable 15% entire carcass? The math does not work. Many
increase compared to 2015. But insatiable retail muscle cuts command prices way above beef
demand held ground beef prices near 2015’s level. trimmings in both domestic and export markets.
Trimmings account for about 16% of the carcass for
Ground beef consumption was estimated at just over
finished steers and heifers. For cull cows and bulls it’s
27 pounds per capita in 2020. That’s more than 46%
much higher. Processors are always looking for ways
of total US retail beef consumption.
to optimize the value of the carcass and will grind
Ground beef comes from beef trimmings – portions muscle cuts when economically advantageous.
of the carcass that are “trimmed away” when the
carcass is broken down into meat cuts such as
Current lean beef supplies are adequate
Lean beef is a result of regular culling of both beef
steaks, roasts and various other items. Ground beef
and dairy breeding animals. Culling decisions in part
typically comes from a combination of two different
reflect the productive life cycle of animals and are
products – 50% lean trimmings from finished steers
also affected by feed availability and profit outlook
and heifers and 90% lean trimmings from cull cows
for cow-calf producers and dairy producers.
and bulls. Processors typically blend custom mixes
of 50s and 90s to achieve lean-to-fat ratios of 73-27, Cow and bull beef production through 2021’s first
80-20, 85-15, 90-10, 96-4, etc. Ground beef offerings eight weeks was up 0.3% from a year earlier. This
have expanded in recent years. We now routinely see is actually pretty impressive as weather-related
ground beef labeled as ground chuck, ground round, closures and shift cancellations hampered beef
ground sirloin, and there is even ground brisket and production at many processing plants, especially in
ground prime rib.
continued on page 77 March 2021
Ground beef demand remains strong, continued from page 6
the southern plains, as well as interrupted shipments phase after being decimated by the severe impacts of
of beef supplies and cattle. For the week ending a two-year drought in 2018 and 2019. Lower imports
February 20, 2021 dairy cow slaughter was down 9% from Canada and Mexico would also likely be needed
compared to a year ago, while beef cow slaughter was to hit the decline in total beef imports in 2021
down 26% and bull slaughter was down 49%. forecasted by USDA.
Year-to-date, total cow slaughter has been down 0.9% Cold storage stocks also augment beef supply.
from a year earlier, yet average cow carcass dressed Total Jan. 31, 2021 beef in cold storage was 6.3%
weights were 1.8% heavier. Minimal year-over-year higher than a year earlier. The Cold Storage report
changes in cow slaughter suggests the current cattle provides information on boneless and beef cuts. Both
inventory is fairly level. However, 2021 could be categories rose from 2020 levels at a rate of 5.7% and
another volatile year. Feed costs are expected to 14.6%, respectively. January levels of total beef and
erode margins, especially for dairy producers. Pricy boneless beef in cold storage were the highest since
feed may encourage stricter culling and bringing 2017, while beef cuts were the highest since 2018.
cattle to market at lighter weights. USDA does not tell us what kind of beef is in the
freezer. Was it imported beef? Was it beef that was
Imports aid blending staged before going to export? Was it product that
Enormous US ground beef demand drives beef packers and processors found was slow to sell and
imports, which are mostly lean beef. Without lean thus accumulated in the freezer?
imports to blend with trimmings to make ground
beef some of those fed cattle trimmings would have, Ground beef drives cull cow market
at best, value as tallow rather than as ground beef. Wholesale lean beef trimmings prices best show
USDA projects 2021 beef imports to be down 10.1% consumer demand-pull for lean beef. Fresh 90% lean
compared to 2020. prices started the year 25 cents per pound lower than
January 2020 levels. By March, they were 9 cents
Over 86% of all 2020 US beef imports came from higher than a year earlier. These prices are similar
Canada, Australia, Mexico, New Zealand and Brazil. to the values at the start of 2014, even though lean
Australia is the most likely country to curtail beef beef supplies are over 10% larger. On the live animal
exports. Australia’s herd is in a major herd rebuilding side, recent national, live equivalent, cutter 90% lean,
slaughter cow prices averaged $54.40
Figure 2. Slaughter cow prices per cwt., up from $51.46 a year earlier
National, live equivalent, cutter 90% lean (Figure 2).
Cull cow price forecasts are much
more limited than feeder or fed cattle
price forecasts. USDA’s Economic
Research Service makes these forecasts.
Cull cow values in 2021 are expected
to be even lower than prices realized
in 2020. An annual average of $60.50
per cwt. is forecasted for 2021, with a
second quarter average of $62, third
quarter average of $64, and fourth
quarter average of $57.
These forecasts are pricing downside
risk into cull cow values during the
year ahead. Additional supply from
larger slaughter rates and heavier
carcasses and/or a weaker demand
profile for ground beef would not
Data source: USDA-AMS-LPGMN, National Weekly Direct Cow and Bull
Report - Negotiated Price (LM_CT168) be a good sign for cull cow values.8 March 2021 Updates, continued from page 1 Internet Updates The following Information Files and Decision Tools have been updated on www.extension.iastate.edu/agdm: 2018 Farm Bill Payment Estimator by County for ARC-CO and PLC – A1-33 (Decision Tool) Current Profitability The following profitability tools have been updated on www.extension.iastate.edu/agdm/info/outlook.html: Corn Profitability – A1-85 Soybean Profitability – A1-86 Iowa Cash Corn and Soybean Prices – A2-11 Season Average Price Calculator – A2-15 Ethanol Profitability – D1-10 Biodiesel Profitability – D1-15 This institution is an equal opportunity provider. For the full non-discrimination statement or accommodation inquiries, go to www.extension.iastate.edu/diversity/ext. Permission to copy Permission is given to reprint ISU Extension and Outreach materials contained in this publication via copy machine or other copy technology, so long as the source (Ag Decision Maker Iowa State University Extension and Outreach) is clearly identifiable and the appropriate author is properly credited.
You can also read