An Economic and Market Analysis of the Development Sector - and the Factors Influencing Development in the Four Dublin Local Authority ...
←
→
Page content transcription
If your browser does not render page correctly, please read the page content below
An Economic and Market Analysis of the
Development Sector
  (and the Factors Influencing Development in the Four
     Dublin Local Authority Administrative Areas)

 For Dublin City Council

                                                  AUGUST 2015

           Prepared by: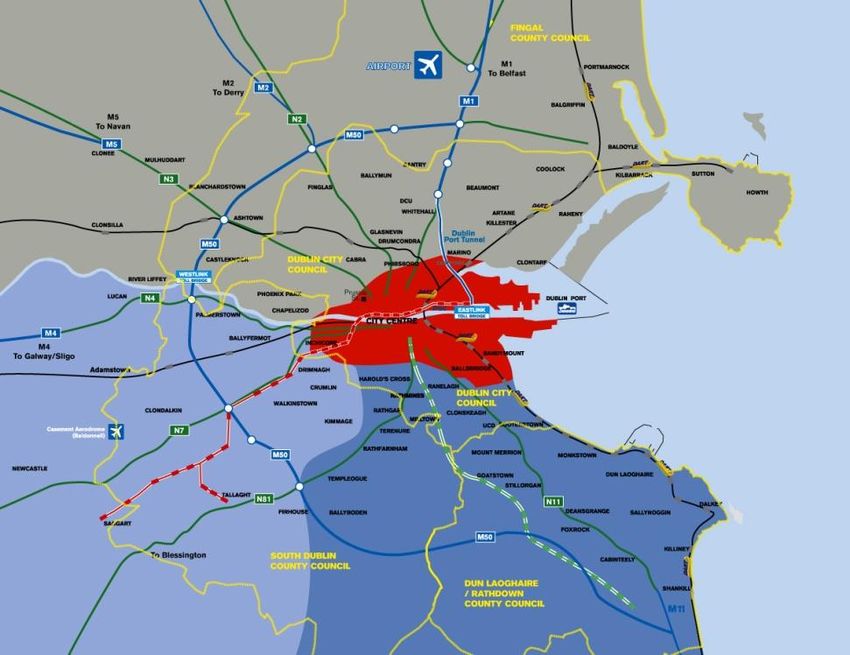
Economic and Market Analysis of the Development Sector                                                                                                  August 2015

Executive Summary ........................................................................................................................................ iii
1.0        Introduction ........................................................................................................................................ 1
   1.1         Development Contribution Schemes .................................................................................................... 1
   1.2         Contributions and Infrastructure and Facilities Provision ..................................................................... 1
   1.3         Legislative and Policy Context ............................................................................................................... 2
   1.4         Current Contribution Rates for Dublin City Council (from January 2014) ............................................. 3
2.0         Economic Analysis .............................................................................................................................. 4
   2.1         Overview of Terminology ...................................................................................................................... 4
   2.2         Development and Land ......................................................................................................................... 7
   2.3         Residential ........................................................................................................................................... 11
   2.4         Offices ................................................................................................................................................. 18
   2.5         Retail ................................................................................................................................................... 24
   2.6         Industrial ............................................................................................................................................. 27
   2.7         Pre-Planning Consultations ................................................................................................................. 31
   2.8         Commencement Notice Activity ......................................................................................................... 32
   2.9         Planning Permission Activity ............................................................................................................... 33
3.0        Assessment of Likely Trends .............................................................................................................. 36
   3.1         Residential ........................................................................................................................................... 36
   3.2         Office ................................................................................................................................................... 36
   3.3         Retail ................................................................................................................................................... 37
   3.4         Industrial ............................................................................................................................................. 37
4.0        Analysis of Construction/Development Costs.................................................................................... 38
   4.1         Construction/Development Costs and the Tender Price Index ........................................................... 38
   4.2         Market Factors Influencing Future Construction Costs ...................................................................... 39
   4.3         Market trends in the construction market .......................................................................................... 41
   4.4         Predicting the Future: Projection for the Construction Tender Price Index 2016-2020 ..................... 43
5.0         Analysis of Impact of Development Contributions on Construction/ Development Costs ................ 44
   5.1         Current Contribution Rates and Development Costs .......................................................................... 44
   5.2         Summary for Dublin City ..................................................................................................................... 45
   5.3         Other Factors Interacting with Development Contributions and Development Costs ....................... 45
   5.4         Dublin City and Viability ...................................................................................................................... 46
6.0        Indexation ......................................................................................................................................... 48
   6.1         Choice of Index .................................................................................................................................... 48
   6.2         Performance of Indices over Time ...................................................................................................... 52

Dublin City Council                                                                                                                                                        i
Economic and Market Analysis of the Development Sector                                                                                        August 2015

  6.3      Recommendation on Indexation ......................................................................................................... 53
7.0     Conclusions ....................................................................................................................................... 54
  7.1      The Likely Trends ................................................................................................................................. 54
  7.2      Construction and Development Costs Implications ............................................................................ 55
  7.3      Recommendations on Indexation ....................................................................................................... 55

DISCLAIMER

Future Analytics Consulting (FAC), Lisney and O’Reilly Hyland Tierney and Associates (ORHT) would like to
acknowledge the valuable assistance and inputs to this assessment provided by a number of individuals within
the 4 Dublin Local Authorities. That said, the usual disclaimer applies and responsibility for the analysis and
findings in this independent report remain the sole responsibility of the consultants. The reports are issued on
the understanding that the particulars therein are given in good faith and are believed to be correct. The
consultants do not represent, warrant, undertake or guarantee that the use of guidance in the report will lead
to any particular outcome or result.

Dublin City Council                                                                                                                                            ii
Economic and Market Analysis of the Development Sector                                                 August 2015

Executive Summary

Development contributions are a key instrument to facilitate Local Authorities in the provision of
infrastructure and facilities for their administrative area. Such public infrastructure and facilities are central to
achieving sustainable development and supporting the type of environment that people wish to live in, and
one where communities and businesses can thrive. Development contributions ultimately provide essential
resources to support the implementation of development plans (through the provision of physical and social
infrastructure).

The four Dublin Local Authorities commissioned Future Analytics Consulting, Lisney and O’Reilly Hyland
Tierney and Associates to undertake this Economic and Market Analysis of the Development Sector, including
consideration of the factors influencing development in the four Dublin Local Authority administrative areas.

The purpose of this analysis is to inform the preparation of a new Development Contribution Scheme for each
of the four Local Authorities, which will operate from 01 January 2016 through to 31 December 2020.

As part of the Economic and Market Analysis of the Development Sector, a dedicated report has been prepared
for each Local Authority area, recognising the unique characteristics which prevail in the property market in
each area. The reports encompass: an economic analysis of the current general economic situation across
various sectors of the property market within each Local Authority area; an assessment of likely trends in the
development sector during the lifetime of the proposed scheme (2016-2020) within each Local Authority area;
an analysis of current and future trends in construction and development costs; an analysis of the impact of
development contributions on development costs and, as such, development potential and values; and, an
evaluation of indexation types followed by a recommendation on the most appropriate indexation to be
applied to development levies during the lifetime of the scheme.

Development contributions are an important resource for the delivery of public infrastructure and facilities.
They are also one of a number of costs to a developer, and are thus a consideration in determining viability.
Changing property values, land values, state interventions in the market (e.g. mortgage lending criteria),
finance availability and constructions costs are some of the other key components which will influence the
level of development over the next five years.

Overall, it is important to note that the outlook in the property sector is generally positive but the market
remains in recovery mode following a protracted downturn and as such, is still fragile in some areas. Not all
new construction is currently viable and end demand is not uniformly spread throughout the four Dublin Local
Authority areas.

Based on the analysis conducted it has been found that the SCSI Construction Tender Price Index has been
more reflective of the market over the previous years than other indices. Accordingly, it is recommended that
the SCSI Construction Tender Price Index is the most appropriate indexation for the Development Contribution
Scheme.

Dublin City Council                                                                                                iii
Economic and Market Analysis of the Development Sector                                                August 2015

1.0      Introduction

The four Dublin Local Authorities (Dublin City Council, Fingal County Council, South Dublin County Council and
Dun Laoghaire Rathdown County Council), appointed the project team of Future Analytics Consulting, Lisney
and O’Reilly Hyland Tierney and Associates to conduct this Economic and Market Analysis of the Development
Sector, and to consider the factors influencing development in the four Dublin Local Authority administrative
areas.

The analysis will inform the review of the existing Development Contribution Scheme for each of the four Local
Authorities, and the preparation of new Development Contribution Schemes for the period 01 January 2016 to
31 December 2020.

The purpose of this report is to provide an economic and market analysis which will help to inform Dublin City
Council (DCC) of existing and future market conditions and to ensure that the right balance is achieved
between raising funds for infrastructure and not unduly imposing excessive costs that result in reduced
economic activity, limit job creation opportunities or facilitate unsustainable development.

1.1      Development Contribution Schemes

Each Local Authority is required to make a General Development Contribution Scheme under Section 48 of the
Planning and Development Acts 2000-2014. The contribution scheme outlines the rate of contribution to be
paid in respect of public infrastructure and facilities benefiting development in the area of the Local Authority,
and that is provided, or that it is intended will be provided, by or on behalf of a Local Authority.

The scheme shall state the basis for determining the contributions to be paid in respect of public infrastructure
and facilities and shall state the basis for determining the contributions and shall identify the different classes
of public infrastructure and facilities to be provided and shall have regard to the actual estimated cost of
providing the classes of infrastructure and facilities. The scheme may allow for the payment of a reduced
contribution or no contribution in certain circumstances, in accordance with the provision of the scheme.

This document, an Economic and Market Analysis of the Development Sector, will help to inform the
preparation of the Development Contribution Scheme for the period 01 January 2016 to 31 December 2020
and will form the basis for determination of the specified contributions.

1.2      Contributions and Infrastructure and Facilities Provision

Contributions are collected by a Local Authority in order to provide infrastructure and facilities for the city or
county. The income generated from development contributions is a critical source of capital funding for the
four Dublin Local Authorities which is utilised to part fund essential public infrastructure. The type of
infrastructure provided includes roads, surface water/flood relief works, urban regeneration, parks and
community facilities and amenities. This type of public infrastructure is essential for sustainable development
in order to provide the type of environment that people wish to live in and that communities and businesses
can thrive in - it is for the benefit of the population of the city and county. Furthermore the economic recovery
of the city and county is dependent on having the type of infrastructure in place that facilitates a return to
sustainable growth.

Dublin City Council                                                                                              1
Economic and Market Analysis of the Development Sector                                                 August 2015

1.3      Legislative and Policy Context

Sub-section (1) of Section 48 of the Planning and Development Act, 2000 enables a planning authority, when
granting a planning permission under Section 34 of the Act, to include conditions requiring the payment of a
contribution in respect of public infrastructure and facilities benefiting development in the area of the
planning authority, and that is provided, or that it is intended will be provided, by or on behalf of a Local
Authority (regardless of other sources of funding for the infrastructure and facilities).

A number of changes to the legislative and policy context relating to the making of Development Contribution
Schemes have occurred or have been proposed in recent years.

The Urban Regeneration and Housing Act, 2015 amends Section 48 of the Planning and Development Acts
2000-2014 to allow that development contributions can be lowered to reflect lower contribution rates that
would apply had the scheme been granted planning permission at that time. If a commencement notice has
not been lodged or where the development comprises houses and one or more of those houses has not been
sold the planning authority shall apply the change. The latter is only to apply to those houses that are yet
unsold.

The Act introduces a vacant site levy. A site is considered to be vacant if in the case of residential land it is
situated in an area in need of housing, the site is suitable for the provision of housing and the site or the
majority of the site is vacant or idle; and in the case of a site consisting of regeneration land, the site is vacant
or idle and the site being vacant or idle has adverse affects on existing amenities or reduces the amenities
provided by existing public infrastructure and facilities. The Local Authority must make a determination as to
the market value of the site and shall levy the owner every year from 2018 onwards a percentage of the
assigned fixed value (0%, 0.75%, 1.5% or 3%). The vacant site levy may provide an incentive to landowners and
developers to bring sites forward for planning and development. The implications of payment of the levy and
the requirement to bring sites forward may have interactions with viability depending on the market at the
time.

The Act amends Part V of the Planning and Development Acts 2000-2014. The previous 20% social and
affordable housing requirement has been reduced to 10% social housing. Furthermore, the Act amends
Section 97 of the 2000 Act, by increasing the threshold upon which the social housing requirement would
become applicable, from the current position of schemes greater than 4 no. housing units, to schemes greater
than 9 no. housing units.

Development Contributions: Guidelines for Planning Authorities was published by the Department of
Environment, Community and Local Government (DECLG) in 2013. This provides guidance to Local Authorities
in relation to the making of the Development Contribution Schemes. There are a number of requirements
which must be incorporated into the scheme. These include but are not limited to: reduced rates or waivers
for development in town centres; reduced rates for temporary permissions; reduced charges for renewable
energy developments; and promoting the development of areas prioritised in the core strategy (sets out how
the development plan is consistent with national and regional legislation and sets out the zoning requirements
for residential use) prepared by the Local Authority. The spirit of the Guidelines is oriented, in the main,
towards those locations where the impact of the economic downturn has been most severe and where such
interventions can stimulate sustainable economic activity and development patterns. Accordingly, given the
position of Dublin city and county as the economic driver for Ireland as part of the NSS Gateway, development
areas across the four Dublin Local Authorities are deemed to have equal status (in importance) as facilitators
for sustainable growth.

Dublin City Council                                                                                                2
Economic and Market Analysis of the Development Sector                                              August 2015

Irish Water is now the responsible authority in relation to the provision of water services. The water element
of Development Contribution Schemes has therefore been removed in order to reflect this change. Since
January 2014, Irish Water now levies a charge in respect of water services infrastructure provision for
developments granted planning permission.

An annual Local Property Tax (LPT) charged on all residential properties in the State came into effect in 2013.
The LPT is collected by the Revenue Commissioners. The LPT is levied on any building or structure (or part of a
building) which is used as, or is suitable for use as, a dwelling and includes grounds of up to one acre. The LPT
does not apply to development sites or farmland. The tax payable is based on the market value of relevant
properties and this is declared through self-assessment of the value. It is prudent to note that the LPT is a tax
payable to the Revenue Commissioners and does not provide income to Local Authorities for use for the
provision of infrastructure (such infrastructure is facilitated via ‘Section 48’ provisions within the Planning
and Development Acts 2000-2014).

1.4      Current Contribution Rates for Dublin City Council (from January 2014)

The current development contribution rates for Dublin City Council are listed below. The rates reflect a
reduction introduced from 01 January 2014 given that Irish Water is now the responsible authority in respect
of water supply and waste water services.

                                   Residential                            Commercial
 Dublin City Council               €86.40 per sq.m.                       €70.06 per sq.m.
Table 1: Dublin City Council Development Contribution Scheme Rates

Dublin City Council                                                                                            3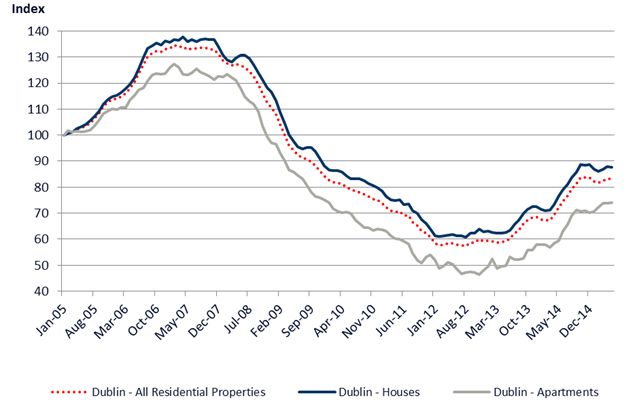
Economic and Market Analysis of the Development Sector                                               August 2015

2.0      Economic Analysis

The following section provides an analysis of the prevailing conditions and five year outlook for the property
market, focusing on development land, residential, office, retail and industrial. The general factors influencing
development are discussed in conjunction with an analysis of the land market while trends in the other
property market sectors are reviewed thereafter.

2.1      Overview of Terminology

Before reviewing the property market and for the avoidance of any doubt on the meaning of certain
terminology throughout this section, we have set out in the table below a list of some of the key words and
phrases used with a brief explanation of each.

Affordability         Affordability relates to a potential purchaser’s ability to get and then fund a mortgage
                      each month. There are a number of components to affordability including property
                      prices, mortgage interest rates and disposable income.

Capital Gains Tax     Budget 2012 introduced measures whereby an investor purchasing either residential or
(CGT)                 commercial property, between the start of 2012 and the end of 2014, could avail of a
                      seven year waiver from capital gains tax once they held the property for a minimum of
                      seven years. This encouraged a significant volume of investment over the three years and
                      in particular, in the second half of 2014. In the residential market, this was particularly
                      noticeable in the apartments market and did assist in driving prices upwards at a fast
                      pace in 2014. This benefit has now ended, which means that a large proportion (but not
                      all) of investor demand has left the market. This may be feeding into the slight falls in
                      prices over the opening months of 2015.

Central Bank          This legislation was introduced in January 2015, the aim of which is to encourage prudent
Restrictions on       lending by implementing strict limits on the amount lent relative to a purchasers’ income
Residential           and the value of the property and as such, reducing the risk of prices reaching
Mortgage              unsustainably high levels. There are different rules for first time buyers (FTB), mover
Lending               purchasers (MP) and investors in terms of loan-to-income (LTI) and loan-to-value (LTV)
                      ratios. There is scope within the legislation to amend the limits set out below as market
                      conditions change.

                                           LTI                            LTV

                       First Time Buyer    3.5 x gross                    90% up to €220,000
                                           income                         property value
                                                                          (i.e. 10% deposit)
                                                           20% of all
                                                                                                15% of all FTB
                                                         FTB and MP
                                                                          80% on balance            and MP
                                                          mortgages
                                                                          over €220,000         mortgages can
                                                          can exceed
                                                                          property value          exceed this
                                                         this limit per
                                                                          (i.e. 20% deposit)    limit per year
                                                              year
                       Mover               3.5 x gross                    80% loan
                       Purchaser           income                         (i.e. 20% deposit)

                       Investor            No income                      70% loan
                                           limits                         (i.e. 30% deposit)

Dublin City Council                                                                                              4
Economic and Market Analysis of the Development Sector                                                 August 2015

                      It should be noted that mover purchasers who wish to carry negative equity from an
                      existing home will not be subject to the rules as they will be utilising specifically tailored
                      mortgage structures.

                      The impact of the regulations is not yet fully known as those with mortgage approval for
                      six or nine months that pre-dates the commencement of the rules are still working
                      through the system and because so much of the market is made up of cash purchasers.
                      However, it is evident that in conjunction with other factors (see page 10), these rules
                      have dampened the market in the Dublin region with values falling slightly over the
                      opening months of the year.

Development           Development land refers to zoned lands capable of being developed with buildings.
Land                  Development lands can be greenfield (have not been previously developed - usually outer
                      suburbs lands) or brownfield (buildings were previously on the land - usually more central
                      locations).

Development           Development land value refers to the price potential purchasers would pay for zoned
Land Value            land (i.e. this is different to property value which refers to actual constructed buildings,
                      see below).

Design Standards      Reference to design standards in this document refers to National Building Regulations,
                      the Department of the Environment Community and Local Government’s (DECLG) Design
                      Standards for New Apartments and Dublin City Council’s (DCC) Development Plan
                      Standards for Residential Accommodation. Examples include, but are not limited to,
                      those standards relating to energy efficiency; basements in higher density schemes and
                      those requirements specifically relating to apartments (size, cores, aspect, floor to ceiling
                      height and balconies).

FTB                   First Time Buyer - a person buying a residential unit who has not previously owned a
                      home.

High Density          In the case of Dublin City Council’s administrative area, high density refers to greater than
                      50 residential units per hectare.

Marginal Sites        Sites that are just at or close to viability. A small negative change in any one factor
                      relating to end value or cost can make a scheme unviable.

Medium Density        In the case of Dublin City Council’s administrative area, medium density refers to a
                      minimum of 35-50 residential units per hectare.

MP                    Mover Purchaser - a person buying a residential unit who has previously owned a home.

Multi-Family          A block of residential units, each in separate occupation but with one overall owner, e.g.
Investment            a block of 50 apartments owned by an investor but with 50 individual lettings.

Off Market            Not publically advertised.

Pre-Let               Constructing a new building with an occupier (either tenant or owner-occupier) in place
                      before construction starts. This is a less risky type of construction as it is known from the
                      outset that the building will generate income once complete. Banks are more willing to
                      finance such construction.

Property Market       Recognised theory suggests that the property market follows a predictable cycle and has
Cycle                 three recurring phases - boom, slump and recovery. International evidence suggests that
                      cycles can range from four to 12 years. The process is illustrated in the diagram below:

Dublin City Council                                                                                                5
Economic and Market Analysis of the Development Sector August 2015
Boom
Recovery
Slump
The Dublin property market is currently in the early recovery stage.
Property Value Property value refers to the price potential purchasers would pay for constructed
buildings (i.e. this is different to development land value as set out above).
Speculative Constructing a new building with no occupier (either tenant or owner-occupier) in place
Construction before construction starts. This is the most risky type of construction as the developer
does not know if the building will generate income once complete. Banks are generally
reluctant to finance speculative construction.
Take-Up The amount of empty accommodation either let to a tenant or sold to an owner-occupier
over a period of time - generally annually or quarterly. Sometimes this is referred to as
‘activity’.
Vacancy Rate The amount of empty accommodation available to rent or buy, divided by the total stock
of accommodation.
Viable / Viability A new property development is viable if the end value of the completed scheme exceeds
all costs associated with development including an element of profit for the developer,
i.e.
End Property Value
(Commercial or Residential)
Less Development Costs
Construction Costs
Letting and Disposal Costs
Fees and Development Levies
Finance on Construction Costs
Site Acquisition Costs (Site + Finance)
Equals Developers Profit (expressed as a % of Costs)
For a scheme to be viable, a developer in the current market generally requires a profit of
15% of construction cost but this may increase for certain types of development that are
considered very risky or a very large project. This measure of 15% of construction cost is
the accepted industry standard and it is at this level due to the high levels of risk
associated with development and because a developer cannot get funding unless this
level of profit is factored into the analysis. Sometimes developer’s profit is represented as
a percentage of end-value (which is a lower percentage). However, it is not an accurate
measure of risk to the developer and is rarely used.
New construction will generally not commence if it is not viable because the developer
would not break even and will lose money.
Dublin City Council 6Economic and Market Analysis of the Development Sector August 2015
2.2 Development and Land
The mid 2000’s were years of exceptionally strong residential and commercial property development
and the development land market peaked in 2007. For the following two years, schemes were
completed but little or no new construction commenced. During this time (2008/2009) and for the
following three or so years, only a very limited number of sites either came to the market or were
sold. Additionally, new construction levels ran at all-time low rates. Small infill sites in the suburbs
were the first to be offered to the market in late 2012 due to their improving viability. In the latter
part of 2013 some larger parcels of land started to come to the market and this trend strengthened in
2014.
2014 was the strongest year since 2007 in the development land market with supply, demand, activity
and values all increasing across the Dublin region. However, activity slowed slightly in the first quarter
of 2015 (due to fewer sites coming to the market) before picking up again in Q2. Demand is still very
strong. 2014 was notable for the sale of larger sites (such as Project Cherry in the DLRCC
administrative area) and while smaller sites dominated Q1, some larger sites have come to the
market in Q2.
Purchasers were a mix of national and international investors/developers in 2014. For larger sites it
was evident that blended buyers were in the market whereby international private equity financiers
were joining forces with local developers who had experience and market knowledge. However, in
the opening months of 2015, the market became more local in nature. This is likely a result of the
smaller lot sizes of sites. Off-market deals are also a feature of the market, wherein the sites are
usually put to a small number of prospective purchasers and concluded with an informal tender.
Where sites are shovel-ready, premiums have often been paid. In Dublin City Council’s (DCC)
administrative area, the key focus remains on high profile mixed-use city centre sites, such as the
Docklands and Ballsbridge. This is clearly due to the persistent supply shortages of both residential
units and prime modern office accommodation.
Some noteworthy redevelopment opportunities in Dublin city centre have sold or come to the market
in H1 2015. Hibernia REIT was particularly active. In February it acquired the Garda Headquarters on
Harcourt Street, Dublin 2 for €70m in an off-market transaction. Leases are currently in place on part
of the existing office accommodation, while the new owners lodged a planning application for a new
larger office scheme in June. In March, Hibernia REIT also purchased Cumberland House on Fenian
Street, Dublin 2, for €49m. The existing 1970s dated office building is on a site of 1.6 acres and again,
this property offers significant redevelopment potential for a greater quantity of office
accommodation.
In April, Project Trinity came to the market and the sale is now in its final stages. This comprises the
high profile Ballsbridge redevelopment site, Dublin 2, currently housing the Clyde Court and
Ballsbridge hotels. The site extends to 2.8ha and has planning permission for a mixed-use high density
office, residential, hotel and retail/leisure scheme, which runs until 2021.
There are other mixed-use sites in Dublin city centre where sales are ongoing such as Tara House on
Tara Street, Dublin 2 (where CIE is seeking a development partner on its 0.13ha property) and the
former British & Irish Steam Packet site on Sir John Rogerson’s Quay (0.72ha guiding €30m).
Additionally, a development agreement has been reached on the 0.93ha former An Post site on
Dublin City Council 7Economic and Market Analysis of the Development Sector August 2015
Cardiff Lane. As part of this transaction, developers New Generation will provide An Post with a new
facility on Ravensdale Road at East Wall in addition to a cash payment.
In terms of some of the suburban residential sites (in all four of the Dublin local authority areas)
where sales were completed in the first half of the year, examples include the 0.51ha former Europa
Motors site in Blackrock (€7.5m); the 3.3ha Marianella site on Orwell Road (€42m); 7.8ha at
Barrington Towers, Brennanstown Road (€18m); 6.7ha at All Hallows in Drumcondra; 13.9ha at The
Spawell in Templeogue (€9m); and a 0.51ha site on Parnell Road, Dublin 12 (€2.3m). Examples from
2014 include a 9.9ha site on Scholarstown Road, Dublin 16 (€37m) and 27.5ha site at Hollywoodrath
in Tyrrelstown, Dublin 15 (€11.5m); a 5ha site on Bray Road in Cabinteely (€13m) and a 3.26ha on
Limekiln Road in Greenhills, Dublin 12 (€7.8m).
As mentioned in section 1 of this report, the Urban Regeneration and Housing Act 2015 was signed
into law in late July and impacts on property development. The changes to Part V and retrospectively
reducing development contributions on existing planning permission will enhance the viability of
projects in certain areas. The impact of the vacant site levy will not be known until 2019/2020 when it
comes into operation and it will need to be monitored.
The reduced development contribution rates adopted by a planning authority under a new
development contribution scheme have retrospective effect for any planning permission granted
before the adoption of the revised scheme (where a commencement notice has not yet been lodged
in respect of the development). Where a permitted scheme includes houses or apartments which are
not yet all sold, the reduced development contribution should apply to the unsold units (the condition
associated with the development contribution can be changed by the planning authority). This will
assist in making more schemes viable and as such, construction will commence sooner. In relation to
the Part V requirements, the reduction from the 20% social and affordable requirement to 10% social
housing provision is, as with the reduced levies, positive in terms of new construction activity.
In DCC’s administrative area, higher density residential development is viable in the south docks and
is marginal in the north docks; medium to higher density developments is possible on sites in Dublin 4
and Dublin 6; while in the suburban parts of DCC, medium density development is feasible. However,
with end values increasing, viability is spreading to further areas. The development of higher density
apartment schemes for multi-family investment purposes in the Docklands are being examined by
investors at present, particularly those from overseas. This is to cater for the significant number of FDI
employees working in the Docklands areas, who want to live in the city and benefit from city living
and proximity to work.
Following a number of years where office development was not viable in the city centre (i.e. between
the canals and into Dublin 4), it did reach a breakeven point in the latter part of 2013 when land
values were at about €24.7m per hectare and rents were €366 psm (€34 psf). However, with
increasing land values on high profile city centre sites, the breakeven point has moved out. Land
values are now in excess of €50m per hectare and therefore, office rents need to be in excess of €510
psm (€47.50 psf). This is not an issue because current prime office rents in the city centre are just in
excess of this, at between €520 and €560 psm (€48-€52 psf). Non-traditional office locations (the
traditional location is taken as between the canals and into Dublin 4) will generally not become viable
in the next five years, for example areas like Park West where a significant proportion of the office
property is vacant.
The viability of any new construction depends on various factors relating to the cost of construction
Dublin City Council 8Economic and Market Analysis of the Development Sector August 2015
and the end value of the scheme. With property values generally improving, this side of the equation
has become more favourable. However, there are a wide range of costs that can still be an issue for a
developer considering construction. Examples include rising tender costs, the cost and availability of
finance for both site purchase and construction (for some but not for all), rising land values, design
standards (see overview of terminology in section 2.1), VAT on new housing, Part V requirements and
local authority development contributions. The severity of the impact of each of these costs varies
from scheme to scheme and changes depending on location and type of property being developed.
Some of these costs are changing continually, certain ones becoming more favourable and others
more expensive, which have both a positive and negative impact on viability.
In terms of the interest developers must pay on finance for both site acquisition and on construction,
over the last 18 months, the landscape for development funding has changed with its availability
improving. The cost of finance can vary significantly depending on financier. Current sources in the
market include:
o Private Equity - funds such as M&G Global, Centrebridge, Oaktree, King Street Capital and
Broadhaven have joined up with Irish developers and directly funded various projects. The
cost of this capital varies significantly from low levels to rates in the late teens;
o NAMA - it has funded residential schemes at very low rates of approximately 5% for
developers such as Cosgrave Property Group, Gannon Homes, Park Developments and
Bovale Developments;
o IPOs - Cairn Homes PLC floated on the London Stock Exchange in June and raised
approximately €400m in new capital to fund its purchase and development of sites in
Ireland. The cost of this finance is effectively zero;
o REITs - similar to Cairn Homes’ IPO, the three listed Irish REITs (Green, Hibernia and IRES) are
funded through money raised from the stock market;
o Strategic Investment Fund - the €7bn former Pension Reserve Fund has now become the
Ireland Strategic Investment Fund, the aim of which is to facilitate a redeployment of the
resources on a commercial basis to areas of productive development. Infrastructure and
property can form part of this, however any proposals must comply with the requirement for
‘double bottom line’ whereby it must provide an economic impact and an investment return;
o Banks - traditional bank lending is generally only on offer on prime opportunities in key areas
and only for development (i.e. not site purchase). There is an emerging trend of blended
rates from mainstream banks with mezzanine debt providers;
o Cash - there are various domestic builders who are using their own cash to fund purchases
and schemes.
NAMA plans to fast-track residential development by way of licence agreements with builders. It is
currently running a test case in Maynooth, Co Kildare by selling a 6.1ha site with planning permission
for 136 units. In evaluating proposals, NAMA will take account of the level of offer and structure, the
potential purchaser’s track record and proof of funding. Therefore, those with an existing
construction platform capable of delivering the units within a certain timeframe will be best placed to
be successful. Should this method of sale prove successful, NAMA will roll out further sites in the
greater Dublin area in this manner. The key benefits are that the developer never actually buys the
site so no stamp duty is payable and no large upfront site acquisition payments need to be made,
possibly just a deposit (depends on the deal structure but perhaps about 10% of the site value) and
then as completed units are sold, a percentage of the sale price goes to the land owner. It is a useful
way to curtail land hoarding and expedite the delivery of units into the market place. Such a format
could be used for some key sites in DCC’s administrative area in the future.
Dublin City Council 9Economic and Market Analysis of the Development Sector August 2015
The North Lotts & Grand Canal Dock planning scheme was approved in 2014, which means that fast-
track planning is now available on sites within the SDZ’s boundaries. This is very welcome news for
the market and the fast delivery of accommodation. Earlier this year, sites within Block 14 and Block
17 of the SDZ received permissions for mixed use schemes, which will greatly assist in providing
additional office accommodation to the market in two to three years’ time. They include 76 Sir John
Rogerson’s Quay, Dublin 2, (9,300 sqm offices and 58 apartments); 5 Hannover Quay, Dublin 2,
(18,000 sqm offices and 100 apartments); and the former Boland’s Mill site (30,000 sqm offices, 42
apartments and retail space).
DCC continues to advance major urban regeneration schemes on its lands. Commercial
redevelopment is either ongoing or planned in various areas, for example in Ballymun Town Centre,
the Digital Hub area and at the City Markets in Smithfield. There is also a significant focus on
residential projects. Some examples of large schemes that are ongoing, about to commence or due to
go to tender in 2015 include the Crampton Buildings (28 apartments), St Teresa’s Gardens Phase 1 (50
units), Charlemont Street PPP (79 units) and Dolphin House Phase 1 (100 units). All of these are
positive schemes in providing commercial and residential accommodation.
In a housing construction collaboration, the elected members of DCC, the Department of the
Environment, Community and Local Government and the National Treasury Management Agency
sought participants in February to explore the options for developing some of the larger sites owned
by DCC. In particular, lands at Belcamp/Malahide Road; lands at Cherry Orchard; and lands at Oscar
Traynor Road/Malahide Road. Respondents were interviewed on a one-to-one basis in a technical
dialogue and we understand that given the level of engagement, it was clear that the market is
interested in working with DCC to develop some of its land for a mix of housing types and tenures.
Outlook – the outlook for the development land market over the next five years is positive. With
improving economic conditions and a growing population, there will be demand for residential and
commercial properties in the short-term. Given that there are supply constraints in these sectors in
DCC’s area, new development will be required and consequently, more land will transact. This is
positive for the city and the continued attraction of productive investment. The most important
factors influencing viability and the level of new development over the next five years will be:
o Changes in property values - the greater the increase in property values, the more property
is likely to be developed as rising prices assist by making new construction viable.
o Changes in land values - the greater the land value, the higher end property values need to
be for a scheme to be viable. If land values increased dramatically, then areas that are
currently viable to develop new accommodation may no longer be unless property prices can
increase to match this (this just relates to new land sales and if a developer purchased land
earlier in the property market cycle, this will be less of an issue). Generally speaking if land
prices increase by 30%, then end property prices need to increase by 5% to match it (if all
other costs remain static).
o State intervention - changes to legislation can affect prices and viability. For example,
changes to mortgage lending criteria (discussed on page 4) have had a negative effect on the
residential market in the first half of 2015 and if other unexpected interventions were to
occur, these too could have an impact (these could be positive or negative). The recent
implementation of the Urban Regeneration & Housing Act 2015 is another example with the
vacant site levy and the changes to Part V likely to have an impact on the development land
Dublin City Council 10Economic and Market Analysis of the Development Sector August 2015
market and on viability in the coming years.
o Finance - the availability of finance for site purchase and construction has improved
significantly over the last 18 months. For future development to occur at a reasonable pace,
finance needs to remain available and at reasonable rates.
o Local authority development contributions - while only part of a wide range of costs to the
developer, the levy rate does have an impact on the cost of schemes, particularly when at
the recovery stage of the property market cycle.
o Design standards - compliance with standards add to the cost of construction.
o Construction cost - as noted in the analysis for the projection for construction tender prices
2016-2020 the market has developed from a bottoming out period in 2010-2011 with
modest inflation in the period 2012-2013 with a more acute increase in 2014. It is anticipated
based on current market conditions that the period 2016-2020 will be a continuation of
increasing construction tender prices, the scale of which will be dependent on market
influencing factors including (but not limited to), (i) construction output as % of GNP, (ii)
available labour and specialist construction companies and (iii) development of key sectors of
residential, offices and retail.
2.3 Residential
This section focuses on the sales and lettings markets in Dublin. The trends discussed below relate to
both new and second hand properties as this provides an overview of the entire residential market,
which is required when considering future new construction. It should be noted that the majority of
purchasers do not distinguish between new and second hand residential units when buying a
property.
1
Between 1996 and 2006, residential property prices in Dublin grew by 419% . The market then
2
peaked in Q3 2006 and prices continued to fall for the following five and a half years until Q1 2012 .
This was one of the OECD’s largest and most protracted downturns.
A significant recovery occurred very quickly between mid-2012 and the end of 2013 (our index for all
Dublin shows growth of 28.7% over this period with the DCC area slightly higher at 31% growth over
the period). As sentiment strengthened and potential purchasers saw prices rising, greater numbers
were encouraged back into the market, many having waited on the side-lines for a number of years.
In the context of low levels of supply and large amounts of cash, this had a compounding effect and
further fuelled the market. In the early part of 2014 prices continued to increase (rising 12.6% over
the first six months, DCC slightly less at 10.3%) and the gap between vendors’ expectations and what
purchasers were willing to pay widened. With much attention on the market, those looking to buy
were more cautious of high asking prices and very focused on affordability (see terminology page 6),
which was weakening. In the latter part of 2014, prices continued to rise but at a slower pace (growth
of 0.9% in Q4 compared to on average 6% in each of the previous three quarters based on Lisney’s
index) and much of this was driven by investors availing of the CGT waiver (see terminology page 5)
before the end of December.
1
Permanent TSB/ESRI House Price Index.
2
Based on Lisney’ Dublin Residential Value Index. It should be noted that the CSO index records a later peak (August
2007) and a later trough (August 2013). This is due to the composition of each index. The CSO’s Residential
Property Price Index is based on mortgage drawdowns and excludes cash purchases, which has been making up a
large part of the market, for the analysis. Additionally, by basing an index solely on the mortgage market, there is a
time lag in data by a number of months. Lisney’s index is based on the valuation of a basket of properties and as
such, there is no time-lag on the data and all categories of purchasers are considered.
Dublin City Council 11Economic and Market Analysis of the Development Sector August 2015
Lisney believes that residential prices increased too quickly in 2014 and since the start of 2015, the
market has been correcting itself as it entered into a settling down period with some price declines.
The ending of the CGT waiver for investors plus the introduction of the Central Bank’s new rules on
mortgage lending (see terminology page 4) also had an impact. Consequently, 2015 got off to a
slower start throughout Dublin with approximately one third fewer residential units sold in Q1
compared to the last three months of 2014 (please note that it is not possible to isolate DCC-area
specific data from this, but we believe it is relatively similar). Despite this, Q1 2015 was more active
than Q1 2014 with the number of sales in Dublin up by about 36%, and based on initial estimates, Q2
sales are likely to be higher than the same period last year. While some of the activity early this year
could be a hangover from the huge levels of activity in the run up to the CGT deadline, we believe that
it also shows that demand is still strong. So far in 2015, there remains significant demand from
prospective buyers seeking properties in all parts of the DCC area but they are very much focused on
price and affordability. As such, homes with sensible asking prices are attracting greater levels of
interest and selling quickly but purchasers are more reluctant to consider properties that they
perceive to be currently over-priced.
Figure 1: Dublin Residential Units Sold, Source: Property Services Regulatory Authority
Since 2011, Lisney has highlighted that there are residential supply constraints in Dublin. Half way
through 2015, the problem is as acute as ever despite some improvements over the last 18 months. In
percentage terms, the number of residential units for sale has increased by about 110% since January
2014, which is quite large. However, percentages can be misleading and the actual increase is c. 2,800
units.
Figure 2: Dublin Supply, Source: MyHome.ie, Lisney
Dublin City Council 12Economic and Market Analysis of the Development Sector August 2015
With overall supply in Dublin currently at just under 5,400 units (half of what it was in mid-2011), this
is not enough to provide adequate choice to potential buyers. It is difficult to see how this can
improve significantly without intensification in new home construction. As is well reported, residential
building remains at very low levels with only 3,270 units built in Dublin in 2014 and just 650 in Q1
2015 - the long-term average (1970-2014) is close to 8,000 per year (or 2,000 a quarter).
Figure 3: New Residential Construction, Source: DECLG
The map below shows by area (i.e. former Dublin postcode districts) the number of houses and
apartments available for sale as at the start of July 2015. For DCC’s area, it can be seen that levels
are very low.
Figure 4: House & Apartment Availability, Source: MyHome.ie
Cash purchasers are still a very large part of the Irish residential market. Figures are not yet available
for Q2 of this year, but Q1 data show that 45% of purchases nationally were made fully by cash. It is
not possible to isolate Dublin or indeed DCC figures from this national level, however, from
experience in the DCC area, we have found that cash makes up about 40% of sales. These generally
comprise properties being bought for investment purposes and higher value homes. First time buyers
and those trading up (up to a value of about €1m) are normally financed, however some have larger
amounts of equity/deposits than others.
Dublin City Council 13Economic and Market Analysis of the Development Sector August 2015
Figure 5: Cash versus Mortgage Funded Purchases, Source: Property Services Regulatory
Authority, Irish Banking and Payments Federation, Lisney
Over the past 18 months the availability of mortgages from banks to potential home owners has
become much more favourable. Indeed, banks are now competing with each other for mortgage
business. This is in stark contrast to two to three years ago when very little mortgage finance was on
offer. However, the issue remains that lending criteria (LTV and LTI - see terminology page 4) are now
much stricter than in the past and as such, the numbers seeking mortgages has declined.
Dublin City Council 14Economic and Market Analysis of the Development Sector August 2015
The chart below shows how mortgage lending completely collapsed as the recession took hold. While
it does not look significant on the chart, there have been increases in the last year. Taking Q1 2015,
€983m was drawn-down in mortgage lending, 70% more than Q1 last year. In terms of the numbers
of mortgages given out, they totalled 5,618, a 64% increase year-on-year. These are national level
figures and while county level data is not available, it does provide an overall trend. It is important to
remember that this most recent data on lending relates to approvals that pre-date the Central Bank
rules on deposit amounts and income ratios. It is unlikely that the full impact of these restrictions on
mortgage lending will become apparent until all approvals from last year run out, which will be in the
coming months.
Figure 6: Mortgage Drawdowns, Source: Irish Banking & Payments Federation
In terms of this Central Bank’s regulations on lending, we believe that in the coming years, they will
have the most impact on the new homes market. In a large number of cases (albeit not all), new
homes are targeted at the FTB end of the market. Imposing a limit of €220,000 on the amount a FTB
can borrow with only a 10% deposit (i.e. 90% LTV) will have an impact on the type and specification of
homes that developers will consider building. While FTB will only have to have the 20% deposit on the
balance over €220,000, given the nature of this type of purchaser in terms of their ability to save large
amounts, they are unlikely to pay significantly more than this level (perhaps only willing to spend
€30,000 to €50,000 more). As such, a large part of the new homes market will need to be at prices
close to €220,000 and not significantly more. There is also likely to be an impact on mid-level
purchasers who are trading up. The amount of money they have to spend on a new property will be
reduced, which could in turn dampen residential price inflation. Generally speaking, this is the aim of
the regulations. However, for those with good levels of equity in their existing homes, it is likely to be
less of a problem. For buyers at the very upper-end of the market (above €2m), the affect will be
more limited because this category of purchaser generally has a lot of equity/cash when buying so it
will not make a difference to them.
Dublin City Council 15Economic and Market Analysis of the Development Sector August 2015
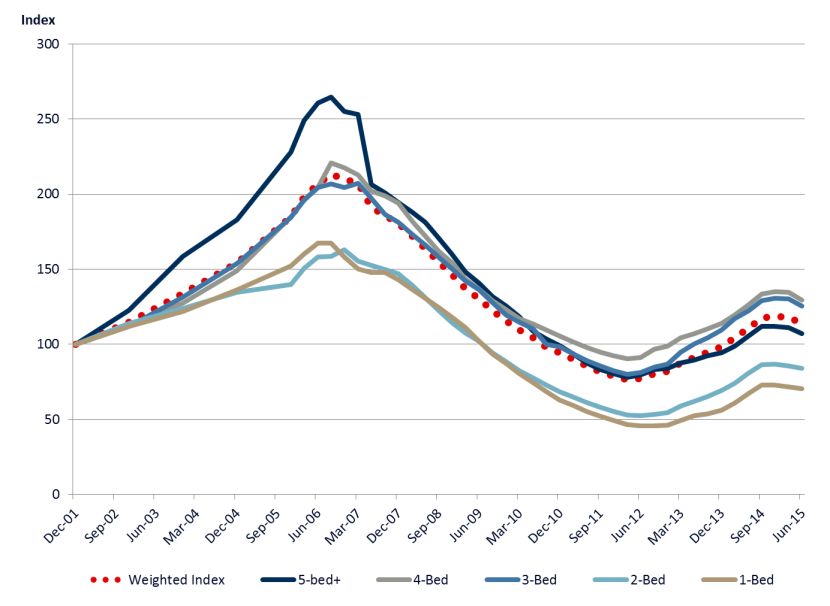
Lisney’s Residential Value Index for Dublin fell slightly over the first half of 2015 (by 3.9%) and as a
result, the annual rate of growth slowed to 2.8% to the end of June (following an annual growth rate
of 21.3% in the 12 months to the end of June 2014). It is useful to look at these price changes by way
of example. If an apartment was valued at €300,000 at the start of this year, it is now about €290,000
but was €250,000 at the start of 2014 and €195,000 at the bottom of the market in 2012.
Figure 7: Lisney Dublin Residential Value Index, Source: Lisney
The Lisney index differs from that of the CSO, which shows that over the first five months of the year,
prices fell by 0.7% and over the 12 months, prices are 15.2% higher. However, we believe that
because this index is based solely on mortgage drawdowns, there is a lag on the data and further
price falls will be seen in the coming months. But as with the Lisney index, these will be relatively
small.
Figure 8: CSO Residential Property Price Index, Source: Lisney
Affordability is a key issue in Dublin and it relates to a potential purchaser’s ability to get and then
fund a mortgage each month. There are a number of components to affordability including property
prices, mortgage interest rates and disposable income. Based on data from the CSO, average
earnings did not change over 2014 (but are likely to improve in 2015) and interest rates generally
remain at high levels for new borrowers. As such, property prices are the determining factor of
affordability at present and with the price declines over the last six months, affordability has
improved.
Dublin City Council 16Economic and Market Analysis of the Development Sector August 2015
According to the DKM EBS Affordability Index, a first time buyer couple in Dublin on average earnings
(based on the CSO’s Earnings and Labour Costs Survey with Dublin incomes assumed to be 10% higher
than buyers nationally) required 22.6% of their net income to fund a mortgage in April 2015 and June
was estimated at 22.1%. This is down from 24.3% in October 2014 (the corresponding figure for
December 2011 when the Dublin market was at its most affordable was 14.3%).
Figure 9: DKM EBS Residential Affordability Index, Source: DKM EBS Affordability Index
In the rental market, the biggest challenge remains the lack of properties to rent. The greatest
demand in the DCC area is for city centre apartments of all sizes. This demand is at an all-time high
and the market is really struggling to keep up with this pressure with most units letting at the first
viewing. As a result, many tenants are choosing to renew their leases rather than look for alternative
accommodation.
The Private Residential Tenancies Board (PRTB) Rent Index shows that Dublin rents rose by 9.6% in
the 12 months to the end of Q1 2015 with apartments (+11%) growing at a faster pace to houses
(+7%). This information cannot be broken down by Dublin sub-area but from our experience, we
believe that generally apartment rents in the DCC area have on average grown by between 10% and
12% with houses at 10%. Since the market bottomed in early 2011, the PRTB index for Dublin overall
has risen by almost 24% and remains just 8% below the peak of the market.
Figure 10: Private Residential Tenancies Board (PRTB) Rent Index – Dublin, Source: PRTB
Dublin City Council 17You can also read