An Empirical Study of Customers' Satisfaction and Repurchase Intention on Online Shopping in Vietnam
←
→
Page content transcription
If your browser does not render page correctly, please read the page content below
Lan NGUYEN, Thu Ha NGUYEN, Thi Khanh Phuong TAN / Journal of Asian Finance, Economics and Business Vol 8 No 1 (2021) 971–983                         971

Print ISSN: 2288-4637 / Online ISSN 2288-4645
doi:10.13106/jafeb.2021.vol8.no1.971

     An Empirical Study of Customers’ Satisfaction and Repurchase Intention
                        on Online Shopping in Vietnam

                                             Lan NGUYEN1, Thu Ha NGUYEN2, Thi Khanh Phuong TAN3

                              Received: October 01, 2020                  Revised: December 06, 2020 Accepted: December 14, 2020

                                                                                        Abstract
This study aims to examine the factors that affect customer satisfaction and repurchase intention of online shoppers in Vietnam. We
used the anklet method to collect information by sending the online questionnaire to Vietnamese people via social media like Facebook,
Zalo, and instructed participants to fill out the survey. This study collected data randomly from 597 Vietnamese individuals who have
experienced online shopping. Applying both qualitative and quantitative methods, we investigated the impacts of factors (responsiveness,
trust, convenience, delivery, information quality and perceived website usability) on customer satisfaction and repurchase intention. The
results revealed that: (1) Information quality, delivery, convenience, and perceived website usability have the most significant impacts on
customer satisfaction and intention, (2) Trust moderately affects satisfaction and repurchase intention, (3) Responsiveness has no significant
influence on repurchase intention and (4) Control variables, included gender and marital status also impacted satisfaction and repurchase
intention because the study found that male customers are more satisfied than female customers and single people tend to repurchase at
familiar websites more than the other people. The findings suggested that six mentioned factors have different levels of impacts on customer
satisfaction and repurchase intention; moreover, the demographic factors also affect satisfaction and intention to repurchase.

Keywords: Customer Satisfaction, Repurchase Intention, Online Shopping

JEL Classification Code: C12, C83, L83, Z32

1. Introduction                                                                                  accounting for 12 percent of global sales in 2016 (Kinda,
                                                                                                 2019). Developing in line with Asia, Vietnam online
    The noticeable development of technology has recently                                        shopping market has become more vibrant. The growth
led to accelerated growth in online shopping. Evidence on                                        rate of national e-commerce was higher than 32 percent in
e-commerce provided by the IMF shows that global retail                                          2019 and predicted to be over 30 percent this year (Vietnam
e-commerce sales rocketed from US$1.3 trillion in 2014                                           E-Commerce Association, 2020). Vietnam E-Commerce
to US$2.3 trillion in 2017 (Kinda, 2019). Besides, Asia’s                                        Association (VECOM) also predicted that our e-commerce
e-commerce retail sales surpassed the rest of the world,                                         sales in 2019 will increase to more than US$15 trillion, up
                                                                                                 10 percent in total GDP in 2020 (Vietnam E-Commerce
                                                                                                 Association, 2020). Obviously, online shopping is becoming
                                                                                                 more important in the economy. Hence, it is crucial for
 First Author and Corresponding Author. International Cooperation
1
                                                                                                 companies to know how to satisfy the customers to gain
 and Scientific Research Department, Van Lang University, Ho Chi                                 market shares and improve performance.
 Minh City, Vietnam [Postal Address: 45 Nguyen Khac Nhu Street,
 Co Giang Ward, District 1, Ho Chi Minh City, 700000, Vietnam]                                       Prior studies have revealed that customer satisfaction is
 Email: lan.ntn@vlu.edu.vn                                                                       critical to business performance (Anderson & Sullivan, 1993;
 Faculty of Planning and Development, National Economics
2
                                                                                                 Loveman, 1998; Reichheld & Teal, 1996) and customer
 University, Hanoi, Viet Nam
 Faculty of Finance, University of Economics, The University of
3                                                                                               loyalty leads to better firms’ performance (Reichheld &
 Danang, Danang, Vietnam                                                                         Teal, 1996). Regarding satisfaction, it is directly associated
                                                                                                 with firm’s financial performance (Williams & Naumann,
© Copyright: The Author(s)
This is an Open Access article distributed under the terms of the Creative Commons Attribution   2011), profits (Hallowell, 1996), and decreased operating
Non-Commercial License (https://creativecommons.org/licenses/by-nc/4.0/) which permits
unrestricted non-commercial use, distribution, and reproduction in any medium, provided the
                                                                                                 costs (Reichheld & Sasser, 1990). Satisfaction is also one
original work is properly cited.                                                                 of the primary marketing goals that the enterprise wants to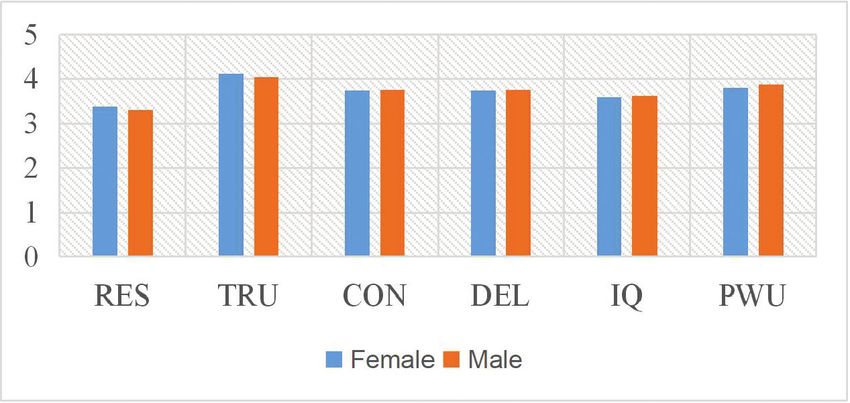
972      Lan NGUYEN, Thu Ha NGUYEN, Thi Khanh Phuong TAN / Journal of Asian Finance, Economics and Business Vol 8 No 1 (2021) 971–983

achieve (Erevelles & Leavitt, 1992). Likewise, Gruca and              correlated with profitability and competitive advantages.
Rego (2005) state that increasing customer satisfaction               This is because the more customers are satisfied, the better
will decrease cost of capital. It means that the higher               outcomes the company can achieve. These outcomes help
level of satisfaction would lead to better performance.               the company strengthen its reputation, develop its image,
Therefore, enhancing satisfaction helps organizations with            and save marketing costs (Fornell, 1992; Liao et al., 2017;
higher market value. In terms of repurchase intention, it is          Oliver, 1980).
crucial for the performance as it is one of the three forms                Besides customer satisfaction, this study also tests
of customer loyalty that contributes to an increase in profit         the correlation among factors and repurchase intention.
by boosting revenues, decreasing costs and price sensitivity          According to Copeland (1923), repurchase intention is
(Reichheld & Sasser, 1990). Chow and Holden (1997) also               defined as repeatedly purchasing goods or services over time.
demonstrated the essential role of customer loyalty in the            In other words, repurchase intention means the willingness
growth of a company.                                                  to buy again at the shop where a consumer had a purchasing
    While there are numerous studies on satisfaction and              experience previously. Repurchase intention is important
repurchase intention, not many studies identify which                 since the cost of retaining customers is much less than finding
factors affect both satisfaction and repurchase intention. Our        new customers; therefore, repeatedly buying behaviors of
research aims to fill this gap by measuring the impacts of            existing customers create more profit for companies (Chiu
the mentioned factors (responsiveness, information quality,           et al., 2009; Spreng et al.,1995; Zhang et al., 2011, Maharani
delivery, trust, convenience, perceived website usability) on         et al., 2020). When customers are retained, they are likely
satisfaction and repurchase intention in Vietnam’s online             to recommend the service to new buyers such as friends or
shopping market. We find that satisfaction is affected by             relatives, which can help firms reduce the cost of finding new
all six factors, especially information quality and delivery.         customers, leading an increase in profit (Pham & Ahammad,
The findings also reveal that trust is of least importance            2017; Ho et al., 2020).
to customer satisfaction. Regarding repurchase intention,                  In this research, we discuss customer satisfaction and
the results indicate that all factors affect retention except         repurchase intention in online shopping. As life is busier,
responsiveness. More importantly, our paper contributes to            more people tend to purchase online (Duarte et al., 2018).
current online shopping literature by proposing implications          One of the advantages of shopping online is convenience,
on improving customer satisfaction and increasing the                 which allows the consumers to purchase products anytime
chance of the customers repurchasing goods via e-commerce             and anywhere (Beauchamp & Ponder, 2010). Another
channels in Vietnam.                                                  advantage is being able to stay remote without having to
    Our paper is organized as follows. Section 2 presents             go to the physical store. Thus, convenience helps us save
a review of related studies and current theories. Section 3           time and transportation costs, and explains why people
develops hypotheses, proposes an empirical model and                  may prefer online shopping instead. Also, previous studies
describes the collected sample and analyzes the data.                 demonstrates that online convenience is the factor that
The next section reports the study results, while section 6           promotes consumer’s tendency to buy online (Jiang et al.,
discusses the findings of this study, makes recommendations           2013). Therefore, it is necessary to identify factors that
for further research and points out some drawbacks of the             affect satisfaction and retention in online shopping to build
research.                                                             a suitable business strategy, contributing to a firm’s success.
                                                                      However, most of the previous studies performed have
2. Literature Review                                                  no consensus on the factors that impact online customer
                                                                      satisfaction and retention.
    Customer satisfaction is one of the most important                     Indeed, many authors indicate that trust (security/
contributions to the success of a business. Indeed, customer          privacy) and information quality are the most important
satisfaction is defined as the difference between pre-shopping        factors, which affect satisfaction and continuance intention
expectations and post-shopping performance (Duarte et al.,            (Chiu et al., 2009; Kim & Stoel, 2004; Kim et al., 2012; Liu
2018; Jun et al., 2004; Kim & Stoel, 2004; Oliver, 1980,              et al., 2008; Wu, 2013). Others believe that responsiveness
Giao et al., 2020). Simultaneously, it appears after finishing        has a positive and very close correlation with satisfaction
a transaction, that is, once consumers have purchased their           and repurchase intention in e-commerce (Nusair &
products (Choi et al., 2013; Duarte et al., 2018; Jun et al.,         Kandampully, 2008; Pham & Ahammad, 2017; Rita et al.,
2004; Kim & Stoel, 2004; Pham, 2011). Once customers                  2019), whereas this idea is opposite to the findings of Liu et
are more satisfied with the products or services, it will help        al. (2008). Convenience is also one of the factors that has a
companies gain market shares and profitability in the future          significant effect on satisfaction and retention (Berry et al.,
(Anderson et al., 1994; Rust & Anthony, 1993). Likewise,              2002; Duarte et al., 2018; Gupta & Kim, 2007; Pham, 2011).
Liao et al. (2017) point out that satisfaction is positively          Furthermore, delivery and perceived website usability are
Lan NGUYEN, Thu Ha NGUYEN, Thi Khanh Phuong TAN / Journal of Asian Finance, Economics and Business Vol 8 No 1 (2021) 971–983 973
demonstrated to positively affect consumer satisfaction perceived website usability are referenced in several past
(Hsu et al., 2014; Khalifa & Liu, 2007; Liu et al., 2008). studies that relate to customer satisfaction and continued
Though no existing papers mention the correlation between intention (Khalifa & Liu, 2007; Lin et al., 2011; Liu et al.,
repurchase intention and delivery, we have determined that 2008; Zhang et al., 2011).
delivery is, in fact, also a factor that may impact online
retention. 3. Methodology
This research will identify the impact of six dimensions
that focus on online consumer satisfaction and repurchase 3.1. Hypotheses
intention based on literature reviews. These factors are
responsiveness, trust, convenience, delivery, information Parasuraman et al. (2005) define responsiveness as “the
quality, and perceived website usability. There are some effective ability to handle problems and returns through the
reasons why we chose these six factors to put them into the website”. Nurdani and Sandhyaduhita (2016) found that
regression models. Firstly, responsiveness is regarded as responsiveness is one dimension of the express delivery
a crucial factor repeatedly used in previous studies when service quality that is associated with online buyers’
researching online satisfaction and retention (Parasuraman satisfaction, which positively impacts the repurchase
et al., 2005; Pham & Ahammad, 2017; Rita et al., 2019; intention. In a similar vein, Pham and Ahammad (2017)
Tran et al., 2018;). Beside responsiveness, many previous examined the link between responsiveness and satisfaction
authors mention trust (security/ privacy) in their empirical of online shoppers in the UK, then they concluded that this
model as a necessary factor in the research field of online is one of the three factors in post-purchase stage that affects
satisfaction and repurchase intention (Pee et al., 2018; Pham satisfaction. Moreover, post-purchase experience is posit to
& Ahammad, 2017; Rita et al., 2019). Next, convenience have a positive impact on customers’ intention in the future
is the factor that motivates retention as it helps customers (Kotler, 1997a; Kotler, 1997b). Existing research has also
save time and decline hassle (Gupta & Kim, 2007; Hsu further found the link between responsiveness and retention
et al., 2014). Simultaneously, convenience is one of the (Pappas et al., 2014; Rose et al., 2012).
dimensions required in the model as it has a significant
impact on satisfaction (Berry et al., 2002; Duarte et al., 2018; H1: Responsiveness is positively correlated with
Pham, 2011). Finally, delivery, information quality, and customer satisfaction (repurchase intention).
Figure 1: The determinants of customer satisfaction and repurchase intention974 Lan NGUYEN, Thu Ha NGUYEN, Thi Khanh Phuong TAN / Journal of Asian Finance, Economics and Business Vol 8 No 1 (2021) 971–983
Trust is described as the belief that the trustors’ Nusair and Kandampully (2008) suggested that
expectations will be fulfilled and its vulnerabilities will be information quality includes “the amount, accuracy, and the
not exploited by trustee (Pavlou & Fygenson, 2006). Chiu form of information about the products and services offered
et al. (2009), Kim and Stoel (2004), and Kim et al. (2012) on a website”. Previous studies indicate that information
have the same idea of the direct effect of trust on satisfaction. quality strongly links to satisfaction (Kim & Stoel, 2004;
Pappas et al. (2014) also agree with the hypothesis when they Nusair & Kandampully, 2008). Likewise, DeLone and
find that trust is the second most important driver for the McLean (2003) state that higher information quality will
satisfaction of Greek online shoppers by applying structural lead to a higher level of satisfaction. Besides, satisfaction is
equation modelling (SEM) and multi-group analysis. There found to stimulate retention of consumers (Tran et al., 2018).
is also evidence of the relationship between trust and Similarly, information quality is indicated to be vital to
customer loyalty (Jarvenpaa et al., 2000; Rose et al., 2012). satisfaction; however, it is less important to satisfaction than
More importantly, some authors further found that trust is an other variables (product quality, delivery quality and system
important factor for customer loyalty (Jarvenpaa et al., 2000; quality) (Lin et al., 2011).
Rose et al., 2012).
H5: Information is positively correlated with customer
H2: Trust is positively correlated with customer satisfaction (repurchase intention).
satisfaction (repurchase intention).
Casaló et al. (2008) describe perceived website usability
Convenience includes the amount of time and effort as “the effort needed to use a computer system”. Flavián
needed to buy a product (Copeland, 1923). It is found to et al., (2006) state that perceived website usability is vital
have a positive effect on customer purchasing in Hong Kong to shopping behaviors and associated with higher level of
(Jiang et al., 2013). In a similar vein, previous studies have satisfaction after using the WAMMI scale. In this research,
found that convenience is of great importance to customer it is also indicated that usability positively affects customer
satisfaction (Duarte et al., 2018; Koo et al., 2008; Pham et loyalty and this correlation is moderated by trust and
al., 2018). In the research conducted by Jiang et al. (2013), satisfaction. It seems that there are relationships between
it is indicated that three dimensions of convenience (search, website usability, satisfaction and customer loyalty. More
transaction, possession/post purchase convenience) directly importantly, previous research examined the determinants of
affect the behavioral intentions of customers in Hongkong. website usability and then found out that website usability
Moreover, Mpinganjira (2015) provides evidence on the is one of the most important factors of website quality
impact of service convenience and future intentions, stating (Ranganathan & Ganapathy, 2002). Previous studies has also
that customers will intend to shop more if they are pleased found that usability is positively correlated with customer
by e-vendors. loyalty (Cyr, 2008).
H3: Convenience is positively correlated with customer H6: Perceived website usability is positively correlated
satisfaction (repurchase intention). with customer satisfaction (repurchase intention).
Sharma et al.(1999) stated that delivery is “the activity 3.2. Empirical Models
of providing the promised goods and services on time
to the customer”. Existing studies found that delivery Previous researches used quantitative method with
is important to customer satisfaction (Hsu et al., 2014; regression models to identify the factors impact on online
Khalifa & Liu, 2007; Liu et al., 2008) as these studies agree customer satisfaction (Duarte et al., 2018; Lin et al., 2011;
that delivery positively affects satisfaction. Having the Pham & Ahammad, 2017) and repurchase intention (Hsu
same viewpoint with those authors, Liu et al. (2008) found et al., 2014; Kim et al., 2012; Zhang et al., 2011). In this
that the influence of delivery on customer satisfaction paper, we have also build two regression models with
is in positive direction after examining the link between two dependent variables to test the relationship between
delivery and satisfaction. Previous research also supports six factors and satisfaction and repurchase retention as
the view that satisfaction strongly influences retention follow:
(Duarte et al., 2018; Khalifa & Liu, 2007) and stated that
customers will return to purchase from the same e-vendors Model 1: SAT= α
1+ β1*RES+ β2*TRU+ β3*CON
if they are more satisfied. + β4*DEL+ β5*IQ+ β6*PWU+ µ1
H4: Delivery is positively correlated with customer Model 2: REP= α2+ γ1*RES+ γ2*TRU+ γ3*CON
satisfaction (repurchase intention). + γ4*DEL + γ5*IQ+ γ6*PWU+ µ2Lan NGUYEN, Thu Ha NGUYEN, Thi Khanh Phuong TAN / Journal of Asian Finance, Economics and Business Vol 8 No 1 (2021) 971–983 975
Where: α1, β1, β2¸β3, β4, β5, β6, α2, γ1, γ2, γ3, γ4, γ5, γ6 are After the questionnaire is finished, we used the anklet
coefficients method to collect information by sending the online
µ1, µ2 are errors questionnaire randomly to Vietnamese people via social
SAT: Customer satisfaction, REP: Repurchase intention, media like Facebook, Zalo, and instructed participants to
RES: Responsiveness, TRU: Trust, CON: Convenience, fill out the survey. As a result, 652 people completed this
DEL: Delivery, IQ: Information quality, PWU: Perceived survey in 3 weeks. Next, the semi-structured interview is
Website Usability. implemented through Zoom with five random people who
participated in our survey. The purpose of the interviews is to
3.3. Data Collection and Research Method find a deeper explanation for customers’ choices in the survey
and their perceptions toward online buying in Vietnam.
Primary data has been used in this study. To collect After entering the data from Google form into Excel, we
data, we used a survey method through a questionnaire. started processing and analyzing data. Firstly, we translated
The objects of this survey are the Vietnamese inhabitants the data from Vietnamese into English. Subsequently, we
who have made online purchases at least once. About imported the data into softwares like RStudio and SPSS,
the questionnaire content, we divided it into two parts. which we used to analyze data. Next step, the software
The first part is about personality information (gender, RStudio version 4.0.2 is adopted to filter and remove
age, education level, marital status, and online shopping samples that are not valid. Those unusable samples include
frequency). However, the second part is about factors that the questionnaires that have only one answer for all the
affect online buying satisfaction and repurchase intention. individual questions. If those samples were not deleted, it
Simultaneously, we used a 5-point Likert scale for those would not ensure the reliability of the study. This is because
questions in this part, with one denoting completely disagree selecting only one answer in the survey reflects that the
and five denoting completely agree. respondents may read the questions cursorily.
Table 1: List of dependent and independent variables of the regression model
Variable Meaning Determined by Role Model
SAT Satisfaction Overall satisfaction Dependent variable SAT
REP Repurchase intention Overall repurchase intention Dependent variable REP
RES Responsiveness Quick response question Independent variable RES1
Promptly support problem Independent variable RES2
Return/Repay policy Independent variable RES3
TRU Trust Payment System Security Independent variable TRU1
Information privacy Independent variable TRU2
Third-party trust Independent variable TRU3
CON Convenience Accessibility Independent variable CON1
Ease of search Independent variable CON2
Payment methods Independent variable CON3
DEL Delivery Receive right package Independent variable DEL1
Speed of delivery Independent variable DEL2
Intactness of products Independent variable DEL3
IQ Information quality Accuracy Independent variable IQ1
Completeness Independent variable IQ2
Understandability Independent variable IQ3
Timeliness Independent variable IQ4
PWU Perceived website usability Clear website design Independent variable PWU1
Initial ease of use Independent variable PWU2
Speed of search Independent variable PWU3
Control Independent variable PWU4
Ease of navigation Independent variable PWU5976 Lan NGUYEN, Thu Ha NGUYEN, Thi Khanh Phuong TAN / Journal of Asian Finance, Economics and Business Vol 8 No 1 (2021) 971–983
Consequently, 55 samples are deleted from data, and the for females, which is lower than males by 0.07. Strikingly,
final sample size remains 597 valid responses. And finally, both convenience and delivery are scored at 3.75 for males
the software SPSS version 22 is used to test Cronbach’s alpha and 3.73 for females. Obviously, each gender has the same
which reflects the reliability of the measurement indicators. evaluation of convenience and delivery; moreover, females
Simultaneously, analyzing data by the software SPSS to test have a higher degree of convenience and delivery than their
correlation and regression in the empirical model. counterparts by 0.02.
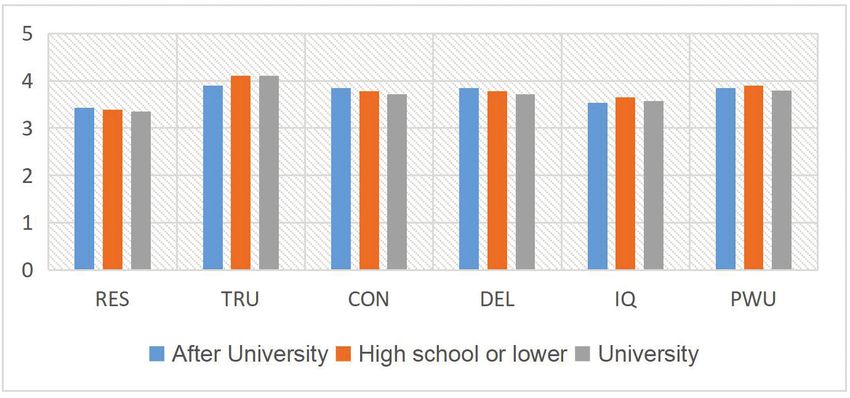
In summary, out of 597 respondents, there are 501 Figure 3 provides data on factors affecting satisfaction
females in proportion 83.92 percent; the remaining 16.08 and repurchase intention among different academic levels.
percent is male. The number of female respondents is larger Overall, the effects of mentioned dimensions vary between
than the number of surveyed men by 405, equivalent to academic levels. In the criterion of education levels, the “after
67.84 percent of the total voters. For marital status, most university” has the highest figure of responsiveness (3.43),
respondents are single, and make up 94.47 percent. However, and the “university” with the lowest level of 3.35. Similarly,
only 29 people are married, constituting a small proportion convenience amounts to 3.85 for the “after university”
of 4.85 percent. The other groups account for a total of an group, which is higher than “high school or lower” group
insignificant proportion, which is only 0.68 percent. Most and “university” group by 0.07 and 0.13 respectively. On the
survey respondents are single. Concerning education level, contrary, “after university” ranked at 3.90 in terms of trust,
there are 507 undergraduates, making up a large proportion, showing slightly lower points than the “university” group,
84.93 percent of survey’s total participants. However, the which scores at 4.11. Turning to information quality and
number of postgraduates is only 27 (4.52%), accounting for perceived website usability, the “high school or below” leads
half of the “high school or below” group’s quantity. the other groups with a score of 3.65 and 3.90 respectively.
As regards trust, the “after university” group has the lowest
4. Results points of 3.90 as against the highest point of responsiveness.
Interestingly, there are no differences between convenience
4.1. Descriptive Analysis and delivery levels as each group has the same points of
these indicators.
Figure 2 shows a comparison of the average values of six Moreover, the levels of satisfaction and repurchase
factors between males and females. The figure indicates that intention vary with customers’ gender. The surveyed
females have a higher degree of responsiveness and trust than women are less satisfied than surveyed men; however, they
males while males have higher figures for the other indicators repurchase more than their counterparts. For satisfaction,
than their counterparts. Concerning responsiveness, it is surveyed women and men have a level of nearly 3.70 and
accounted for approximately 3.37 for females, which is 3.84 correspondingly. Concerning retention, it is ranked at
slightly higher than the figure for males by 0.07. Similarly, 3.87 for females, which is higher than males by nearly 0.03.
the average point of females makes up 4.11 compared to that Interestingly, surveyed women ranked their satisfaction
of males (4.04). Concerning information quality and website higher than their retention although the gap between females’
usability, females have lower points of information quality satisfaction and retention is insignificant (only 0.17).
and website usability than males. For information quality, it Besides, males’ satisfaction is ranked at the same level as
scores at 3.58 for females, which is lower than the figure for males’ intention to repurchase (3.84). In other words, when
males by 0.04. Likewise, website usability is ranked at 3.80 a male is satisfied, he is more likely to make a repurchase.
Figure 2: A comparison of factors influencing customer satisfaction and repurchase intention between two gendersLan NGUYEN, Thu Ha NGUYEN, Thi Khanh Phuong TAN / Journal of Asian Finance, Economics and Business Vol 8 No 1 (2021) 971–983 977
Figure 3: A comparison of factors influencing customer satisfaction and repurchase intention among academic levels
4.2. Cronbach Alpha And EFA to happen among these five independent variables is high,
especially between PWU and ID, CON. However, this is
Cronbach’s alpha: The test results show that Cronbach only the prediction that we still do not know exactly whether
Alpha coefficients are higher than 0.7, indicating that the this phenomenon arises or not; moreover, we can see that
scale has the high degree of reliability. Besides, all these all the independent variables are positively correlated with
coefficients are lower than 0.95, which means that there each other.
are no variables that overlap on the scale (Nunnally, 1978).
Exploratory Factor Analysis EFA: The results of the analysis 4.4. Regression Analysis
of EFA indicate that there are five factors extracted at
Eigenvalue: 1.022. Whether the model uses the fifth factor, 4.4.1. The SAT Model
the Eigenvalue is 0.735, which is lower than 1. Basing on the
criteria of one or more, we stop at the fifth factor. Moreover, The regression analysis of the correlation between six
the total variance extracted has a value of 62.586 that is factors and customer satisfaction is presented in table 2.
higher than 50%. It shows that those five factors explain the The SAT model’s R-squared is 0.501297, indicating that
variability of the observations. From the Rotation Matrix the changes in customer satisfaction can be explained by
results, variable IQ4 is excluded from the model because it 50.1297 % of the changes of six independent variables.
loads in component 1 and component 2. This violates the With the confidence level of 95%, it can be said that ID,
distinction in the rotation matrix. Moreover, the load factor TRU, CON, PWU, GENDER, and FREQUENCY are all
in component 1 and component 2 are 0.599 and 0.356, statistically significant. By contrast, because the P-value
respectively, and the difference between these load factors is of responsiveness (RES) is 0.0648, which is higher than
0.234, less than 0.3. 0.05, RES is not statistically significant at the confidence
level of 95% but statistically significant at 90%. They
4.3. Pearson Correlation Analysis remaining factors comprising EDU, AGE, SINGLE,
DIVORCED, and MARRIED, they are not statistically
The correlation among independent variables is based significant in the regression model since their P-values
on SPSS’s result. Obviously, all the Sig values are less are larger than 0.1. It means that educational level, age,
than 0.05, and it means that independent variables correlate and marital situation is not correlated with customer
with each other. Although Pearson Correlation values are satisfaction.
different, they are generally quite high, and most of them More specifically, for those variables that are
are more than 0.4. Remarkably, the correlation between ID significantly correlated with online customer satisfaction,
and other independent variables is relatively strong since they account for a significant positivity. This result is not
the Pearson Correlation between ID and CON, PWU, only like what is expected in the hypotheses but also is
TRU, RES is 0.568; 0.666; 0.494, and 0.592, respectively. confirmed by a number of previous studies such as Duarte
Likewise, PWU with CON, TRU, RES, and TRU with et al. (2018); Hsu et al. (2014); Kim and Stoel (2004);
RES also closely correlate. It is a lower level of correlation Nusair and Kandampully (2008). Particularly, information
between CON and TRU, RES with 0.353 and 0.368. and delivery quality (ID) has the most significant impact on
Therefore, the chances for the multi-collinear phenomenon online customer satisfaction with a coefficient of 0.334211.978 Lan NGUYEN, Thu Ha NGUYEN, Thi Khanh Phuong TAN / Journal of Asian Finance, Economics and Business Vol 8 No 1 (2021) 971–983
Table 2: Regression in the SAT model
Dependent Variable: SAT
Method: Least Squares
Sample: 1 597
Included observations: 597
Variable Coefficient Std. Error t-Statistic Prob.
RES 0.069381 0.037504 1.849960 0.0648
ID 0.334211 0.051571 6.480640 0.0000
TRU 0.064512 0.027566 2.340254 0.0196
CON 0.245171 0.040029 6.124878 0.0000
PWU 0.212084 0.051265 4.137001 0.0000
GENDER 0.155143 0.063283 2.451585 0.0145
EDU -0.045890 0.068059 -0.674264 0.5004
AGE -0.003007 0.008615 -0.349052 0.7272
SINGLE 0.090563 0.197796 0.457859 0.6472
DIVORCED -0.062998 0.479224 -0.131458 0.8955
MARRIED -0.094315 0.267928 -0.352015 0.7250
FREQUENCY 0.105227 0.028044 3.752185 0.0002
R-squared 0.501297 Mean dependent var 3.726968
Adjusted R-squared 0.491920 S.D. dependent var 0.784172
SE of regression 0.558956 Akaike info criterion 1.694403
Sum squared resid 182.7725 Schwarz criterion 1.782683
Log-likelihood -493.7793 Durbin-Watson stat 1.904139
The more quickly the delivery process can take, the more online shopping is also easy for customers to compare
satisfied the customers can be. Besides information and the prices among providers and access the feedback of
delivery quality (ID), convenience (CON) also plays a previous consumers on the websites, as Trong and Khanh
crucial role in increasing online customer satisfaction with mentioned. From the interview, we can see that trust has
a coefficient of 0.245171. This result contrasts with the a less significant effect on customer satisfaction. More
findings of the research conducted by Shin et al. (2013), specifically, this can be explained that most interviewees
whereas it is the same as that of most other studies such as answered that they use the cash payment method when
Duarte et al. (2018); Berry et al. (2002). On the other hand, shopping online to avoid risks such as: leaking out privacy
trust has the lowest impact level on customer satisfaction and credit card information, receiving the wrong products,
because the coefficient is only 0.064512. Furthermore, it is or not even receiving anything.
remarkable that the gender variable’s coefficient is 0.155143, Other interviewees who use the non-cash payment
implying that male customers are more satisfied than the method via credit card indicated that the websites where
female customers. In conclusion, to increase online customer they buy products are so prestigious. For example, “This
satisfaction, online shops need to improve ID, CON, PWU, is the prestigious website in Vietnam and its security and
TRU, and RES. privacy policies are good. The voice of virtural community
In this study, besides using the quantitative method to in Vietnam is stronger and stronger, if Shoppee shares
analyze the relationship between customer satisfaction and customer information or credit card information to the third
its drivers, we also look for authenticity in some qualitative party, Shopee won’t hold the biggest market share in electric
data gathered during five interviews with five randomly commercial until now and it will be ostracized immediately.”,
chosen participants. The interviewees stated that customers Trang said. Therefore, the website’s information security
are more interested in online buying because they can and privacy policy are excellent, which is why risks are
save a lot more time than traditional buying. Furthermore, impossible.Lan NGUYEN, Thu Ha NGUYEN, Thi Khanh Phuong TAN / Journal of Asian Finance, Economics and Business Vol 8 No 1 (2021) 971–983 979
Table 3: Regression in the REP model
Dependent Variable: REP
Method: Least Squares
Sample: 1 597
Included observations: 597
Variable Coefficient Std. Error t-Statistic Prob.
RES 0.051236 0.038791 1.320841 0.1871
ID 0.162557 0.053340 3.047571 0.0024
TRU 0.083270 0.028512 2.920518 0.0036
CON 0.299900 0.041402 7.243635 0.0000
PWU 0.198477 0.053024 3.743166 0.0002
GENDER 0.003012 0.065453 0.046022 0.9633
EDU 0.052310 0.070393 0.743117 0.4577
AGE -0.004986 0.008911 -0.559520 0.5760
SINGLE 0.487302 0.204581 2.381952 0.0175
DIVORCED 0.283247 0.495662 0.571452 0.5679
MARRIED 0.435974 0.277119 1.573240 0.1162
FREQUENCY 0.127930 0.029006 4.410449 0.0000
R-squared 0.406679 Mean dependent var 3.867672
Adjusted R-squared 0.395522 S.D. dependent var 0.743592
SE of regression 0.578129 Akaike info criterion 1.761858
Sum squared resid 195.5267 Schwarz criterion 1.850138
Log-likelihood -513.9146 Durbin-Watson stat 2.041676
Besides, we identify that males are more satisfied 4.4.2. The REP Model
than females through the interview since the female often
purchases cosmetic and clothes, and they are stricter and Like the SAT model’s analysis result, table 3 below
more careful in choosing products than males. Trang said highlights the correlation between six factors and the
that she had ever bought a lipstick on Facebook, it had made repurchase intention. The REP model’s R-squared is
her lips dry and allergic. Even though the website provides 0.406679, indicating that the changes in retention can be
the product’s information completely, those products explained by 40.6679 % of the changes of six independent
depend much on women’s’ skin types. While males often variables. With the confidence level of 95%, it can be said
buy technology products, they just focus on the product’s that ID, TRU, CON, PWU, SINGLE, and FREQUENCY
features and quality. Males are willing to accept the product are all statistically significant since P values are less than
with a different form as a different color, compared to what 0.05. The remaining factors comprising RES, GENDER,
they ordered. “Sometimes, I choose the color of my goods. EDU, AGE, DIVORCED, and MARRIED, they are not
But somehow they arranged the incorrect color and sent it to statistically significant at the confidence level of both 90%,
me. But it’s ok. For me, the most important comes from the and 95% since their P-values are all larger than 0.1. It means
quality”, Duc said. Additionally, the other reason is that the that responsiveness, gender, education level, age, and marital
females are less patient than the males. In case the response status do not impact repurchase intention.
or delivery time of online retailers exceed a female’s allowed Especially, for those statistically significant variables in
time, these female customers are more likely to buy from the REP model have a positive correlation with retention.
another shop. In contrast, male customers are willing to wait This result is not only similar to what is expected in the
until receiving products. hypotheses but is also confirmed by many previous studies980 Lan NGUYEN, Thu Ha NGUYEN, Thi Khanh Phuong TAN / Journal of Asian Finance, Economics and Business Vol 8 No 1 (2021) 971–983
such as Gupta and Kim (2007); Hsu et al. (2014). According satisfaction. To be specific, the more people shop online, the
to the SAT model, ID has the highest impact on the dependent more they are satisfied. Also, females tend to be less satisfied
variable. However, according to the REP model, ID has only than males. For repurchase intention, except responsiveness,
the fourth-highest impact on retention. By contrast, SINGLE, all factors positively influences satisfaction. More
whose coefficient is 0.487302, is the factor that has the highest importantly, single is positively associated with retention. It
impact on retention, whereas this factor is not statistically means that single customers repurchase more than the other
significant in the SAT model. With coefficients of 0.2999 types of customers.
and 0.198477, CON and PWU are the second and third From the results of this study, we advise firms trading in
most significant factors that affect retention, respectively. online commodities to increase their customer satisfaction
Like the SAT model, trust is a statistically significant factor levels. Firstly, these firms should ensure the accuracy,
and has the lowest impact on the dependent variable, with understandability, completeness, and timeliness of the
a coefficient of 0.08327. However, several previous studies product information. Secondly, e-vendors should cooperate
demonstrate that trust strongly correlates with retention with prestigious delivery companies. This co-operation will
(Chiu et al., 2009; Rita et al., 2019). In conclusion, to raise be based on an agreement that delivery companies must be
repurchase intention, online shops should improve ID, CON, responsible for shipping the correct ordered product, on time,
PWU, and TRU. Moreover, online shops should focus on a and safely packaged from online trading firms to customers.
single customer group because the REP model’s result shows Thirdly, the payment methods should be expanded to include
that single people have retention more than others. the cash payment method and the non-cash payment methods
Through the interview, four out of five interviewees such as credit cards and mobile payments. Although the
believed that responsiveness does not affect their retention. study results indicate that trust has less effect on satisfaction,
These people explained that they only use prestige and consumers will be more satisfied if firms combine the
reputation websites in which the product information is diversification of payment methods with the security policy
provided accurately and completely. Thus, consumers rarely of consumer’s private information. Finally, it is necessary to
have questions or problems in the purchase process. For design a user-friendly website where customers can search
example, when asked about how responsiveness affects for the product information or move to other pages easily.
repurchase intention, Trang answered that “Shopee which I Therefore, further studies will collect many observations
am using is a prestigious website, staffs work professionally to guarantee the representativeness of the sample. Besides,
and answer promptly. Moreover, I rarely have questions or researchers should expand the sample and measure the effects
complain about products because the product information of more independent variables on customer satisfaction and
appears on the website completely with feedbacks from repurchase intention, such as price and promotion. Finally,
previous customers.”. Besides, all of the interviewees agreed the qualitative method should be implemented more in further
that being single impacts significantly affects repurchase research to explore customer satisfaction and retention.
intention. This can be explained as single people having
different spending habits from those that are in a relationship. References
As commodities are bought just for themselves, single people
are more likely to remain loyal to one shop out of laziness. Anderson, E. W., & Sullivan, M. W. (1993). The antecedents and
In comparison, those who shop for their families are consequences of customer satisfaction for firms. Marketing
more likely to purchase from various shops. People tend to Science, 12(2), 125-143. https://doi.org/10.1287/mksc.12.2.125
buy at many shops because different members comprising Anderson, E. W., Fornell, C., & Lehmann, D. R. (1994). Customer
the family unit may have individual needs and preferences. Satisfaction, Market Share, and Profitability: Findings from
Furthermore, trust has less effect on retention, which is Sweden. Journal of Marketing, 58(3), 53-66. https://doi.
similar to what is explained in the SAT model. org/10.1177/002224299405800304
Beauchamp, M. B., & Ponder, N. (2010). Perceptions of retail
5. Conclusions convenience for in-store and online shoppers. The Marketing
Management Journal, 20(1), 49-65.
In conclusion, we investigate the effects of six mentioned Berry, L. L., Seiders, K., & Grewal, D. (2002). Understanding
factors on customer satisfaction and repurchase intention. Service Convenience. Journal of Marketing, 66(3), 1-17.
We find that all factors mentioned in Hypotheses are https://doi.org/10.1509/jmkg.66.3.1.18505
positively correlated with customer satisfaction. In more Casaló, L., Flavían, C., & Liunalíu, M. (2008). The role of perceived
detail, information quality and delivery have the strongest usability, reputation, satisfaction and consumer familiarity
impacts on satisfaction. Besides, responsiveness is found to on the website loyalty formation process. Computers in
have the least effect on satisfaction. Just as responsiveness, Human Behaviour, 24(2), 325-345. https://doi.org/10.1016/j.
both frequency of online shopping and gender moderate chb.2007.01.017Lan NGUYEN, Thu Ha NGUYEN, Thi Khanh Phuong TAN / Journal of Asian Finance, Economics and Business Vol 8 No 1 (2021) 971–983 981
Chiu, C. M., Chang, C. C., Cheng, H. L., & Fang, Y. H. (2009). Ho, T., Vu, T., & Vu, H. (2020). Determinants Influencing
Determinants of customer repurchase intention in online Consumers Purchasing Intention for Sustainable Fashion:
shopping. Online Information Review, 33(4), 761-784. https:// Evidence from Ho Chi Minh City. The Journal of Asian
doi.org/10.1108/14684520910985710 Finance, Economics and Business, 7(11), 977-986. https://doi.
Choi, E. K., Wilson, A., & Fowler, D. (2013). Exploring customer org/10.13106/jafeb.2020.vol7.no11.977
experiential components and the conceptual framework Hsu, M. -H., Chang, C. -M., Chu, K. -K., & Lee, Y. -J. (2014).
of customer experience, customer satisfaction, and actual Determinants of repurchase intention in online group-buying:
behavior. Journal of Foodservice Business, 16(4), 347-358. The perspectives of DeLone & McLean IS success model and
https://doi.org/10.1080/15378020.2013.824263 trust. Computers in Human Behavior, 36, 234-245. https://doi.
Chow, S., & Holden, R. (1997). Towards an Understanding of org/10.1016/j.chb.2014.03.065
Loyalty: The Moderating Role of Trust. Journal of Managerial Jarvenpaa, S. L., Tractinsky, N., & Vitael, M. (2000). Consumer trust
Issues, 9(3), 275-298. https://doi.org/10.2307/40604148 in an Internet store. Information Technology and Management,
Copeland, M. T. (1923). Relations of consumers’ buying habits to 1, 45-71. https://doi.org/10.1023/a:1019104520776
marketing methods. Harvard Business Review, 282-289. Jiang, L., Yang, Z., & Jun, M. (2013). Measuring consumer
Cyr, D. (2008). Modeling Web Site Design Across Cultures: perceptions of online shopping convenience. Journal
Relationships to Trust, Satisfaction, and E-Loyalty. Journal of of Service Management, 24(2), 191-214. https://doi.
Management Information Systems, 24(4), 47-72. https://doi. org/10.1108/09564231311323962
org/10.2753/mis0742-1222240402 Jun, M., Yang, Z., & Kim, D. (2004). Customers’ perceptions
DeLone, W., & McLean, E. (2003). The DeLone and McLean of online retailing service quality and their satisfaction.
Model of Information Systems Success: A Ten-Year Update. International Journal of Quality & Reliability Management,
Journal of Management Information Systems, 19(4), 9-30. 21(8), 817 - 840. https://doi.org/10.1108/02656710410551728
https://doi.org/10.1080/07421222.2003.11045748 Khalifa, M., & Liu, V. (2007). Online consumer retention:
Duarte, P., Silva, S. C., & Ferreira, M. B. (2018). How convenient contingent effects of online shopping habit and online shopping
is it? Delivering online shopping convenience to enhance. experience. European Journal of Information Systems, 16(6),
Journal of Retailing and Consumer Services, 44, 161-169. 780–792. https://doi.org/10.1057/palgrave.ejis.3000711
https://doi.org/10.1016/j.jretconser.2018.06.007 Kim, C., Galliers, R. D., Shin, N., Ryoo, J. H., & Kim, J. (2012).
Erevelles, S., & Leavitt, C. (1992). A comparison of current models Factors influencing Internet shopping value and customer
of consumer satisfaction/dissatisfaction. Journal of Consumer repurchase intention. Electronic Commerce Research and
Satisfaction, Dissatisfaction and Complaining Behaviour, 5, Applications, 11(4), 374-387. https://doi.org/10.1016/j.
104-44. elerap.2012.04.002
Flavián, C., Guinalíu, M., & Gurrea, R. (2006). The role played by Kim, S., & Stoel, L. (2004). Apparel retailers:website quality
perceived usability, satisfaction and customer trust on website dimensions and satisfaction. Journal of Retailing and
loyalty. Information and Management, 43, 1-14. https://doi. Consumer Services, 11(2), 109-117. https://doi.org/10.1016/
org/10.1016/j.im.2005.01.002 s0969-6989(03)00010-9
Fornell, C. (1992). A national customer satisfaction barometer: The Kinda, T. (2019). E-commerce as a Potential New Engine for Growth
Swedish Experience. Journal of Marketing, 56(1), 6-21. https:// in Asia. IMF Working Paper. Retrieved from https://www.imf.
doi.org/10.1177/002224299205600103 org/-/media/Files/Publications/WP/2019/WPIEA2019135.ashx
Gruca, T. S., & Rego, L. L. (2005). Customer Satisfaction, Cash Koo, D. -M., Kim, J. -J., & Lee, S. -H. (2008). Personal values as
Flow and Shareholder Value. Journal of Marketing, 69(3), 115- underlying motives of shopping online. Asia Pacific Journal
130. https://doi.org/10.1509/jmkg.69.3.115.66364 of Marketing and Logistics, 20(2), 156-173. https://doi.
org/10.1108/13555850810864533
Gupta, S., & Kim, H. -W. (2007). The moderating effect of
transaction experience on the decision calculus in online Kotler, P. (1997a). Marketing Management: Analysis, Planning,
repurchase. International Journal of Electronic Commerce, Implementation, and Control. Upper Saddle River, NJ: Prentice
12(1), 127-158. https://doi.org/10.2753/jec1086-4415120105 Hall.
Giao, H., Hang, T., Son, L., Kiem, D., & Vuong, B. (2020). Tourists’ Kotler, P. (1997b). Marketing Management: Analysis, Planning,
Satisfaction towards Bao Loc City, Vietnam. The Journal of Implementation, and Control. New York, NY: Prentice Hall .
Asian Finance, Economics and Business, 7(7), 269-277. https:// Liao, C., Lin, H. N., Luo, M. M., & Chea, S. (2017). Factors
doi.org/10.13106/jafeb.2020.vol7.no7.269 influencing online shoppers’ repurchase inetentions: The roles
Hallowell, R. (1996). The relationships of customer satisfaction, of satisfaction and regret. Information & Management, 54(5),
customer loyalty, and profitability: An empirical study. 651-668. https://doi.org/10.1016/j.im.2016.12.005
International Journal of Service Industry Management, 7(4), Lin, C. C., Wu, H. Y., & Chang, Y. F. (2011). The critical
27-42. https://doi.org/10.1108/09564239610129931 factors impact on online customer satisfaction. Procedia982 Lan NGUYEN, Thu Ha NGUYEN, Thi Khanh Phuong TAN / Journal of Asian Finance, Economics and Business Vol 8 No 1 (2021) 971–983
Computer Science, 3, 276-281. https://doi.org/10.1016/j. Sustainability, 10(2), 156-170. https://doi.org/10.3390/
procs.2010.12.047 su10010156
Liu, X., He, M., Gao, F., & Xie, P. (2008). An empirical study of online Pham, T. N. (2011). Using service convenience to reduce perceived
shopping customer satisfaction in China: a holistic perspective. cost. Marketing Intelligence & Planning, 29(5), 473-487.
International Journal of Retail & Distribution Management, https://doi.org/10.1108/02634501111153683
36(11), 919-940. https://doi.org/10.1108/09590550810911683
Pham, T. S., & Ahammad, M. F. (2017). Antecedents and
Loveman, G. W. (1998). Employee satisfaction, customer loyalty, and consequences of online customer satisfaction: A holistic
financial performance: An empirical examination of the service perspective. Technological Forecasting and Social Change,
profit chain in retail banking. Journal of Service Research, 124, 332-342. https://doi.org/10.1016/j.techfore.2017.04.003
1(1), 18-31. https://doi.org/10.1177/109467059800100103
Ranganathan, C., & Ganapathy, S. (2002). Key dimensions of
Maharani, N., Helmi, A., Mulyana, A., & Hasan, M. (2020). Factors business-to-consumer web sites. Information & Management,
Influencing Purchase Intention on Private Label Products. The 39(6), 457-465. https://doi.org/10.1016/s0378-7206(01)00112-
Journal of Asian Finance, Economics and Business, 7(11), 939- 4
945. https://doi.org/10.13106/jafeb.2020.vol7.no11.939
Reichheld, F. F., & Teal, T. (1996). The loyalty effect: The Hidden
Mpinganjira, M. (2015). Online Store Service Convenience, Forces behind Growth, Profits, and Lasting Value. Boston,
Customer Satisfaction and Behavioural Intentions: A Focus MA: Harvard Business School Press.
for Utilitarian Oriented Shoppers. Journal of Economics and
Behavioral Studies, 7(1), 36-49. https://doi.org/10.22610/jebs. Reichheld, F., & Sasser, W. (1990, September/October). Zero
v7i1(j).561 effection: quality comes to service . Harvard Business Review,
68, 105-11.
Nunnally , J. C. (1978). Psychometric Theory. New York, NY:
McGraw-Hill. Rita, P., Oliveira, T., & Farisa, A. (2019). The impact of e-service
quality and customer satisfaction on customer behavior in
Nurdani, Y., & Sandhyaduhita, P. I. (October 2016). Impact of online shopping. Heliyon, 5(10). https://doi.org/10.1016/j.
Express Delivery Service Quality towards Repurchase Intention heliyon.2019.e02690
by B2C and C2B: A Case of Indonesia. 2016 International
Conference on Advanced Computer Science and Information Rose, S., Clark, M., Samouel, P., & Hair, N. (2012). Online
System (ICACSIS) (pp. 221-227). Malang, Indonesia: IEEE. Customer Experience in E-retailing: An empirical model of
Antecedents and Outcomes. Journal of Retailing, 88(2), 308-
Nusair, K., & Kandampully, J. (2008). The antecedents of 322. https://doi.org/10.1016/j.jretai.2012.03.001
customer satisfaction with online travel services: a conceptual
model. European Business Review, 20(1), 4-19. https://doi. Rust R. T., & Anthony, Z. J. (1993). Customer satisfaction, customer
org/10.1108/09555340810843663 retention, and market share. Journal of Retailing, 69(2), 193-
215., https://doi.org/10.1016/0022-4359(93)90003-2
Oliver, R. L. (1980). A congitive model of the antecedents and
consequences of satisfaction decisions. Journal of Marketing Sharma, S., Niedrich, R. W., & Dobbins, G. (1999). A Framework for
Research, 17(4), 460. https://doi.org/10.2307/3150499 Monitoring Customer Satisfaction: An Empirical Illustration.
Industrial Marketing Management, 28(3), 231–243. https://doi.
Pappas, I. O., Pateli, A. G., Giannakos, M. N., & Chrissikopoulos, org/10.1016/s0019-8501(98)00044-3
V. (2014). Moderating effects of online shopping experience on
customer satisfaction and repurchase intentions. International Shin, J. I., Chung, K. H., Oh, J. S., & Lee, C. W. (2013). The effect of
Journal of Retail & Distribution Management, 42(3), 187-204. site quality on repurchase intention in Internet shopping through
https://doi.org/10.1108/ijrdm-03-2012-0034 mediating variables: The case of university students in South
Korea. International Journal of Information Management, 33,
Parasuraman, A., Zeithaml, V. A., & Malhotra, A. (2005). E-S-QUAL
453– 463. https://doi.org/10.1016/j.ijinfomgt.2013.02.003
a multiple-item scale for assessing. Journal of Service Research,
7(3), 213-233. https://doi.org/10.1177/1094670504271156 Spreng, R. A., Harrell, G. D., & Mackoy, R. D. (1995).
Service recovery: impact on satisfaction and intentions.
Pavlou, P. A., & Fygenson, M. (2006, March). Understanding and
Journal of Services Marketing, 9(1), 15-23. https://doi.
Predicting Electronic Commerce Adoption: An Extension
org/10.1108/08876049510079853
of the Theory of. MIS Quarterly, 30(1), 115-143. https://doi.
org/10.2307/25148720 Tran, L. T., Pham, L. M., & Le, L. T. (2018). E-satisfaction and
continuance intention: The moderator role of online ratings.
Pee, L. G., Jiang, J., & Klein, G. (2018). Signaling effect of
International Journal of Hospitality, 77, 311-322. https://doi.
website usability on repurchase intention. International
org/10.1016/j.ijhm.2018.07.011
Journal of Information Management, 39, 228-241. https://doi.
org/10.2307/25148720 Vietnam E-Commerce Association. (2020). Vietnam E- Business
Pham , Q., Tran, X., Misra, S., & Maskeliunas, R. (2018). Index 2020 Report. Vietnam E-Commerce Association.
Relationship between Convenience, Perceived Value, and Williams, P., & Naumann, E. (2011). Customer satisfaction
Repurchase Intention in Online Shopping in Vietnam. and business performance: a firm-level analysis.Lan NGUYEN, Thu Ha NGUYEN, Thi Khanh Phuong TAN / Journal of Asian Finance, Economics and Business Vol 8 No 1 (2021) 971–983 983 Journal of Services Marketing, 25(1), 20-32. https://doi. Zhang, Y., Fang, Y., Wei, K. K., Ramsey, E., McCole , P., & org/10.1108/08876041111107032 Chen, H. (2011). Repurchase intention in B2C e-commerce: Wu, I. L. (2013). The antecedents of customer satisfaction and its A relationship quality perspective. Information & link to complaint intentions in online shopping: An integration Management, 48(6), 192-200. https://doi.org/10.1016/j. of justice, technology, and trust. International Journal im.2011.05.003 of Information Management, 33(1), 166-176. https://doi. org/10.1016/j.ijinfomgt.2012.09.001
You can also read