An evaluation of approaches for rare variant association analyses of binary traits in related samples - Nature
←
→
Page content transcription
If your browser does not render page correctly, please read the page content below
www.nature.com/scientificreports
OPEN An evaluation of approaches
for rare variant association
analyses of binary traits in related
samples
Ming‑Huei Chen1*, Achilleas Pitsillides2 & Qiong Yang2
Recognizing that family data provide unique advantage of identifying rare risk variants in genetic
association studies, many cohorts with related samples have gone through whole genome sequencing
in large initiatives such as the NHLBI Trans-Omics for Precision Medicine (TOPMed) program.
Analyzing rare variants poses challenges for binary traits in that some genotype categories may have
few or no observed events, causing bias and inflation in commonly used methods. Several methods
have recently been proposed to better handle rare variants while accounting for family relationship,
but their performances have not been thoroughly evaluated together. Here we compare several
existing approaches including SAIGE but not limited to related samples using simulations based on the
Framingham Heart Study samples and genotype data from Illumina HumanExome BeadChip where
rare variants are the majority. We found that logistic regression with likelihood ratio test applied
to related samples was the only approach that did not have inflated type I error rates in both single
variant test (SVT) and gene-based tests, followed by Firth logistic regression that had inflation in its
direction insensitive gene-based test at prevalence 0.01 only, applied to either related or unrelated
samples, though theoretically logistic regression and Firth logistic regression do not account for
relatedness in samples. SAIGE had inflation in SVT at prevalence 0.1 or lower and the inflation was
eliminated with a minor allele count filter of 5. As for power, there was no approach that outperformed
others consistently among all single variant tests and gene-based tests.
Family data provide a distinct advantage of detecting rare risk genetic variants associated with human traits.
One of the possible reasons for lack of reproducibility in population-based genetic studies of rare variants is
heterogeneity, that is, multiple causal rare variants are underlying the disease. Using family samples can increase
the presence of the disease predisposing alleles thus has a better chance to detect the association than using
unrelated samples.
With continuous traits, linear mixed effects model (LME) is the commonly used method for association analy-
ses with related samples implemented in popular software packages such as GCTA1, RAREMETALWORKER2,
EPACTS3, FREGAT4 (Family REGional Association Tests) and seqMeta (https://cran.r-project.org/web/packa
ges/seqMeta/index.html). These software packages use either a relationship coefficient matrix based on pedi-
gree information or a genetic/genomic relationship matrix (GRM) estimated from genotype data to account for
relatedness. Those that use a GRM (e.g. GCTA, RAREMETALWORKER, EPACTS) can additionally account for
population stratification.
For binary traits, the field is more complex possibly due to the need to deal with computational and separa-
tion issues caused by low frequencies in some genotype category and/or event outcome. The aforementioned
packages either handle an unrelated subset only, which results in power loss, or use LME and treat binary traits
as continuous for fast computing speed, which however produces uninterpretable effect estimate.
We have developed RVFam that provides tools for analyzing three types of traits: continuous, binary and
survival measured in family samples5. For binary outcomes, RVFam fits a generalized linear mixed effects model
(GLMM). Unlike LME, there is no close form solution to the maximum likelihood of GLMM, therefore binary
trait association analyses using RVFam/GLMM take more time than using LME.
1
National Heart, Lung and Blood Institute’s Framingham Heart Study, Population Sciences Branch, Division of
Intramural Research, National Heart, Lung and Blood Institute, Framingham, MA 01702, USA. 2Department of
Biostatistics, Boston University School of Public Health, Boston, MA 02118, USA. *email: ming‑huei.chen@
nih.gov
Scientific Reports | (2021) 11:3145 | https://doi.org/10.1038/s41598-021-82547-z 1
Vol.:(0123456789)
www.nature.com/scientificreports/
Additional tools for binary outcomes have emerged in recent years that tried to address the computational
and separation issues caused by low frequencies in some genotype category and/or event outcome. GMMAT
(generalized linear mixed model association test) fits GLMM with a GRM and derives a score statistic for asso-
ciation analyses which is faster than the maximum likelihood method6. However, such score statistic can be
inflated when applied to rare variants. Recently Zhou et al.7 proposed Scalable and Accurate Implementation
of Generalized mixed model (SAIGE) that uses the saddle point approximation to calibrate the distribution of
score test statistics to better handle extremely unbalanced data. It reduces computational and memory cost by
utilizing strategies such as the average information restricted maximum likelihood algorithm and replacing the
spectral decomposition with the preconditioned conjugate gradient method to solve linear systems and avoid
the need of inversing GRM.
Firth logistic r egression8,9 was proposed to resolve the separation issue by adding a penalty for sparsity on the
likelihood of a logistic regression. It has been shown that Firth logistic regression maintained a valid type I error
when applied to rare variants analyses in unrelated s amples10. Note Firth logistic regression does not account for
relatedness and population structure. However, population structure can be controlled by adjusting for principal
components of variance-standardized relationship matrix estimated using genome-wide data in association test-
ing as is also the practice of other methods which we compared in this study. Here we are interested in examining
its performance on both unrelated and family samples.
In this paper, we perform extensive simulation studies to compare RVFam, GMMAT, seqMeta, EPACTS-q.
emmax (LME treating binary traits as continuous), logistic regression with likelihood ratio test (LRT), Firth
logistic regressions and SAIGE. These approaches are population based as opposed to family based methods
such as family based association tests ( FBAT11), rare-variant transmission disequilibrium test (RV-TDT12), rare-
variant generalized disequilibrium test (RV-GDT13), and a rare-variant association test for affected sibships14.
The family based methods use within family information to control for population stratification and can be
used for association analyses of binary phenotypes measured on families. However these family-based methods
may be less powerful compared to population based methods when the latter are able to control for population
stratification through covariate adjustment. In this study, we focus on the population based methods.
Materials and methods
Existing methods. There are few software packages available for testing association between rare variants
and binary outcomes with family data. We selected RVFam, GMMAT and SAIGE designed for analyzing this
type of data. We also compared software packages designed for analyzing rare variants with unrelated samples in
the same simulations using a subset of unrelated samples from the family data—we selected seqMeta R package
and logistf R package9 implementing Firth’s logistic regression method8. We also included logistic regression
with LRT and EPACT’s q.emmax that uses LME and treats binary outcomes as continuous for comparison.
RVFam (https://cran.r-project.org/web/packages/RVFam/) is an R package/wrapper for rare variants analy-
sis with family data that can be applied to continuous, binary or survival t raits5. For binary traits, RVFam uses
GLMM with a logistic link by calling the glmer() function in lme4 R package. Users can choose a gene-based
test from either a collapsing burden t est15, a Madsen and Browning’s burden t est16 or a sum of squares (SSQ)
test17 in addition to single variant test (SVT). RVFam reports p-values from LRT except for the SSQ test that is a
chi-square test. When a convergence issue occurs in estimating the variance–covariance matrices of the random
effects in the glmer() function call (page 16 of lme4’s reference manual, https://cran.r-project.org/web/packages/
lme4/lme4.pdf), RVFam catches warning messages returned from lme4 and provides a remark. Even though
the warning messages do not necessarily imply incorrect glmer fitting, the resulting regression coefficients may
not be reliable.
GMMAT (Generalized Linear Mixed Model Association Tests, https://github.com/lin-lab/GMMAT) is an
R package that uses a logistic mixed model with a GRM to account for population substructure and relatedness
in genetic association studies of binary t raits6. GMMAT also has a component for analyzing continuous traits.
Gene-based tests including burden tests and sequence kernel association t est18 (SKAT) are available in addi-
tion to SVT. GMMAT is the component for binary traits in GENESIS (GENetic EStimation and Inference in
Structured samples, https://bioconductor.org/packages/release/bioc/html/GENESIS.html) R package available
on the Analysis Commons, a cloud-based computing platform, for National Heart, Lung, and Blood Institute’s
TOPMed project.
SAIGE, (Scalable and Accurate Implementation of GEneralized mixed model, https://github.com/weizh
ouUMICH/SAIGE), is a software implemented for efficiently controlling for unbalanced case–control ratios,
sample relatedness and population stratification for genome-wide association study (GWAS) of large sample
sizes. SAIGE uses saddle point approximation to control for case–control imbalance in a logistic mixed effects
model and reports score test results7. Advanced optimization techniques are used in SAIGE and their efficiency
is seen in its applications to UK Biobank data of 408,961 white British samples. Burden test and SKAT are also
available in SAIGE.
seqMeta (https://cran.r-project.org/web/packages/seqMeta/index.html) is an R package that can be used
for individual study analysis and meta-analysis, and it can be applied to continuous, binary and survival traits
using unrelated samples, with exception of continuous traits that can be applied to family data using LME. For
binary outcomes, seqMeta uses logistic regression. Burden tests and SKAT are implemented in addition to SVT.
Logistic regression with LRT is carried out using the glm () function in R and is denoted as GLM. Based on
RVFam’s binary traits component framework, we implemented a function for SVT and gene-based tests using
GLM. Firth logistic regression is proposed to correct asymptotic bias of maximum likelihood estimates and to
provide a solution to separation by using a penalized likelihood f unction8,9. The approach is implemented in
logistf R package (https://cran.r-project.org/web/packages/logistf). We created a function for gene-based tests
Scientific Reports | (2021) 11:3145 | https://doi.org/10.1038/s41598-021-82547-z 2
Vol:.(1234567890)www.nature.com/scientificreports/
and SVT using Firth logistic regression implemented in logistf R package based on RVFam’s binary traits compo-
nent. Theoretically both GLM and Firth logistic regression (denoted Firth test) are only applicable to unrelated
samples as they do not account for relatedness.
EMMAX (efficient mixed-model association eXpedited), is a component for analyzing continuous traits
using LME in EPACTS3 (Efficient and Parallelizable Association Container Toolbox, https://genome.sph.umich
.edu/wiki/EPACTS). Treating binary traits as continuous was seen in some GWAS literatures using popular
software that implement LME1,3,19–21. Here we used q.emmax option in EPACTS and treated binary outcomes
as continuous.
Simulation designs. We conducted two simulation studies to evaluate the performance of aforementioned
methods in terms of type I error rate and statistical power for testing genetic association.
In the first simulation study, we used the real genotypes of 246,670 Single Nucleotide Polymorphisms (SNPs)
captured on the Illumina HumanExome B eadChip22 and simulated phenotypes of 3380 Framingham Heart
Study (FHS) Offspring Cohort participants with exome chip data in 1147 pedigrees containing participants
from three generation r ecruitments23–25. The exome chip data consists of 85% rare variants defined as variants
with minor allele frequency (MAF) less than 0.01. Among the 3,380 samples, a subset of 1,868 unrelated samples
were identified. We first simulated a QTL and its linked continuous trait using the FHS sample with S OLAR26.
The QTL (MAF 0.05) explained 2% of the trait variance (genotypic mean decided by sqrt(0.02/(2 × 0.05 × 0.95))
under an additive model) and the polygenic variance proportion was set to be 25%. With prevalence (k = 0.01,
0.05, 0.1 and 0,2), genotype relative risk (GRR = 1.5) and the QTL allele frequency, we computed the probabilities
of being affected per genotype under an additive model and used them as quantiles to dichotomize simulated
continuous traits per genotype group to obtain our binary outcomes. To evaluate type I error rates, 100 replicates
of phenotype data were generated and tested for association with all exome chip variants independent of the
QTL. For power simulation, as RVFam has a survival component, we simulated a survival trait and took the
event variable as our binary trait, so we could evaluate both survival (not included in the present study) and
binary components. The survival trait was simulated to follow a Weibull distribution with shape parameter 1
(constant failure rate over time) and scale parameter that incorporated normally distributed random effects
and effects of the five selected independent ( r2 < 0.0063) QTL with various MAF from the ABO gene that con-
tained 36 variants (4 monomorphisms) in the exome chip data. The MAF, r 2 and assigned effect information of
the five QTL (exm792698, exm792721, exm792730, exm792750, and exm792745) are given in Supplementary
Table S1. The random effects were simulated using the FHS sample with SOLAR, where polygenic variance was
25% (QTL variance was 0). The prevalence was 0.2. We simulated 100 replicates to assess statistical power. Both
SVT and gene-based tests were conducted for all considered approaches. For gene-based tests, MAF ranges of
(0, 0.01) and (0, 0.05) were used to select SNPs. We used T1/T5, SSQ1/SSQ5 and SKAT1/SKAT5 to denote the
three gene-based tests with MAF range 0.01/0.05, Li and Leal 2008’s collapsing/burden test, Pan 2009’s SSQ test
and SKAT, respectively. Note the burden test implemented in all methods use a variant weight of 1, SSQ and
SKAT use a variant weight of beta(1,25). The Bonferroni corrected genome-wide significant threshold was set as
0.05/246,670 = 2.027E−7 and 0.05/26,651 = 1.876E−6 for SVT and gene-based tests, respectively.
In the second simulation study, we were interested in evaluating the type I error rates of SVT using simulated
genotypes and phenotypes based on the same FHS samples. We simulated dichotomized traits similarly as in
the first study with two differences: (i) polygenic variance was additionally set to 50%, (ii) a SNP independent
of the QTL was simulated to have MAF of 0.0001, 0.0005, 0.001, 0.005, 0.01, 0.05, 0.1 and 0.3, and was tested to
estimate type I error rates. That is, we have polygenic variance (vg) at 0.25 and 0.5, prevalence (k) at 0.01, 0.05,
0.1 and 0.2, and MAF (p) at 0.0001, 0.0005, 0.001, 0.005, 0.01, 0.05, 0.1 and 0.3, 64 scenarios in total and 10,000
replicates for each scenario. Thus, each vg has 32 scenarios (4 k’s and 8 p’s), each k has 16 scenarios (2 vg’s and 8
p’s) and each p has 8 scenarios (2 vg’s and 4 k’s). Type I error rates were evaluated at significance levels of, 0.05,
0.001 and 5E−6. An inflated type I error rate was claimed when a type I error rate estimate was greater than
significance level inferred by a one-sided proportion test.
In both simulation studies, all methods including GLM and Firth test were applied to related samples, except
for seqMeta. Firth test was also applied to unrelated samples. All analyses and figures were conducted or produced
using the R language and environment27.
Results
First simulation study. Table 1 presents the type I error rate results. Type I error rate was computed by
total number of SNPs/genes that passed genome-wide significance threshold in 100 replicates divided by total
number of SNPs/genes in 100 replicates, which has been calibrated by dividing the significance threshold. A
value greater than 1 in Table 1 indicates inflation.
GLM had the best performance on controlling type I error rates in both SVT and gene-based tests as no
inflation was observed, followed by Firth tests that had slight inflation observed only in SSQ1 and SSQ5 at preva-
lence 0.01, SAIGE that had inflation only in SVT at prevalence 0.1 or lower, and then RVFam that had inflation
in both SVT and gene-based tests only at prevalence 0.01. GMMAT, q.emmax and SeqMeta all had inflation
across all scenarios in both SVT and gene-based tests. In general, type I error rates increased when prevalence
decreased for methods with inflations. It was interesting that no inflation was also observed in GLM and Firth
test applied to related samples and that SSQ tests applied to related samples had less inflation than applied to
unrelated samples in Firth test.
As the majority of the exome chip data are rare variants, we applied two minor allele account (MAC) filters to
exclude rare variants with MAC not greater than 5 and 10 to see whether this could eliminate the inflated type I
error rates in SVT. Table 2 shows that inflation was eliminated for SAIGE only but remained for other approaches
Scientific Reports | (2021) 11:3145 | https://doi.org/10.1038/s41598-021-82547-z 3
Vol.:(0123456789)www.nature.com/scientificreports/
RVFam GMMAT Firth
Prevalence SVT T1 SSQ1 T5 SSQ5 SVT T1 SKAT1 T5 SKAT5 SVT T1 SSQ1 T5 SSQ5
0.01 11,478.2 2138.8 11,478.2 2138.8 4550.8 7618.4 843 1582 2431 2294.8 0.4 0.2 109.8 0.2 100.4
0.05 0.4 0.8 0.4 0.8 0.4 937.6 154.4 266.6 121.8 201.4 0.6 0.6 0.6 0.2 0.6
0.1 0.4 0.2 0.4 0.2 0 127.6 31.2 46.4 23.2 34.4 0.6 0.8 0.2 0.6 0.2
0.2 0 0.4 0 0.4 0.2 2.2 2 3.2 1.6 2.8 0 0.2 0 0.2 0
q.emmax seqMeta (unrelated) Firth (unrelated)
Prevalence SVT T1 SKAT1 T5 SKAT5 SVT T1 SKAT1 T5 SKAT5 SVT T1 SSQ1 T5 SSQ5
0.01 7923.2 1536.6 3447.8 1258.2 2611.8 19,126.4 2242.6 5155.6 1774.8 3752.4 0.2 0.8 242 0.8 225
0.05 562.8 195.4 332.2 159.6 257.2 1487.6 342 566.2 266.6 422.6 0.4 1 0.4 0.6 0.6
0.1 182.8 37 53.4 29.4 41.2 138.2 50.6 75.2 40.8 56.2 0 0.2 0 0.4 0
0.2 2.6 1.8 4 1.8 3.2 1.4 3 3.2 2.4 3 0 0.2 0 0.6 0
SAIGE GLM
Prevalence SVT T1 SKAT1 T5 SKAT5 SVT T1 SSQ1 T5 SSQ5
0.01 1489.4 0 0.2 0 0.2 0 0 0 0 0
0.05 6109.2 0.4 0.6 0.2 0.6 0.4 0.4 0.4 0.2 0.4
0.1 1021.8 0.2 0 0 0.2 0.4 0.2 0 0.2 0
0.2 0 0.4 0.6 0.2 0.8 0 0.4 0.2 0.4 0.2
Table 1. Calibrated type I error rate (Type I error rate was computed by total number of SNPs/genes that
passed genome-wide significance threshold in 100 replicates divided by total SNPs/genes in 100 replicates,
which has been calibrated by dividing the significance threshold. A value greater than 1 indicates inflation) of
the first simulation study. Genome-wide significance level for single variant tests (SVT) = 2.027E−7; for gene-
based tests = 1.876E−6. Methods with “unrelated” are those applied to unrelated samples, all other approaches
were applied to related samples. T1/T5, SSQ1/SSQ5 and SKAT1/SKAT5 denote the three gene-based tests with
MAF threshold 0.01/0.05, collapsing/burden test, sum of squares test and SKAT, respectively.
with inflated type I error rates. We generated QQ plots (Fig. 1) arbitrarily using results of the first replicate simu-
lated data for evaluating type I error rates at each prevalence (0.01, 0.05, 0.1 and 0.2). Genomic inflation factor28
(λ) estimates were presented in the legend of each QQ plot. Dash line represents the genome-wide significance
level for SVT, points above this line represent false positives. SeqMeta, GMMAT and q.emmax identified many
false positives at prevalence 0.01, 0.05 and 0.1. SAIGE identified several rare variant (MAC < 3) false signals at
prevalence 0.01 with very small p-values that were replaced by 1E-45 for better presentation. At prevalence 0.05,
GLM, RVFam, Firth test and SAIGE identified one false positive each. No false positive was detected at prevalence
0.2. Firth (unrelated) test did not identify any false positive. The results agreed with Table 1 in general. In terms
of λ, interestingly, the estimates of Firth tests’ decreased from > 3 to < 0.64 as prevalence increased from 0.01 to
0.2, while the trend was opposite for other approaches.
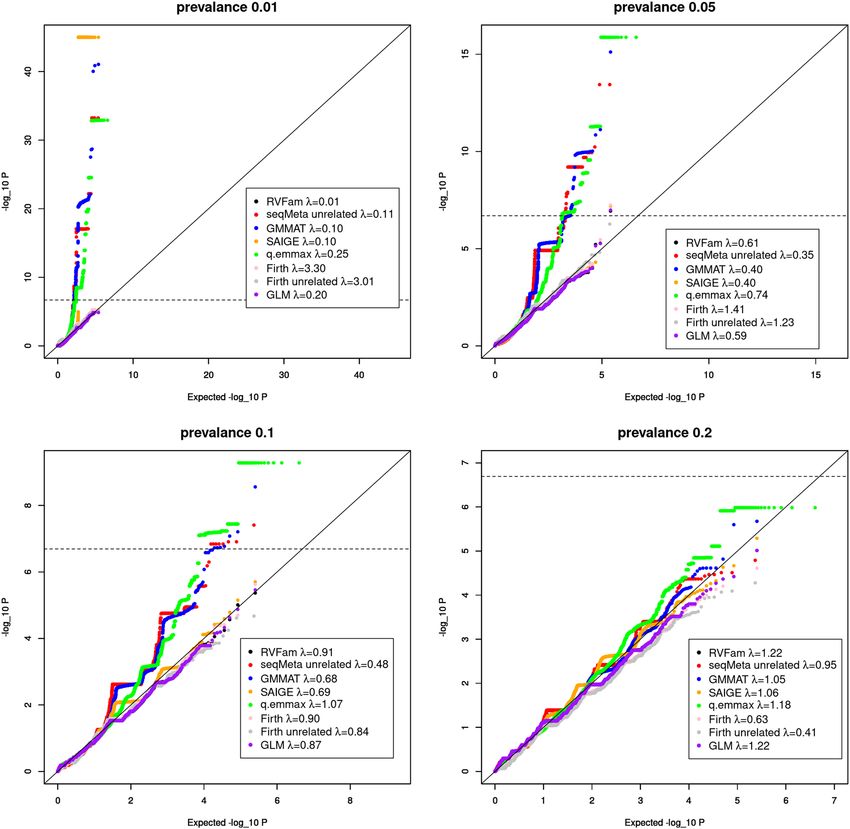
We further computed λ in SVT of all replicates at each prevalence for each approach and then made average
λ versus prevalence plots (Fig. 2). When no MAC filter was applied (top left panel), the plot essentially presents
λ estimates similar to what were reported in Fig. 1 legends. The genomic inflation factor λ evaluates the medium
of the test statistic distribution compared to that of the expected under the null hypothesis of no association. It
is relevant because for example in meta analyses where moderate test statistic values from multiple studies are
cumulated, and high λ values in some studies may result in inflation in overall summary statistics. The plots
show Firth tests had opposite trend compared to others. At low prevalence (0.01 and 0.05) and no MAC filter,
all approaches had low λ estimates except for Firth tests. In this case, genomic control c orrection28 may need to
be applied to correct for inflation observed in Firth tests, which may result in a lower power for variants with
p-values at the tail of the distribution. As rare variants are the dominant majority in exome chip data, one may
apply the correction to rare variants only. When either MAC filter was applied, unlike other approaches that had
fluctuating λ estimates at different prevalences, GLM had stable λ estimates very close to 1.
Table 3 presents the power results. Obviously approaches applied to the whole 3,380 samples had better power
than approaches applied to the unrelated subset, and gene-based tests had better power than SVT for the rare
variants. T1 had better power than T5 because three rare QTL of the same effect direction were selected in T1
and T5 further included a QTL with different effect direction that weakened the total effect and the association of
ABO gene. As SSQ and SKAT tests are effect direction insensitive, we expect SSQ5/SKAT5 to have better power
than SSQ1/SKAT1, which can be seen in GLM, RVFam, SAIGE and Firth tests, however, not in other approaches.
There was no approach that consistently outperformed others in all scenarios. We particularly compared GLM,
SAIGE and Firth test applied to related samples. For SVT, GLM and Firth test had better power in identifying
the common QTL exm792745, while SAIGE had slightly better power in detecting the rare variant exm792721.
For gene-based tests, GLM’s SSQ1/5 had better power in detecting ABO gene than Firth test and SAIGE, while
Firth test and SAIGE had slightly better power in T1 than GLM.
Figure 3 presents boxplots of regression coefficient (beta) estimates of the five QTL from all methods (except
for q.emmax) and Supplementary Table S2 presents their averages and standard deviations. For RVFam in
Supplementary Table S2, we reported results of all 100 replicates (4th column) and results of replicates without
Scientific Reports | (2021) 11:3145 | https://doi.org/10.1038/s41598-021-82547-z 4
Vol:.(1234567890)www.nature.com/scientificreports/
convergence remark (5th column). The convergence issues occurred to rare variants exm792721 and exm792698
and that led to very biased beta estimates. Excluding results with convergence issues, the biases were reduced (5th
column). First of all, Firth test applied to related samples consistently had the best precision (smallest standard
deviation of effect estimates). For exm792698 (MAF 0.00012, true beta 4.8), GMMAT gave the closest estimate,
followed by seqMeta, Firth tests, GLM and RVFam. For exm792721 (MAF 0.00104, true beta 3.0), Firth tests gave
the closest estimate, followed by GMMAT, seqMeta, GLM and RVFam. While for the other three QTL, RVFam’s
were closest to the true beta values, followed by GLM, Firth tests, seqMeta, GMMAT and SAIGE. Estimates
from GMMAT and SAIGE were quite similar. Without excluding results with convergence issues, estimates from
RVFam and GLM were also similar.
We also compared computing efficiency for approaches applied to related samples using a Linux Centos 6.6
cluster with a 2 ten-core 2.6 GHz Intel Xeon E5-2660v3 processor and 256 Gigabytes memory. We used a rep-
licate of simulated data with prevalence 0.2 used in assessing type I error rates in the first simulation study and
analyzed chromosome 1 only for SVT and gene-based tests with MAF threshold of 0.05. With a single thread,
GLM, Firth test, SAIGE, GMMAT and RVFam took 9.13, 21.15, 15.6, 18.12, and 52.1 minutes.
Even though GLM outperformed other methods in maintaining correct type I error rates and computation
efficiency, its biased effect estimate in rare variants can lead to biased results in the popular fixed effect meta-
analysis. As Firth test was proposed to correct bias, we sought to replace GLM with Firth test in SVT for variants
with some MAC threshold. We first computed mean of the effect estimate and its standard deviation of GLM
and Firth test applied to related samples with MAC thresholds of 5 and 10 (Supplementary Table S3) using all
replicates from the first simulation study evaluating type I error rates (where true effect was zero). We wanted
to find a MAC threshold so that the GLM estimates of variants with MAC greater than the threshold were rea-
sonably close to Firth test’s. The results showed that variants with MAC > 10 still showed differences between
GLM and Firth test. We then tried MAC filters in disease samples (MAC.d) of 1, 2, and 3. The means were much
closer to 0 and the standard deviations were smaller. We found MAC.d filter of 2 would be a good threshold as
the means from GLM were even closer to 0 than from Firth test and the standard deviations were reasonably
close to Firth test’s. The hybrid strategy that uses GLM for variants with MAC.d > 2 and Firth test otherwise,
significantly reduced bias in effect estimation while keeping correct type I error rates and similar power in SVT.
Second simulation study. Table 4 summarizes the results of the second simulation study. Numbers in the
table indicate the number of scenarios with inflated type I error rates, i.e. false positive rates greater than level
of significance inferred by a one-sided test. At significance level 0.05 (Table 4, α1), unlike the first simulation
study where inflation increased when prevalence decreased in most approaches (except for Firth tests that had
no inflation), no such trend was observed in all methods. No inflation was seen at MAF 0.0001 in all methods.
RVFam and GLM had the same number of scenarios with inflation and did not have inflation at MAF ≤ 0.001,
Firth test applied to unrelated samples did not have inflation at MAF ≤ 0.005. Firth test applied to unrelated sam-
ples, q.emmax and SAIGE had the least scenarios with inflation, while RVFam and GLM had the most scenarios
with inflation (23/64).
At significance level 0.001 (Table 4, α2), the observation of inflation increased when prevalence decreased
was seen in GMMAT, seqMeta and Firth test applied to unrelated samples. RVFam, GLM, both Firth tests and
SAIGE had better control on type I error rates compared to GMMAT, seqMeta and q.emmax. RVFam and GLM
again had the same number of scenarios with inflation.
At significance level 5E−6 (Bonferroni correction, Table 4, α3), GLM was the only approach that had no
scenario with inflation. In general, more scenarios with inflation were identified when prevalence decreased
(as observed in the first simulation study). The observation contradicted results in Table 4 at significance level
of 0.05 (α1). Again, RVFam, both Firth tests and SAIGE had better control on type I error rates compared to
GMMAT, seqMeta and q.emmax.
Overall, more scenarios with inflation were seen at polygenic variance 50% compared to polygenic variance
25%, no matter which significance level was used. GMMAT, seqMeta and q.emmax had more scenarios with
inflation compared to others at α2 and α3, while RVFam, GLM and Firth test applied to related samples had less
scenarios with inflation when significance level was more stringent. The number of scenarios with inflation for
SAIGE and Firth test applied to unrelated samples seemed stable and less than other approaches’, except for GLM
at α3 that had no scenario with inflation.
Discussion
In this paper we presented results of two simulation studies that compared several existing methods for rare vari-
ants association analysis of binary outcomes with family data. The first simulation study used exome chip data
and simulated binary outcomes to mimic a whole genome study where rare variants are the dominant majority.
GLM is the only approach that had no inflated type I error rates for both SVT and gene-based tests. Firth tests
applied to either related or unrelated samples had inflated type I error rates only for SSQ1/5 at prevalence 0.01.
Firth test is also implemented in EPACTS, however no gene-based Firth test has been implemented. We also
applied Firth test in EPACTS for SVT of the first simulation study using unrelated samples, the results are quite
similar to ours. SAIGE had inflation only in SVT but the inflation was eliminated with a MAC filter of 5.
RVFam reports a remark when lme4 generates convergence warnings (in estimating variance–covariance
matrices of random effects) that are not necessarily due to incorrect fitting. However, Fig. 3 and Supplementary
Table S2 show that convergence failures lead to biased beta estimates for the two rarest QTL in our power analysis.
In addition, lme4’s reference manual also reports that the warnings tend to occur with large datasets (number
of observations greater than 100,000 approximately). When a genome-wide significant signal is identified with
a remark by RVFam, we suggest users follow necessary steps recommended by lme4 authors/maintainers to
Scientific Reports | (2021) 11:3145 | https://doi.org/10.1038/s41598-021-82547-z 5
Vol.:(0123456789)www.nature.com/scientificreports/
seqMeta
RVFam GMMAT Firth q.emmax (unrelated) Firth (unrelated) SAIGE GLM
Prevalence MAC5 MAC10 MAC5 MAC10 MAC5 MAC10 MAC5 MAC10 MAC5 MAC10 MAC5 MAC10 MAC5 MAC10 MAC5 MAC10
0.01 9560.2 8219.6 675.8 296 0.2 0.2 1912.6 828.8 5863.2 1561.8 0 0 0 0 0 0
0.05 0.4 0.2 213.6 44.6 0.6 0.4 274.8 56.4 545.2 157.6 0.4 0.2 0.4 0.2 0.4 0.2
0.1 0.4 0.4 45.4 11.8 0.6 0.6 61 14.2 95 30.6 0 0 0.4 0.4 0.2 0.2
0.2 0 0 2.2 1.4 0 0 2.6 1.4 1.4 1.2 0 0 0 0 0 0
Table 2. Estimated type I error rates (Type I error rate was computed by total number of SNPs that passed
genome-wide significance threshold in 100 replicates divided by total SNPs in 100 replicates, which has been
calibrated by dividing the significance threshold. A value greater than 1 indicates inflation) after applying MAC
filters of 5 and 10 in single variant tests (SVT) of the first simulation study. Genome-wide significance level:
SVT = 2.027E−7. Methods with “unrelated” are those applied to unrelated samples, all other approaches were
applied to related samples.
Figure 1. QQ plots of replicate 1 for assessing Type I error inflation in single variant tests (SVT) of the first
simulation study.
evaluate and resolve the warnings. One can also use GLM or Firth test to check given that both methods had
the correct type I error rates in our simulations. In the two simulation studies for evaluating type I error rates,
RVFam results were assessed without excluding those with a remark. If we exclude those with a remark, the
type I error rates will improve. While in the power simulation, power was evaluated with remark being ignored
(Table 3). However, this did not impact the estimated power, as the warnings occurred mostly in the two rarest
Scientific Reports | (2021) 11:3145 | https://doi.org/10.1038/s41598-021-82547-z 6
Vol:.(1234567890)www.nature.com/scientificreports/
Figure 2. Plot of average genomic control parameter (λ) estimate from 100 replicates versus prevalence k in the
first simulation study for evaluating type I error rates in SVT without minor allele count (MAC) filter (top left),
with MAC5 filter (top right) and with MAC10 filter (bottom left).
SVT power (%) Gene-based test power (%)
Method exm792698 exm792721 exm792730 exm792745 exm792750 T1 SSQ1/SKAT1 T5 SSQ5/SKAT5
RVFam 0 0 10 71 1 33 38 0 66
GMMAT 0 12 32 63 0 57 60 0 39
q.emmax 0 20 32 63 0 59 65 0 38
Firth (unre-
0 0 1 15 0 9 11 0 19
lated)
Firth 0 0 13 72 1 37 29 0 55
seqMeta (unre-
0 20 5 10 0 24 28 0 3
lated)
SAIGE 0 3 12 61 0 37 37 0 38
GLM 0 0 12 72 1 35 41 0 68
Table 3. Power analysis results of the first simulation study. Methods in bold are those not having severe
inflation in type I error study and thus whose power can be compared together. Genome-wide significance
level for single variant tests (SVT) = 2.027E−7; for Gene-based tests = 1.876E−6. Methods with “unrelated” are
those applied to unrelated samples, all other approaches were applied to related samples. T1/T5, SSQ1/SSQ5
and SKAT1/SKAT5 denote the three gene-based tests with MAF threshold 0.01/0.05, collapsing/burden test,
sum of squares test and SKAT, respectively.
Scientific Reports | (2021) 11:3145 | https://doi.org/10.1038/s41598-021-82547-z 7
Vol.:(0123456789)www.nature.com/scientificreports/
Figure 3. Box plots of beta estimates of the five selected QTL from power analysis of the first simulation study.
QTL with 0 power to detect them. In Supplementary Table S2, we presented results with or without excluding
variants with a remark for contrast. Excluding those with a remark did bring the regression coefficient estimates
closer to the true values for the two rarest QTL.
Scientific Reports | (2021) 11:3145 | https://doi.org/10.1038/s41598-021-82547-z 8
Vol:.(1234567890)www.nature.com/scientificreports/
SeqMeta
RVFam GMMAT (unrelated) Firth Firth (unrelated) q.emmax SAIGE GLM
α1 α2 α3 α1 α2 α3 α1 α2 α3 α1 α2 α3 α1 α2 α3 α1 α2 α3 α1 α2 α3 α1 α2 α3
vg = 0.25 10 2 1 6 20 16 7 19 17 7 3 1 1 4 1 3 16 15 3 0 0 10 2 0
vg = 0.50 13 4 1 7 21 15 8 20 18 9 6 0 5 3 1 2 22 20 2 3 4 13 4 0
k = 0.01 1 1 2 2 13 12 3 14 12 3 4 1 2 4 1 2 12 12 2 0 0 1 1 0
k = 0.05 4 0 0 4 10 11 5 11 10 1 3 0 0 3 0 0 8 10 0 1 1 4 0 0
k = 0.1 9 1 0 1 10 7 0 8 12 5 0 0 1 0 1 1 10 9 1 0 0 9 1 0
k = 0.2 9 4 0 6 8 1 7 6 1 7 2 0 3 0 0 2 8 4 2 2 3 9 4 0
p = 0.0001 0 0 0 0 6 5 0 4 6 0 2 0 0 1 0 0 3 5 0 0 0 0 0 0
p = 0.0005 0 0 0 4 8 6 4 7 6 1 3 0 0 2 0 0 8 5 0 0 0 0 0 0
p = 0.001 0 0 0 4 8 7 4 8 7 2 2 0 0 3 0 2 8 7 2 0 0 0 0 0
p = 0.005 6 2 0 0 8 6 1 8 6 1 1 1 0 1 0 0 7 7 0 0 0 6 2 0
p = 0.01 6 1 2 0 6 4 3 7 6 1 0 0 4 0 0 0 7 5 0 0 2 6 1 0
p = 0.05 3 0 0 2 2 2 0 2 2 4 0 0 0 0 0 0 3 5 0 2 1 3 0 0
p = 0.1 4 2 0 1 2 1 1 3 1 3 0 0 1 0 1 2 1 1 2 1 1 4 2 0
p = 0.3 4 1 0 2 1 0 2 0 1 4 1 0 1 0 1 1 1 0 1 0 0 4 1 0
Table 4. Type I error results of the second simulation study. Level of significance is 0.05 (α1), 0.001 (α2) and
5E-6 (α3). Numbers in the table indicate the number of scenarios with inflated type I error rates, i.e. false
positive rates greater than level of significance inferred by a one-sided test. Methods with “unrelated” are those
applied to unrelated samples, all other approaches were applied to related samples. We considered polygenic
variance (vg) at 0.25 and 0.5, prevalence (k) at 0.01, 0.05, 0.1 and 0.2, and MAF (p) at 0.0001, 0.0005, 0.001,
0.005, 0.01, 0.05, 0.1 and 0.3, 64 scenarios in total and 10,000 replicates for each scenario. Thus, each vg has 32
scenarios (4 k’s and 8 p’s), each k has 16 scenarios (2 vg’s and 8 p’s) and each p has 8 scenarios (2 vg’s and 4 k’s).
The second simulation study demonstrates that for SVT at Bonferroni correction threshold, GLM did not
identify any false positives and thus had 0 scenario with inflation, followed by Firth test applied to related sam-
ples (1 scenario with inflation), Firth test applied to unrelated samples and RVFam (each with 2 scenarios with
inflation) and then SAIGE (4 scenarios with inflation).
Based on our simulation results, we recommend a hybrid strategy that uses GLM for gene-based tests and
variants with MAC.d > 2 and Firth test otherwise in SVT for rare variant association analyses of binary outcomes
with unrelated samples or family data. This strategy provided correct type I error rates, least biased effect estima-
tion, good power and computation efficiency without necessity of filtering out variants. Even though theoreti-
cally GLM and Firth test do not account for relatedness in samples, our simulation results showed that they
outperformed other approaches like RVFam, GMMAT and SAIGE that account for relatedness in controlling
type I error rates when applied to related samples. We think this may be due to (i) the use of LRT, (ii) the fact that
the familial correlation of complex binary outcomes is weaker than continuous traits’, and (iii) an appropriate
genome-wide significance is used. In the case of population stratification, one can adjust for genetic principal
components in association testing.
Our study evaluates the statistical performance of approaches applied to binary trait GWAS with family data
using exome chip data from the FHS. We believe our results can be generalized to similar datasets. However
there are limitations. First, we considered only population based methods that do not adjust for ascertainments,
so they may be subject to ascertainment bias if the families were collected from proband(s) instead of randomly
sampled, e.g. in cohort studies where sample collection does not depend on the disease status of other family
members. Second, there are scenarios that were not considered in the study, e.g. rarer diseases (prevalence less
than 0.01). So we could not assess e.g. whether GLM still have correct type I error rates for rarer diseases that
can be considered for much larger sample sizes. In addition, it’s also likely that SAIGE and the hybrid strategy
will need a larger MAC/MAC.d filter to avoid false positives.
Received: 20 February 2020; Accepted: 20 January 2021
References
1. Yang, J. et al. GCTA: A tool for genome-wide complex trait analysis. Am. J. Hum. Genet. 88, 76–82 (2011).
2. Feng, S. et al. RAREMETAL: Fast and powerful meta-analysis for rare variants. Bioinformatics 30, 2828–2829 (2014).
3. Kang, H. M. et al. Variance component model to account for sample structure in genome-wide association studies. Nat. Genet.
42, 348–354 (2010).
4. Belonogova, N. M., Svishcheva, G. R. & Axenovich, T. I. FREGAT: An R package for region-based association analysis. Bioinfor-
matics 32, 2392–2393 (2016).
5. Chen, M.-H. & Yang, Q. RVFam: An R package for rare variant association analysis with family data. Bioinformatics 32, 624–626
(2016).
6. Chen, H. et al. Control for population structure and relatedness for binary traits in genetic association studies via logistic mixed
models. Am. J. Hum. Genet. 98, 653–666 (2016).
Scientific Reports | (2021) 11:3145 | https://doi.org/10.1038/s41598-021-82547-z 9
Vol.:(0123456789)www.nature.com/scientificreports/
7. Zhou, W. et al. Efficiently controlling for case-control imbalance and sample relatedness in large-scale genetic association studies.
Nat. Genet. 50, 1335–1341 (2018).
8. Firth, D. Bias reduction of maximum likelihood estimates. Biometrika 80, 27–38 (1993).
9. Heinze, G. & Schemper, M. A solution to the problem of separation in logistic regression. Stat. Med. 21, 2409–2419 (2002).
10. Ma, C. et al. Recommended joint and meta-analysis strategies for case-control association testing of single low-count variants.
Genet. Epidemiol. 37, 539–550 (2013).
11. Rabinowitz, D. & Laird, N. A unified approach to adjusting association tests for population admixture with arbitrary pedigree
structure and arbitrary missing marker information. Hum Hered. 50, 211–223 (2000).
12. He, Z. et al. Rare-variant extensions of the transmission disequilibrium test: Application to autism exome sequence data. Am J
Hum Genet. 94, 33–46 (2014).
13. He, Z. et al. The rare-variant generalized disequilibrium test for association analysis of nuclear and extended pedigrees with
application to alzheimer disease WGS data. Am. J. Hum. Genet. 100, 193–204 (2017).
14. Epstein, M. P. et al. A statistical approach for rare-variant association testing in affected sibships. Am. J. Hum. Genet. 96, 543–554
(2015).
15. Li, B. & Leal, S. M. Methods for detecting associations with rare variants for common diseases: Application to analysis of sequence
data. Am. J. Hum. Genet. 83, 311–321 (2008).
16. Madsen, B. E. & Browning, S. R. A groupwise association test for rare mutations using a weighted sum statistic. PLoS Genet. 5,
e1000384 (2009).
17. Pan, W. Asymptotic tests of association with multiple SNPs in linkage disequilibrium. Genet. Epidemiol. 33, 497–507 (2009).
18. Wu, M. C. et al. Rare-variant association testing for sequencing data with the sequence kernel association test. Am. J. Hum. Genet.
89, 82–93 (2011).
19. Lippert, C. et al. FaST linear mixed models for genome-wide association studies. Nat. Methods. 8, 833–835 (2011).
20. Zhou, X. & Stephens, M. Genome-wide efficient mixed-model analysis for association studies. Nat. Genet. 44, 821–824 (2012).
21. Loh, P. R. et al. Efficient Bayesian mixed-model analysis increases association power in large cohorts. Nat. Genet. 47, 284–290
(2015).
22. Peloso, G. M. et al. Association of low-frequency and rare coding-sequence variants with blood lipids and coronary heart disease
in 56000 whites and blacks. Am. J. Hum. Genet. 94, 223–232 (2014).
23. Dawber, T. R. et al. An approach to longitudinal studies in a community: The Framingham Study. Ann. N. Y. Acad. Sci. 107, 539–556
(1963).
24. Feinleib, M. et al. The Framingham offspring study. Design and preliminary data. Prev. Med. 4, 518–525 (1975).
25. Splansky, G. L. et al. The Third Generation Cohort of the National Heart, Lung, and Blood Institute’s Framingham Heart Study:
design, recruitment, and initial examination. Am. J. Epidemiol. 165, 1328–1335 (2007).
26. Almasy, L. & Blangero, J. Multipoint quantitative-trait linkage analysis in general pedigrees. Am. J. Hum. Genet. 62, 1198–1211
(1998).
27. R Core Team. R: A Language and Environment for Statistical Computing. R Foundation for Statistical Computing. https: //www.R-
project.org (2020).
28. Devlin, B. & Roeder, K. Genomic control for association studies. Biometrics 55, 997–1004 (1999).
Acknowledgement
The views expressed in this manuscript are those of the authors and do not necessarily represent the views of the
National Heart, Lung, and Blood Institute; the National Institutes of Health; or the U.S. Department of Health
and Human Services.
Author contributions
Q.Y. conceived the project. M.C. and Q.Y. wrote the main manuscript text. M.C. conducted all simulations and
analyses. A.P. setup pipeline. All reviewed manuscript.
Funding
Open Access funding provided by the National Institutes of Health (NIH). The Framingham Heart Study is con-
ducted and supported by the NHLBI in collaboration with Boston University (Contract No. N01-HC-25195 and
HHSN268201500001). Genotyping, quality control, and calling of the Illumina HumanExome BeadChip in the
Framingham Heart Study were supported by funding from the National Heart, Lung and Blood Institute Division of
Intramural Research (Daniel Levy and Christopher J. O’Donnell, Principal Investigators). Support for the centralized
genotype calling was provided by Building on GWAS for NHLBI-diseases: the U.S. CHARGE consortium through
the National Institutes of Health (NIH) American Recovery and Reinvestment Act of 2009 (5RC2HL102419).
M-H.C. was supported by National Heart, Lung and Blood Institute Division of Intramural Research funds.
Competing interests
The authors declare no competing interests.
Additional information
Supplementary Information The online version contains supplementary material available at https://doi.
org/10.1038/s41598-021-82547-z.
Correspondence and requests for materials should be addressed to M.-H.C.
Reprints and permissions information is available at www.nature.com/reprints.
Publisher’s note Springer Nature remains neutral with regard to jurisdictional claims in published maps and
institutional affiliations.
Scientific Reports | (2021) 11:3145 | https://doi.org/10.1038/s41598-021-82547-z 10
Vol:.(1234567890)www.nature.com/scientificreports/
Open Access This article is licensed under a Creative Commons Attribution 4.0 International
License, which permits use, sharing, adaptation, distribution and reproduction in any medium or
format, as long as you give appropriate credit to the original author(s) and the source, provide a link to the
Creative Commons licence, and indicate if changes were made. The images or other third party material in this
article are included in the article’s Creative Commons licence, unless indicated otherwise in a credit line to the
material. If material is not included in the article’s Creative Commons licence and your intended use is not
permitted by statutory regulation or exceeds the permitted use, you will need to obtain permission directly from
the copyright holder. To view a copy of this licence, visit http://creativecommons.org/licenses/by/4.0/.
© The Author(s) 2021
Scientific Reports | (2021) 11:3145 | https://doi.org/10.1038/s41598-021-82547-z 11
Vol.:(0123456789)You can also read