An evaluation of Deccan Traps eruption rates using geochronologic data
←
→
Page content transcription
If your browser does not render page correctly, please read the page content below
Geochronology, 3, 181–198, 2021
https://doi.org/10.5194/gchron-3-181-2021
© Author(s) 2021. This work is distributed under
the Creative Commons Attribution 4.0 License.

An evaluation of Deccan Traps eruption rates using
geochronologic data
Blair Schoene1 , Michael P. Eddy2 , C. Brenhin Keller3 , and Kyle M. Samperton4
1 Department of Geosciences, Princeton University, Princeton, NJ 08544, USA
2 Department of Earth, Atmospheric, and Planetary Sciences, Purdue University, West Lafayette, IN 47907, USA
3 Department of Earth Sciences, Dartmouth College, Hanover, NH 03755, USA
4 Nuclear and Chemical Sciences Division, Lawrence Livermore National Laboratory, Livermore, CA 94550, USA

Correspondence: B. Schoene (bschoene@princeton.edu) and Brenhin Keller (cbkeller@dartmouth.edu)

Received: 14 April 2020 – Discussion started: 5 May 2020
Revised: 22 February 2021 – Accepted: 23 February 2021 – Published: 16 April 2021

Abstract. Recent attempts to establish the eruptive history      in constant eruption rates with relatively large uncertainties
of the Deccan Traps large igneous province have used both        through the duration of the Deccan Traps eruptions and pro-
U−Pb (Schoene et al., 2019) and 40 Ar/39 Ar (Sprain et al.,      vides no support for (or evidence against) the pulses identi-
2019) geochronology. Both of these studies report dates with     fied by the U−Pb data, (2) the stratigraphic positions of the
high precision and unprecedented coverage for a large ig-        Chicxulub impact using the 40 Ar/39 Ar and U−Pb datasets do
neous province and agree that the main phase of eruptions be-    not agree within their uncertainties, and (3) neither dataset
gan near the C30n–C29r magnetic reversal and waned shortly       supports the notion of an increase in eruption rate as a re-
after the C29r–C29n reversal, totaling ∼ 700–800 kyr dura-       sult of the Chicxulub impact. We then discuss the importance
tion. These datasets can be analyzed in finer detail to deter-   of systematic uncertainties between the dating methods that
mine eruption rates, which are critical for connecting vol-      challenge direct comparisons between them, and we high-
canism, associated volatile emissions, and any potential ef-     light the geologic uncertainties, such as regional stratigraphic
fects on the Earth’s climate before and after the Cretaceous–    correlations, that need to be tested to ensure the accuracy of
Paleogene boundary (KPB). It is our observation that the         eruption models. While the production of precise and accu-
community has frequently misinterpreted how the eruption         rate geochronologic data is of course essential to studies of
rates derived from these two datasets vary across the KPB.       Earth history, our analysis underscores that the accuracy of
The U−Pb dataset of Schoene et al. (2019) was interpreted        a final result is also critically dependent on how such data
by those authors to indicate four major eruptive pulses be-      are interpreted and presented to the broader community of
fore and after the KPB. The 40 Ar/39 Ar dataset did not iden-    geoscientists.
tify such pulses and has been largely interpreted by the com-
munity to indicate an increase in eruption rates coincident
with the Chicxulub impact (Renne et al., 2015; Richards
et al., 2015). Although the overall agreement in eruption du-    1   Introduction
ration is an achievement for geochronology, it is important
to clarify the limitations in comparing the two datasets and     There is increasing recognition that volcanic activity can im-
to highlight paths toward achieving higher-resolution erup-      pact global climate on both human and geologic timescales.
tion models for the Deccan Traps and for other large igneous     This relationship is apparent from historical explosive erup-
provinces. Here, we generate chronostratigraphic models for      tions (Minnis et al., 1993; Robock, 2000) and inferred for
both datasets using the same statistical techniques and show     larger, effusive eruptions through the Phanerozoic (Ernst and
that the two datasets agree very well. More specifically, we     Youbi, 2017; Self et al., 2014). Mafic large igneous provinces
infer that (1) age modeling of the 40 Ar/39 Ar dataset results   (LIPs) have been correlated with brief hyperthermal climate
                                                                 episodes such as the Paleocene–Eocene Thermal Maximum

Published by Copernicus Publications on behalf of the European Geosciences Union.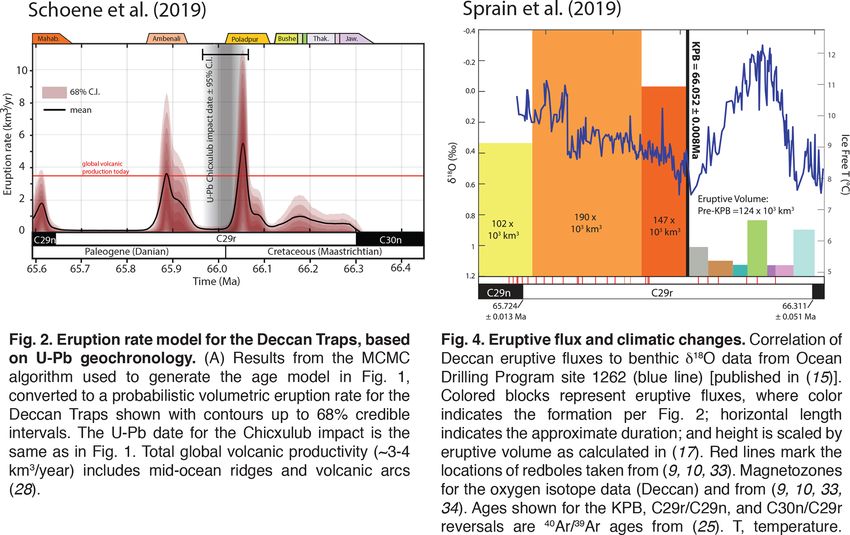
182                             B. Schoene et al.: An evaluation of Deccan Traps eruption rates using geochronologic data

(PETM), as well as several mass extinctions (Bond and Wig-         studies attempted to use their respective datasets to calculate
nall, 2014). The reasons for such disastrous climate and           eruption rates by estimating the volume of erupted basalts
ecosystem responses remain a focus of debate among Earth           as a function of time. The original plots used to illustrate
historians. Critical to this discussion are precise chronologies   the eruption rates, however, can be easily interpreted to show
of LIP eruptions, particularly since they have never been ob-      that the two geochronological datasets disagree significantly
served in recorded human history. Advances in geochrono-           (Fig. 2). Schoene et al. (2019) use the U−Pb dataset to ar-
logical techniques and applications over the last 2 decades        gue that the Deccan Traps erupted in four distinct pulses
have evolved to show that LIPs erupt > 105 km3 , usually in        separated by relative lulls in volcanism that lasted up to
less than a million years, as opposed to tens of millions as       100 kyr or more. Sprain et al. (2019) plot the 40 Ar/39 Ar
previously thought (Burgess and Bowring, 2015; Kasbohm             dataset in a way that gives the impression that there was
et al., 2020; Davies et al., 2017; Svensen et al., 2012). How-     a large increase in eruption rate associated with the Chicx-
ever, large uncertainties remain regarding the rates of extru-     ulub impact, though this was not the intent of the authors
sive versus intrusive magmatism, as well as the flux of vol-       (Sprain, 2020). This was a key message sent by the asso-
canic versus non-eruptive volatiles, such as CO2 and SO2 ,         ciated “News and Views” piece in the same issue of Sci-
that are thought to drive climate change (Black and Manga,         ence (Burgess, 2019), and the notion that the U−Pb and
2017; Burgess et al., 2017; Ganino and Arndt, 2009; Self           40 Ar/39 Ar datasets disagreed substantially has been propa-

et al., 2014; Svensen et al., 2004).                               gated by subsequent discussion and news coverage on Sci-
   The Deccan Traps, India, is the youngest LIP that is            enceMag.org (Kerr and Ward, 2019; Voosen, 2019). Authors
temporally associated with a mass extinction, spanning the         of subsequent papers (Henehan et al., 2019; Hull et al., 2020;
Cretaceous–Paleogene Boundary (KPB) (Fig. 1; Courtillot            Linzmeier et al., 2020; Milligan et al., 2019; Montanari and
et al., 1988; McLean, 1985). This extinction is also famously      Coccioni, 2019; Sepúlveda et al., 2019) also seem to con-
associated with collision of the Chicxulub bolide off the          clude that the datasets do not agree on the eruption rates
southern Mexican coast (Alvarez et al., 1980; Hildebrand           of the Deccan Traps and/or that the dataset of Sprain et al.
et al., 1991; Smit and Hertogen, 1980), and thus it has been       (2019) suggests an inflection in eruption rates of Deccan
debated whether or not the Deccan Traps played a role in           Traps at the KPB.
the extinction (Hull et al., 2020; Keller et al., 2008; Schulte       Throughout this paper, we assume that the individual erup-
et al., 2010). Furthermore, the temporal coincidence of the        tion ages for all samples from each study are accurate as re-
two potentially Earth-changing events has led to specula-          ported, and while both methods bring uncertainties to this
tion about whether the Chicxulub impactor could have had           assumption, this permits us to simply discuss how the data
an influence on eruption rates in the Deccan Traps (Byrnes         in each study were used to determine the eruptive history of
and Karlstrom, 2018; Rampino and Caldeira, 1992; Richards          the Deccan Traps. In doing so, we show that the conclusion
et al., 2015). Impacts and extinction aside, the Deccan Traps      that the eruption rates derived from the datasets of Schoene
provide an ideal setting in which to investigate the rates of      et al. (2019) and Sprain et al. (2019) disagree is incorrect and
LIP volcanism within a stratigraphic context because they are      that in fact they agree quite well. This confusion has arisen
relatively young and contain a well-exposed, accessible, and       in part because Fig. 4 in Sprain et al. (2019) that purports
well-studied stratigraphy (Fig. 1; Beane et al., 1986; Chenet      to plot eruptive flux does not have units of flux or rate and
et al., 2009, 2008; Kale et al., 2020; Mitchell and Widdow-        is therefore misleading. We apply the same analysis to both
son, 1991; Renne et al., 2015; Schoene et al., 2015; Subbarao      geochronological datasets, using units of volumetric erup-
et al., 2000).                                                     tion rate. The results are used to argue that the two datasets
   Two geochronological datasets appeared in the same issue        largely agree at their respective levels of precision, and that
of Science in 2019, both with the aim of establishing erup-        the lower-precision 40 Ar/39 Ar dataset does not support or re-
tion rates of the Deccan Traps and comparing their eruption        fute the model of pulsed eruptions established by the U−Pb
history to the climatic and biologic events associated with the    dataset. Adequately testing the pulsed eruption model will
mass extinction and the timing of the Chicxulub impact. One        require higher precision 40 Ar/39 Ar data, more U−Pb data,
paper (Sprain et al., 2019) uses 40 Ar/39 Ar geochronology         and/or an exploration of the stratigraphic correlations used
of plagioclase from erupted basalts and the other (Schoene         in each study. Furthermore, it is important to remind read-
et al., 2019) uses U−Pb geochronology on zircon from in-           ers that any eruption rate model is completely dependent on
terbeds between basalt flows that are thought to contain ash       the model of eruptive volumes, which comes with large and
fall deposits. The two datasets are consistent in that they        difficult to quantify uncertainties.
provide unambiguous evidence that the main phase of erup-             The apparent agreement in absolute ages between the two
tions began shortly before the C30n–C29r magnetic rever-           datasets, while encouraging, is subject to significant caveats
sal and ended following the C29r–C29n magnetic reversal            regarding the intercalibration of the U−Pb and 40 Ar/39 Ar
over a duration of ∼ 700–800 kyr, corroborating published          systems, including the age of the neutron fluence monitors
paleomagnetic data that was used to reach the same conclu-         used to calculate 40 Ar/39 Ar ages: adopting a different age
sion (Chenet et al., 2009, 2008; Courtillot et al., 1986). Both    for the Fish Canyon sanidine neutron fluence monitor that is

Geochronology, 3, 181–198, 2021                                                    https://doi.org/10.5194/gchron-3-181-2021
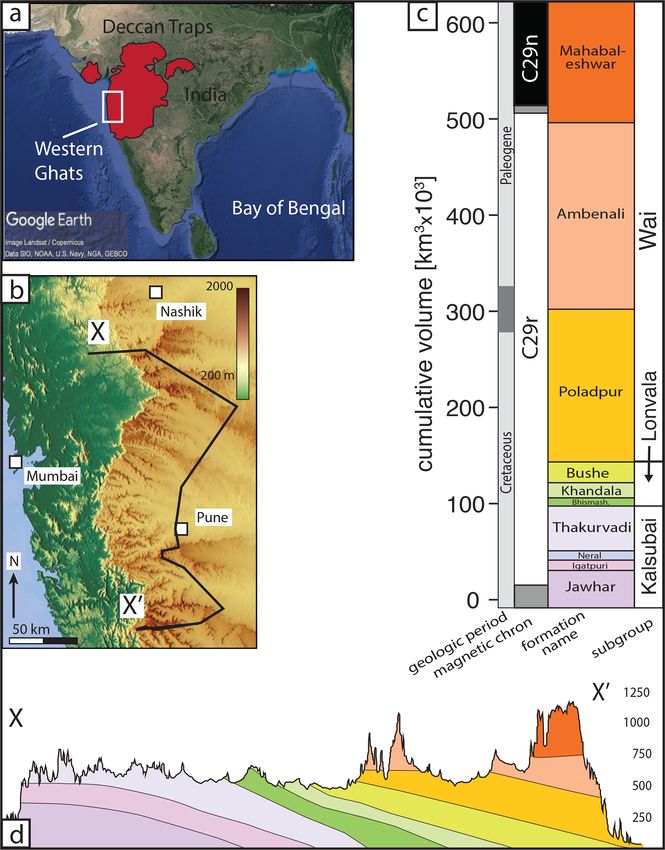
B. Schoene et al.: An evaluation of Deccan Traps eruption rates using geochronologic data                                                  183

Figure 1. Geography and stratigraphy of the Deccan Traps in the Western Ghats region. (a) Map of India (© Google Earth), showing in red
the footprint of the Deccan Traps; the white box indicates the study area, called the Western Ghats, and is enlarged in (b). (b) Colored relief
map (© OpenStreetMap contributors, 2020; distributed under a Creative Commons BY-SA License) of the Western Ghats showing several
cities and a cross section line from (d). (c) Stratigraphic column of the major basalt unit subdivisions in the Western Ghats. Stratigraphy
measured as cumulative volume, using the volume model for each formation from Richards et al. (2015), which was used in both Schoene
et al. (2019) and Sprain et al. (2019). (d) Cross section through the Western Ghats. The cross section line is chosen to go through the sampling
sites in Schoene et al. (2019). All figures are modified from Schoene et al. (2015, 2019), and references therein.

also widely used in the literature shifts the 40 Ar/39 Ar dataset         2    The geochronologic datasets
for the Deccan Traps and Chicxulub impact younger by about
200 kyr. While this does not affect the calculated duration of            The approaches used in Schoene et al. (2019) and Sprain
the Deccan Traps, the duration of the C29r magnetic polarity              et al. (2019) both had the goal of determining eruption dates
chron, or the possible stratigraphic positions of the Chicxu-             for multiple horizons within the Deccan Traps and calculat-
lub impact, such a shift does undermine any apparent agree-               ing eruption rates by using the regional volcanic stratigraphy.
ment between the 40 Ar/39 Ar and U−Pb datasets in absolute                Because the accuracy of all geochronologic dates depends on
time and highlights the need for continued work on intercal-              some set of assumptions that are testable to various degrees,
ibration of the two chronometers.                                         we briefly review the approach used for each dataset below.

https://doi.org/10.5194/gchron-3-181-2021                                                              Geochronology, 3, 181–198, 2021
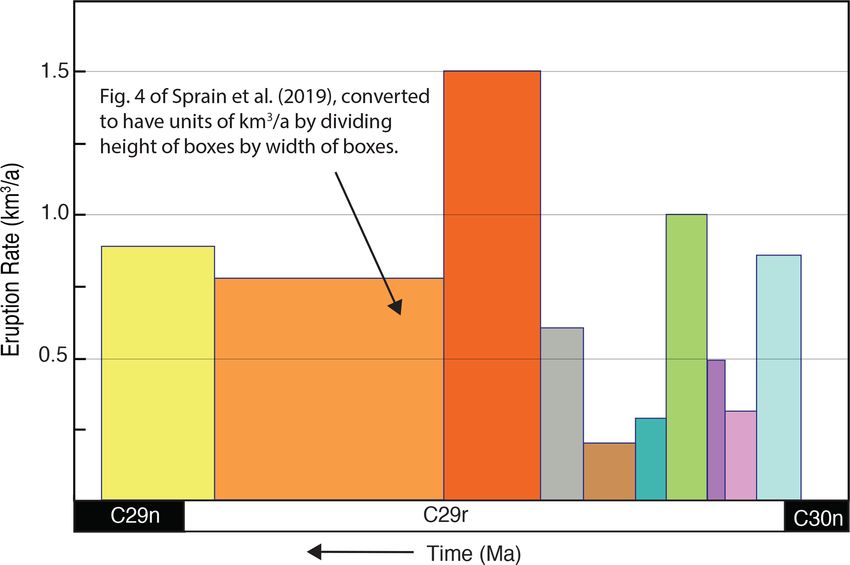
184                                B. Schoene et al.: An evaluation of Deccan Traps eruption rates using geochronologic data

Figure 2. Published eruption rates for the Deccan Traps. Figures illustrating eruption rate (or flux) are reproduced from Fig. 2A of Schoene
et al. (2019), left, and Fig. 4 of Sprain et al. (2019), right. Captions beneath illustrations are exactly as printed in those publications. Un-
certainties in Sprain et al. (2019) are 1σ . Figure 2A from Schoene et al. (2019) is modified here to exclude Fig. 2B but keep the x axis.
References from captions (numbers in italics) can be found in the original publications. Note that the colors used for the different formations
are not the same in each figure, but the stratigraphic order is the same from right to left. The main point made in the text from this paper is
that the units on the y axis in the Schoene et al. (2019) figure are in units of km3 a−1 , which are the units of a rate or flux; the units on the
y axis in the Sprain et al. (2019) figure for the Deccan portion are km3 , which is not a flux, and therefore the figure does not represent an
eruption rate or flux.

   Schoene et al. (2019) dated single-grain zircon crystals                Schoene et al. (2019) thus sampled ∼ 140 of these horizons,
by U−Pb chemical abrasion isotope dilution thermal ioniza-                 of which only 24 contained zircon, which were treated as
tion mass spectrometry (U−Pb CA-ID-TIMS; Reiners et al.,                   volcanic in origin in terms of eruption and deposition age
2017; Schaltegger et al., 2015; Schoene, 2014). Because                    interpretation. The challenges to calculating eruption ages
basalts rarely crystallize zircon, Schoene et al. (2019) tar-              from zircon due to the ubiquity of pre-eruptive zircon crys-
geted zircon that was found between basalt flows, in hori-                 tals are well discussed in the literature (Keller et al., 2018;
zons called red boles. These layers are fine-grained (vol-                 Sahy et al., 2017; Schoene et al., 2010; Simon et al., 2008).
cani)clastic sediments that are thought to develop through a               Schoene et al. (2019) used a Bayesian framework to calcu-
variety of processes, including some combination of in situ                late eruption ages from all the available zircon dates for each
weathering and soil development, eolian reworking, volcanic                red bole (Keller et al., 2018), but this approach gave identi-
air fall, and post-depositional fluid flow (Duraiswami et al.,             cal eruption estimates to other common approaches, such as
2020; Ghosh et al., 2006; Sayyed et al., 2014; Widdowson                   using the youngest grain or a weighted mean of the youngest
et al., 1997). Schoene et al. (2015) noted that these horizons             few grains (see the supplementary discussion in Schoene
sometimes appear to be volcaniclastic in origin at the out-                et al., 2019). All of these approaches assume that there is
crop scale and contain abundant zircon, while others are not               no significant Pb-loss, which is supported broadly through
obviously volcanic but contain euhedral zircons with mor-                  stratigraphic superposition, but difficult to prove at the fine
phologies that are sometimes unique to a particular red bole               scale desirable here. There is uncertainty in the volcanic in-
horizon, and whose age spectra are similar to typical sili-                terpretation for red bole zircons, given that petrographic or
cic volcanic ash fall (see also Kasbohm and Schoene, 2018).                mineralogical study has not been completed for most of the

Geochronology, 3, 181–198, 2021                                                               https://doi.org/10.5194/gchron-3-181-2021
B. Schoene et al.: An evaluation of Deccan Traps eruption rates using geochronologic data                                        185

dated horizons. This limitation opens up the possibility that       observation has been variable, it is increasingly uncommon
the zircons are detrital, rather than volcanic, and that they can   to report weighted mean U−Pb dates from ID-TIMS data and
only provide maximum depositional ages (Renne, 2020). In            increasingly common to explore the implications of age in-
addition to euhedral grain morphology, evidence against a           terpretations (see references above). More recently, however,
detrital origin comes from the observation that all eruption        analogous dispersion has been observed in high-precision
and deposition ages determined by Schoene et al. (2019) fall        single-crystal 40 Ar/39 Ar sanidine datasets – the causes of
in the anticipated stratigraphic order, that a low concentra-       which are not yet fully established but may involve incom-
tion of pre-Deccan zircons was found (∼ 10 %, also typical of       plete degassing of remobilized xeno- or phenocrysts (Ander-
ash beds), and that the geologic setting on a topographically       sen et al., 2017; Ellis et al. 2012; Mark et al., 2017). The
high shield volcano is not conducive to generating zircon-          incorporation and survival of non-outgassed plagioclase in
bearing detritus. Nonetheless, it has yet to be conclusively        effusive basaltic eruptions seems less likely than for sani-
shown that all of these zircons are derived from air fall. This     dine in explosive eruptions, but Ar-loss and plagioclase al-
assumption is being tested by examining all zircon popula-          teration are still concerns. So while 40 Ar/39 Ar in plagioclase
tions using geochemistry and/or Hf isotopic composition, as         currently lacks the resolution to resolve levels of dispersion
was done on a subset of Deccan Traps zircon data by Eddy            seen among single crystals of sanidine, a historical perspec-
et al. (2020) and Schoene et al. (2015).                            tive serves as a warning that this should not be taken as an in-
   Sprain et al. (2019) dated multi-grain aliquots of plagio-       dication of the absence thereof. Further development of high-
clase separated from basalt flows from the Deccan Traps             precision plagioclase dating of basalts is certainly warranted
using the 40 Ar/39 Ar method. The benefit of this approach          and would benefit from more examples where direct com-
is that the basalt flows can be directly dated. However, the        parison with sanidine and U−Pb dates from the same strata
low potassium content of plagioclase limits the precision of        would be helpful.
40 Ar/39 Ar dates using this technique. In order to achieve the        In summary, the datasets from Schoene et al. (2019) and
precision reported by Sprain et al. (2019), weighted mean           Sprain et al. (2019) were produced using state-of-the-art
dates were calculated from multiple handpicked multi-crystal        techniques, but each method comes with challenges in pro-
aliquots (tens to hundreds of grains each). The step heat-          ducing precise and accurate data. The accuracy of these
ing approach used helps to identify and permits exclusion           ages, as with any dataset, should to be tested with further
of outgassed zones with discordant age spectra (McDougall           geochronology and/or complementary approaches to deter-
and Harrison, 1999; Reiners et al., 2017). However, this ap-        mining eruption rates, but throughout the rest of this paper
proach must assume that all outgassing steps used to calcu-         we assume that the eruption ages determined by each study
late a plateau date, from each multi-grain aliquot of a par-        are accurate to their stated precision as a means of helping
ticular sample, are identical in age and free from any form         readers interpret the state of the current research.
of open-system behavior, which can only be tested to about
the level of precision for each heating step (which was on
average ± 3.2 Myr 2σ ). The assumption that the plagioclase         3   Correctly plotting volcanic eruption rates
should record an identical age is not bad, since Ar should be
outgassed from the crystals prior to eruption. However, it is       It is common to discuss volcanic flux in terms of the volume
possible that unresolvable open-system behavior due to alter-       of lava erupted in a given period of time, as cubic kilometers
ation or Ar loss may have occurred and testing this possibil-       per year (km3 a−1 ). We note here that we try to consistently
ity can only be done with higher precision data. Even then, it      refer to this as a rate rather than a flux because units of flux
has been shown that precise and concordant (but inaccurate)         include an area term that we do not know, despite rate and
plateau dates can be produced, in particular in whole-rock or       flux often being used interchangeably in the literature. Either
groundmass 40 Ar/39 Ar geochronology (Renne et al., 2015;           way, this calculation is prone to large uncertainties because it
also see Barry et al., 2013, versus Kasbohm and Schoene,            requires robust estimates of eruptive volumes combined with
2018). Because all the samples dated in Sprain et al. (2019)        geochronology that is precise enough to resolve changes in
fall in stratigraphic order and agree well with the U−Pb data,      eruption rate through time. Volume estimates for LIPs are es-
gross inaccuracies in the dates can be ruled out.                   pecially difficult because they are variably eroded over vast
   Regardless, it is important to strive for higher-precision       areas, with some exposing more sills than flows, and some,
data in order to test the accuracy of weighted-mean model           such as the Deccan, preserving the extrusive component but
dates. Improvement in analytical precision and accuracy             largely concealing any intrusive component. It is not atypical
across both U−Pb and 40 Ar/39 Ar systems have consistently          for volume estimates to vary by factors of 2–5 (Marzoli et al.,
revealed previously unexpected levels of dispersion that in-        2018; Ricci et al., 2013; Richards et al., 2015; Shellnutt et al.,
validate the assumptions of a multi-crystal weighted mean           2012). Furthermore, any eruptive model is critically depen-
approach. This was observed first with U−Pb dates from zir-         dent on the regionally correlated stratigraphic architecture of
con, due to inheritance and protracted crystallization (e.g.,       the LIP, which includes its own uncertainties. Both Schoene
Corfu, 2013; Schoene, 2014), and while the response to this         et al. (2019) and Sprain et al. (2019) use the same regional

https://doi.org/10.5194/gchron-3-181-2021                                                      Geochronology, 3, 181–198, 2021

186 B. Schoene et al.: An evaluation of Deccan Traps eruption rates using geochronologic data
for pre-Wai and Wai subgroup lavas in Fig. 2 from Sprain
et al. (2019).
To better compare the eruption rates from the two datasets,
we have applied the same plotting strategy from Schoene
et al. (2019) to both the U−Pb and 40 Ar/39 Ar datasets. This
approach assigns each sample to a position within a com-
posite stratigraphic section plotted as cumulative volume and
uses a Bayesian Markov Chain Monte Carlo (MCMC) algo-
rithm to build an age model (Keller, 2018). Here, we use the
assigned stratigraphic positions of the basalt samples from
Fig. 2 of Sprain et al. (2019) and apply the same MCMC
algorithm to that dataset (Fig. 4).
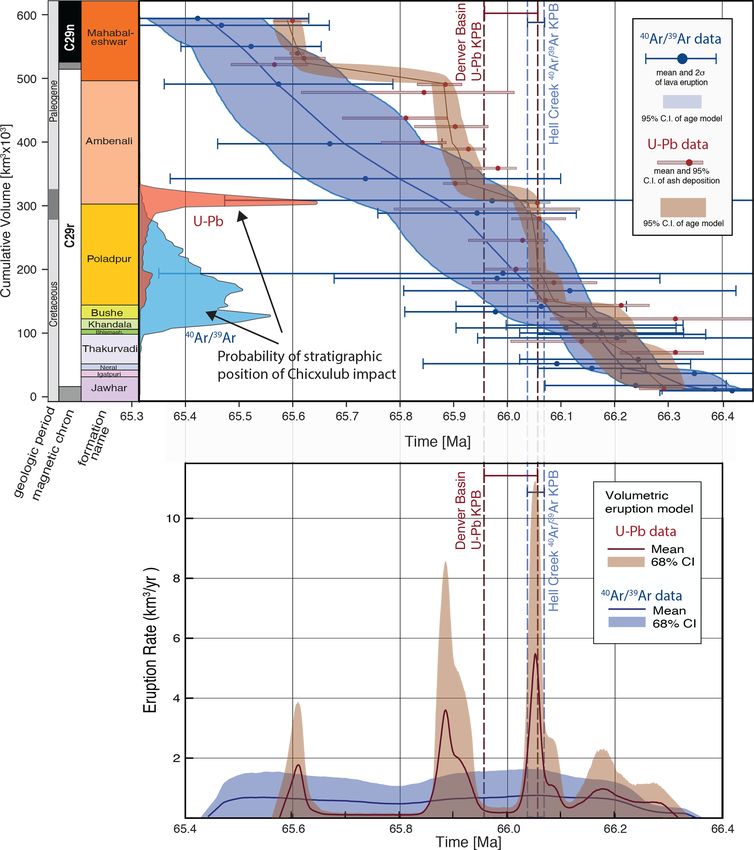
With the exception of the upper Ambenali Fm, the age
models for the U−Pb and 40 Ar/39 Ar agree at the 95 % cred-
Figure 3. Recalculated eruption rates from Fig. 4 of Sprain et al. ibility intervals (top panel of Fig. 4). The apparent discrep-
(2019). The original figure was converted to an eruption rate by ancy at the top of the Ambenali Fm could be due to potential
dividing the total volume of each formation (the heights in their sources of inaccuracy in either dating method as discussed in
Fig. 4) by their estimated durations for each formation to give units Sect. 2 or due to stratigraphic correlations, as discussed later
of km3 a−1 . Time is on the x axis, and the color and width of each in this paper; though systematic biases resulting from the
box is left as is from the original figure. See Fig. 4 of this paper for 238 U and 40 K decay constants and uncertain ages for neutron
probabilistic eruption rates.
fluence monitors used in 40 Ar/39 Ar dates largely undermine
the utility of comparing the absolute ages of these datasets
at any particular height (see Sect. 7 below). Eruption rates
determined from the 40 Ar/39 Ar dataset are relatively con-
stratigraphic framework and the same volume model for in- stant. However, the question of whether this apparent con-
dividual formations within the Deccan Traps (Richards et al., stancy provides an argument against pulsed eruptions is ex-
2015), and so while use of this model introduces significant plored in a subsequent section. The main point here is that
uncertainties in the calculated eruptive rates, any errors in the model results from neither dataset show any evidence for
this model affect both datasets in the same way. an increase in eruption rate associated with the Chicxulub
The figures showing eruption rates in Schoene et al. (2019) impact (Fig. 4, and see discussion below).
and Sprain et al. (2019; reported as eruptive flux, though as
clarified by Sprain, 2020, the plot that correctly shows aver-
age eruption rate is Fig. 2 of Sprain et al., 2019) appear in 4 The position of the Chicxulub impact in the
their Figs. 2 and 4, respectively, and are reproduced in our Deccan stratigraphy
Fig. 2. The apparent discrepancy between the datasets is ob-
vious, as the U−Pb dataset shows four eruptive pulses and The MCMC algorithm used above can also be queried to pro-
the 40 Ar/39 Ar appears to show a dramatic increase in erup- duce a probabilistic assessment of where the Chicxulub im-
tive flux starting at the base of the Poladpur Fm. However, the pact falls within the Deccan stratigraphy, given an age and
box heights in Fig. 4 of Sprain et al. (2019) do not have units uncertainty estimate for the impact event. Chicxulub impact
of flux or rate. They correspond to the total volume of each dates from both U−Pb and 40 Ar/39 Ar methods exist in the
formation [km3 ], rather than the eruption rate [km3 a−1 ]. The literature (Clyde et al., 2016; Renne et al., 2013; Sprain et al.,
apparent increase is because the Poladpur, Ambenali, and 2018), allowing us to simply calculate the probability that
Mahabaleshwar are larger in the volume model of Richards the impact occurred at each point in our stratigraphic age
et al. (2015) and not necessarily because they erupted faster. model. Doing so with the U−Pb data shows that it is highly
Sprain (2020) has noted the error in labeling this plot as flux likely that the impact occurred near the top of the Poladpur
and argues against interpreting it as such. We have redrafted Fm (Fig. 4). The same procedure with the 40 Ar/39 Ar dataset
Fig. 4 from Sprain et al. (2019) by simply dividing the vol- shows a wider range of possible positions for the Chicxulub
ume of each formation (height of their boxes) by the esti- impact, ranging from the base of the Khandala Fm and tailing
mated duration that Sprain et al. (2019) used for each forma- off towards the top of the Poladpur Fm. (Fig. 3). Therefore,
tion (width of their boxes), to give units of volume and time it is unlikely that these two datasets agree as to the position
(Fig. 3). Note that while this is a more realistic depiction of of the Chicxulub impact within the Deccan Traps eruptive
the eruption rates derived from the 40 Ar/39 Ar data, this plot history.
has difficulty taking into account the non-negligible uncer- Sprain et al. (2019) noted a similarly large uncertainty
tainties in formation boundary ages and therefore eruption in the position of the Chicxulub impact within the Deccan
rates. Our results corroborate average eruption rates reported Traps when evaluated using the composite stratigraphic sec-
Geochronology, 3, 181–198, 2021 https://doi.org/10.5194/gchron-3-181-2021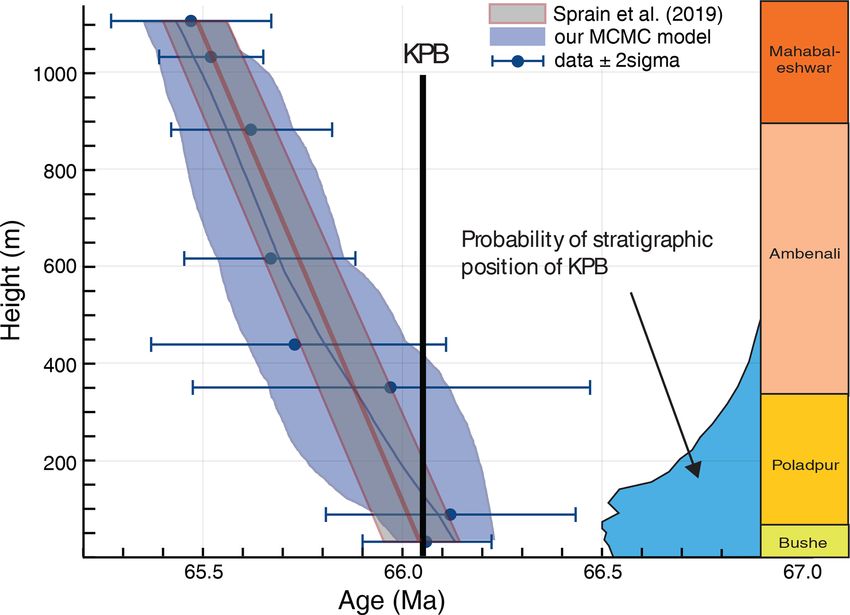
B. Schoene et al.: An evaluation of Deccan Traps eruption rates using geochronologic data                                                      187

Figure 4. Age models and eruption rates for the Deccan Traps. Age models and eruptions rates produced using geochronologic data from
Schoene et al. (2019; red) and Sprain et al. (2019; blue), using the same methods as described in Schoene et al. (2019). Data and model for
Schoene et al. (2019) are identical to those in the original publication. Note the units on the stratigraphy in the top panel are cumulative km3
(not m), and thus the slopes of the age models are km3 a−1 , which is plotted in the lower panel. The volume model is from Richards et al.
(2015). Stratigraphic heights for the Sprain et al. (2019) samples are taken from their Fig. 2. Also plotted is the probability of the stratigraphic
position of the Chicxulub impact as calculated during the MCMC age modeling by querying where an accepted age model intersects an age
for the KPB. The U−Pb age model is compared to the U−Pb KPB date from Clyde et al. (2016); the 40 Ar/39 Ar age model is compared to
the 40 Ar/39 Ar KPg date from Sprain et al. (2018).

https://doi.org/10.5194/gchron-3-181-2021                                                                 Geochronology, 3, 181–198, 2021
188                               B. Schoene et al.: An evaluation of Deccan Traps eruption rates using geochronologic data

Figure 5. A reanalysis of an 40 Ar/39 Ar age model using data from a single stratigraphic section. Carried out on the Ambenali Ghat, as per
Sprain et al. (2019). Results with 95 % CI from our MCMC algorithm are shown over the top of the model presented in Sprain et al. (2019),
using the freely available Bayesian MCMC model Bacon (Blaauw and Christen, 2011). The difference in the results arises from assumptions
about deposition rates imposed by Bacon, resulting in smaller uncertainties. Formation stratigraphy is plotted on the right, using the color
scheme from Schoene et al. (2019). To the left of stratigraphic column a histogram of the possible stratigraphic height of the Chicxulub
impact (KPB) is plotted using the 40 Ar/39 Ar Deccan data and the 40 Ar/39 Ar date for the impact (KPB) from Sprain et al. (2018). A large
portion of the histogram would plot beneath 0 m height but cannot be calculated accurately.

tion (Fig. 4). In order to avoid the uncertainty that correlation       the 40 Ar/39 Ar data from the Ambenali Ghat. The result is
between different stratigraphic sections may impose on eval-            a less precise age model and also a less certain position of
uating the position of the Chicxulub impact, they approached            the Chicxulub impact within the stratigraphy (Fig. 5). In our
the problem using samples that were collected from a single             results, the position of the Chicxulub impact forms a proba-
continuous stratigraphic section with good coverage of the              bility distribution that spans as high as the lower Ambenali
upper part of the Deccan stratigraphy (the Ambenali Ghat).              Fm to well below the bottom of the section, similar to the
In their analysis, Sprain et al. (2019) subject their dataset to        results for the composite stratigraphic section presented in
a Bayesian age modeling algorithm called Bacon (Blaauw                  Fig. 4.
and Christen, 2011). One of the premises of this algorithm
is that it incorporates several assumptions about the MCMC              5   Testing for pulsed versus non-pulsed eruption:
sampling, including the requirement of priors for both accu-                the importance of temporal resolution in
mulation and eruption rate and the memory and linearity of                  geochronologic datasets
these rates throughout the stratigraphic sequence. The result
of this approach on the dataset from Sprain et al. (2019) is            We use the modeling exercise above to argue that neither the
that it very easily adopts a linear deposition rate, resulting in       40 Ar/39 Ar nor the U−Pb data support an increase in eruption
a very precise age model in which the Chicxulub impact and              rate in the Deccan Traps at the time of the Chicxulub impact.
Bushe–Poladpur contact appear coeval (Fig. 5).                          While the average eruption rates through time are equiva-
   While the merits and drawbacks of assumptions about de-              lent for both datasets, the model result for the 40 Ar/39 Ar
position rates in sedimentary strata age modeling can be de-            dataset shows constant eruptions at ca. 1–2 km3 a−1 and that
bated (and has been, e.g., Blaauw and Christen, 2011; Haslett           for the U−Pb dataset shows pulses reaching > 10 km3 a−1
and Parnell, 2008; Parnell et al., 2011; Wright et al., 2017),          (Fig. 4). The average 2σ precision for each U−Pb date is
we do not think that any assumptions about eruption rate                ±64 kyr, whereas the average precision of the 40 Ar/39 Ar
for the Deccan Traps, or any other LIP, can be justified a              dates is ± 213 kyr. Given the roughly factor of 4 lower an-
priori. Therefore, we have instead applied our own MCMC                 alytical precision of the 40 Ar/39 Ar dataset compared to the
model, which makes no assumptions about eruption rate, to               U−Pb dataset, it is reasonable to ask whether the 40 Ar/39 Ar

Geochronology, 3, 181–198, 2021                                                           https://doi.org/10.5194/gchron-3-181-2021
B. Schoene et al.: An evaluation of Deccan Traps eruption rates using geochronologic data                                                189

Figure 6. Synthetic dataset subjected to MCMC age modeling to test the age precision necessary to resolve pulses in eruptions. Panel
(a) shows the dataset, meant to approximate the age model of Schoene et al. (2019) but shown here with negligible uncertainties (±10 kyr 2σ ).
Panels (b–f) show model outputs for eruption rates generated for different 2σ uncertainties on the input data themselves (i.e., uncertainties
on “data” from a). The results indicate that a threshold of precision is required for geochronology to resolve pulses and hiatuses of given
durations. Also shown in red are the average reported 2σ uncertainties on eruption ages from the U−Pb dataset of Schoene et al. (2019) and
the 40 Ar/39 Ar dataset from Sprain et al. (2019). The point is that the lower precision 40 Ar/39 Ar dataset cannot test the hiatus and pulse
model observed by the U−Pb dataset.

should be expected to resolve the pulses if they indeed ex-              and time on the x axis (Fig. 6). The dataset approximates the
ist? There are two limiting factors that need to be consid-              pulsed behavior observed in the U−Pb data – four pulses
ered in answering this question: (1) the stratigraphic separa-           of eruption separated by relative lulls over a duration of
tion between samples (i.e., pulses that are not sampled can-             ca. 800 kyr. We then applied the same MCMC age model
not be resolved) and (2) analytical resolution (i.e., pulses that        to these data, varying the analytical precision and calculating
are much shorter than the analytical precision cannot be re-             eruption rates as a function of time.
solved). Both the U−Pb and 40 Ar/39 Ar datasets reported 20–                The predicted outcomes for the extreme endmembers are
30 samples that span the four proposed pulses of magmatism,              straightforward: with no uncertainty in the ages, the signal
which is more than adequate to resolve four pulses. How-                 is clearly resolved and would still be so with many fewer
ever, the larger analytical uncertainties associated with the            data points. However, with ± 1 Myr precision, it is impos-
40 Ar/39 Ar dates suggest a limit in resolving power.                    sible to see any pulsed behavior, despite its presence in the
   To explore the analytical precision required to resolve the           underlying data. Because the results are less predictable for
pulses of eruption purported to exist in Schoene et al. (2019),          uncertainties between these endmembers, we present plots
we constructed a synthetic dataset that consists of a strati-            for analytical precisions spanning the range obtained by the
graphic section with cumulative erupted volume on the y axis             geochronologic datasets. For ± 50 kyr, which approximates

https://doi.org/10.5194/gchron-3-181-2021                                                            Geochronology, 3, 181–198, 2021
190 B. Schoene et al.: An evaluation of Deccan Traps eruption rates using geochronologic data
the uncertainty obtained in the U−Pb dataset, the four pulses the y axis changed from cumulative volume to elevation in
are clearly resolvable (Fig. 6). Increasing uncertainty begins the Ambenali Ghat (sometimes called the Mahabaleshwar
to smear this signal, such that around ± 150 kyr, it begins to Ghat). The right-hand side of Fig. 7a shows the individ-
be difficult to argue that there are more than two pulses if ual sections with the same thickness scale but with absolute
any at all. By ± 200 kyr, a bit lower than the average uncer- heights arbitrarily shifted so the Poladpur–Ambenali contact
tainty in the 40 Ar/39 Ar dataset, it is impossible to discern any is at about the same height. The thickness of the Poladpur
signal except that of an approximately constant eruption rate Fm in the Katraj and Sanhagad Fort sections was shrunk to
(Fig. 6). place samples RBBH and RBBF into the Ambenali Fm, as
The above exercise shows that the current 40 Ar/39 Ar in Schoene et al. (2019; the little red arrow is projected from
dataset is incapable of testing whether or not the Deccan the formation boundary as originally mapped).
Traps erupted at a constant rate, or with 2, 3, 4 or more pulses Figure 7b shows the results of applying the same age mod-
over the 800 kyr lifespan of the LIP. This exercise does not eling technique employed above (Figs. 4 and 5) to the U−Pb
prove that the pulsed eruption model derived from U−Pb data from individual stratigraphic sections, requiring no, or
geochronology is correct or complete, but simply shows very little, lateral correlation. Note that the y axes in Fig. 7
that the 40 Ar/39 Ar dataset cannot be used to rigorously test are now in absolute elevation (m), except for the Katraj–
it. Extending this line of reasoning, there are clearly finer- Sanhagad sections, which were dip-corrected such that the
scale pulses within the Deccan Traps that the U−Pb data axis is thickness and relative sample heights are accurate.
do not resolve. An endmember would be that of individual The Ambenali and Khambatki Ghats were placed on the
basalt flows, which erupt as pulses with timescales of days same panel to save space. The results show that local hia-
to months at modern volcanoes or years to decades in the tuses, or slower eruption rates, are required in the Supe and
case of flood basalts (Self et al., 2014; Thordarson and Self, the Katraj Ghats, whereas the age model from the Ambenali
1998). Similarly, red bole layers likely represent hiatuses in Ghat is consistent with a linear eruption rate. Whether these
deposition of several thousand years on average (given at local hiatuses translate into regional features can be reason-
least 100 red boles exist through the stratigraphy), but the ably questioned.
majority of them go undetected by the U−Pb data. This is Figure 7c carries out a qualitative experiment to see what is
consistent with the hiatuses represented by red boles being necessary to achieve a linear eruption rate through the entire
shorter than about half the average uncertainty in the U−Pb sampled interval. To do this, the sample elevations from the
data, or 30 kyr. This exercise highlights the need to acquire Ambenali Ghat are fixed, and the sample positions from other
ever more precise geochronologic data, so as to better tease sections are superimposed on the Ambenali Ghat by using
out finer-scale eruption dynamics in LIPs. the U−Pb eruption ages from individual horizons and slid-
ing them vertically until they fall on the line defined by the
Ambenali Ghat. The relative height of samples in each indi-
6 Uncertainties in stratigraphic correlation vidual section is maintained, but the relative position of sam-
ples between sections is permitted to shift relative to Fig. 7a.
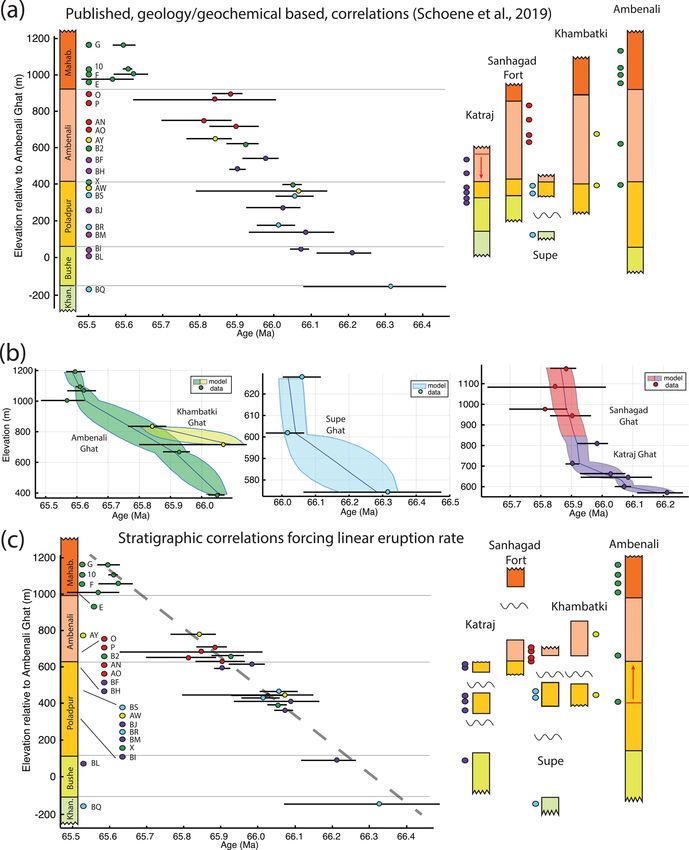
The stratigraphy of the Deccan Traps (Fig. 1) has been de- Assuming a linear eruption rate through the Western Ghats
veloped over decades of geologic and geochemical research results in stratigraphic correlations in Fig. 7c that would re-
(Beane et al., 1986; Chenet et al., 2007; Jay and Widdowson, quire for the samples in Schoene et al. (2019) to be derived
2008; Khadri et al., 1988; Mitchell and Widdowson, 1991; from limited portions of stratigraphy with essentially no sam-
Subbarao et al., 2000). Both Schoene et al. (2019) and Sprain ples collected in the lower and upper Poladpur Fm or the up-
et al. (2019) used this stratigraphic framework for sampling per Ambenali Fm. This interpretation assumes that the Am-
and regional correlation, and their results are consistent with benali Ghat has no resolvable hiatuses between the Bushe
these widely supported stratigraphic correlations and super- and the Mahabaleshwar Fms, whereas every other sampled
position (Fig. 7a). However, with the exception of some con- section contains the presence of numerous local hiatuses.
spicuous flows, such as those with megacrystic plagioclase This interpretation also requires significant lateral variation
found in the Kalsubai subgroup, correlating individual flows in formation thicknesses beyond what was previously recog-
or packages of flows within a formation is difficult over long nized. Such a stratigraphic architecture is not unreasonable
distances. As a result, there is uncertainty in building detailed for a shield volcano. However, we are not aware of any geo-
composite stratigraphic sections or volume models, as is re- logic or geochemical arguments for imposing a linear erup-
quired to calculate eruption rates throughout the entire Dec- tion rate and leave this alternative correlation scheme as a
can Traps (Fig. 7a). Here, we explore how modest changes hypothesis that could be tested with further field studies, geo-
in stratigraphic correlation could affect the pulsed eruption chemical campaigns, and/or geochronology.
model of Schoene et al. (2019).
Figure 7a shows the data as originally reported in Schoene
et al. (2019) from the upper Khandala Fm to the top of our
sampling in the lower-middle Mahabaleshwar Fm but with
Geochronology, 3, 181–198, 2021 https://doi.org/10.5194/gchron-3-181-2021B. Schoene et al.: An evaluation of Deccan Traps eruption rates using geochronologic data 191 Figure 7. Stratigraphic correlations in the Wai and Lonvala subgroups. (a) Original stratigraphic correlations used in Schoene et al. (2019), including redefined Poladpur–Ambenali boundary in the Katraj Ghat section (the red arrow points to the new position). (b) Age modeling performed on individual sections, requiring no correlation. Colors correspond to sample dot colors in (a, c). Elevations in the Sanhagad– Katraj Ghat composite section are dip-corrected such that relative heights are accurate despite some lateral translation to make the composite section. (c) New correlations and sample positions that would be required to force linear eruption rates through the Deccan Traps. The dashed line is for visual aid. Squiggly lines are required hiatuses or decreased eruption rates. Formation colors are the same as in Figs. 1 and 4. https://doi.org/10.5194/gchron-3-181-2021 Geochronology, 3, 181–198, 2021
192 B. Schoene et al.: An evaluation of Deccan Traps eruption rates using geochronologic data
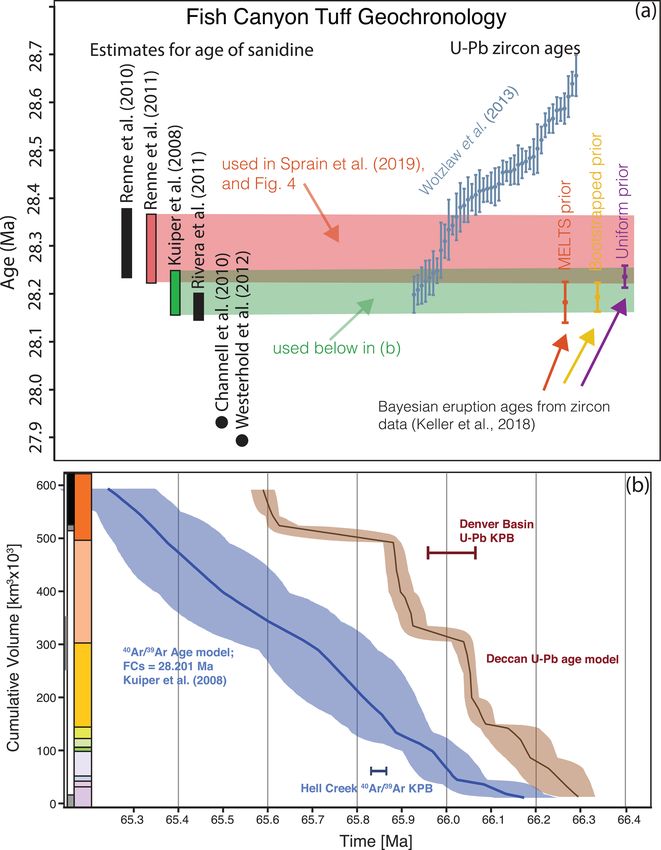
7 Systematic uncertainties: U−Pb and 40 Ar/39 Ar mate of Kuiper et al. (2008) and Rivera et al. (2011; Fig. 8a).
intercalibration The recently developed Bayesian zircon eruption age estima-
tor gives an age that also agrees to a higher probability with
Understanding and quantifying the systematic uncertainties the Kuiper et al. (2008) estimate (Keller et al., 2018). This
between the 40 Ar/39 Ar and U−Pb dating methods have been poses a significant problem: if the U−Pb age for eruption of
major focuses in the effort to improve geochronologic in- the Fish Canyon tuff is correct, then the 40 Ar/39 Ar dates for
tercalibration over the last 2 decades. Renne et al. (1998) the Deccan Traps and the Chicxulub impact become younger
pointed out the ∼ 1 % difference in U−Pb and 40 Ar/39 Ar by ∼ 200 kyr (Fig. 8b); if the Renne et al. (2011) age for the
from rocks near the Permian–Triassic mass extinction event, FCs is correct (Fig. 3), then the datasets from the Deccan
and since then work has focused on examining and refin- Traps agree well but would require the U−Pb data and sev-
ing the 40 K decay constants and physical constants (such eral other estimates from the FC tuff to be significantly too
as 40 K/K and decay branching ratio; Min et al., 2000; Vil- young. While it is well known that zircons are susceptible to
leneuve et al., 2000), testing the relative accuracy of the U de- Pb loss, causing them to yield U−Pb dates that are too young,
cay constants (Mattinson, 2000, 2010; Schoene et al., 2006), the FC zircons were subjected to chemical abrasion that helps
and developing better ages for high-K minerals used as neu- to mitigate Pb loss (Mattinson, 2005). Importantly, the trends
tron fluence monitors in 40 Ar/39 Ar geochronology (Kuiper in zircon geochemistry and age observed by Wotzlaw et al.
et al., 2008; Kwon et al., 2002; Renne et al., 2010). Paral- (2013) suggest that the age dispersion in that dataset reflects
lel efforts to improve these systematic uncertainties have in- magmatic growth rather than Pb loss.
volved the intercalibration of rock samples dated by both the There is no easy solution to this problem, and it does not
U−Pb and 40 Ar/39 Ar methods, which can help refine the ac- affect the relative dates within each system. Similarly, if the
curacy and precision of each method (Machlus et al., 2020; entire suite of systematic uncertainties for each system were
Min et al., 2000; Renne et al., 2010; Schoene et al., 2006; to be included (FCs standard age, decay constants for both
Villeneuve et al., 2000). Ongoing experiments to remeasure U and 40 K, tracer uncertainties used in ID-TIMS, and the
the U decay constants will provide much needed additional physical constants of K; see summaries in Condon et al.,
data to test their presumed accuracy (Parsons-Davis et al., 2015; McLean et al., 2015; Renne et al., 2011, 2010), the
2018). datasets would overlap within 95 % confidence regardless of
Despite much progress towards intercalibrating these the choice of FCs age. However, the ideal scenario combin-
two chronometers, significant uncertainties remain that pre- ing the U−Pb and 40 Ar/39 Ar dates from the Deccan Traps is
vent integrating datasets at the precision required to in- premature, and evaluating the sources of apparent disagree-
form LIP chronology. Arguably the most important remain- ment between absolute dates in the 40 Ar/39 Ar and U−Pb
ing source of systematic uncertainty for Cenozoic sam- dates near the top of the Ambenali Fm is hampered.
ples is the adopted age of neutron fluence monitors used
in 40 Ar/39 Ar geochronology. These monitors, or standards,
are natural minerals whose prescribed ages directly con- 8 Discussion and conclusions
trol the calculated sample ages. In the age range of the
Cretaceous–Paleogene boundary, the Fish Canyon sanidine Determining the rates of LIP magmatism is crucial for build-
(FCs) is typically used, for which most 40 Ar/39 Ar labs have ing models that explain in what ways large-scale volcanism
adopted the age of either 28.201 Ma (Kuiper et al., 2008) can lead to mass extinction events and climate change. With-
or 28.294 Ma (Fig. 7; Renne et al., 2011, 2010). This dis- out detailed knowledge of the tempo of extrusion and intru-
crepancy scales roughly linearly into the ages of unknowns sion and how these two endmember magmatic processes are
near the Cretaceous–Paleogene boundary, resulting in an age distributed through time and space, we cannot expect to de-
difference of ∼ 200 kyr. If systematic uncertainties are not rive the rates of volatile release that are the presumed driver
propagated, as is desirable for high-precision comparison of of climate change and biosphere collapse. High-precision
U−Pb and 40 Ar/39 Ar datasets, this shift is quite significant geochronology is an essential piece of this puzzle and is only
given the achievable internal precision (note that all the Dec- just beginning to reveal answers to these questions (Black-
can Traps data shown in this paper thus far neglect systematic burn et al., 2013; Burgess and Bowring, 2015; Davies et al.,
uncertainties from each method). 2017; Kasbohm and Schoene, 2018; Mahood and Benson,
The 40 Ar/39 Ar data from the Deccan Traps were nor- 2017), but much remains to be done. Determining and max-
malized to the FCs date of 28.294 Ma (Renne et al., 2011), imizing the precision and accuracy of dates for erupted vol-
which has resulted in good overall agreement between the umes of magma will continue to be a challenge and require
U−Pb and 40 Ar/39 Ar datasets for the Deccan Traps (Fig. 3) integration of geochronology with geologic, geochemical,
and estimates for the lower and upper C29r magnetic rever- geophysical, and petrological data. The above analysis does
sals. However, the youngest U−Pb zircon date from the Fish not address most aspects of this integration and mostly as-
Canyon tuff is 28.196 ± 0.038 Ma (Wotzlaw et al., 2013), sumes that the 40 Ar/39 Ar and U−Pb datasets recently pub-
which is in better agreement with the younger FCs age esti- lished for the Deccan Traps are accurate at their stated preci-
Geochronology, 3, 181–198, 2021 https://doi.org/10.5194/gchron-3-181-2021B. Schoene et al.: An evaluation of Deccan Traps eruption rates using geochronologic data 193 Figure 8. Effect of choice of the age for the Fish Canyon sanidine (FCs) neutron fluence monitor on the 40 Ar/39 Ar dataset. (a) Summary of existing estimates for the age of the FCs from the literature, generated using a variety of techniques, shown with height of bars as 2σ uncertainties (when reported), compared to the U−Pb zircon dataset from Wotzlaw et al. (2013). Each blue dot and uncertainty bar represents a single zircon analysis from the tuff. Also shown are eruption age estimates using the Bayesian technique from Keller et al. (2018) applied to the zircon dataset. Horizontal semi-transparent red and green lines (with width corresponding to 2σ uncertainties) are shown projected into the zircon dataset to facilitate comparison between the Renne et al. (2011) estimate for the FCs age, which was used in Sprain et al. (2019), and the Kuiper et al. (2008) estimate. Both the Kuiper et al. (2008) and Rivera et al. (2011) estimates very likely agree with the U−Pb eruption estimates, whereas the Renne et al. (2011) is less likely to do so. (b) Simplified 40 Ar/39 Ar and U−Pb age models from Fig. 4 but with the 40 Ar/39 Ar data reduced using the Kuiper et al. (2008) FCs age instead of the Renne et al. (2011) FCs age. Both U−Pb and 40 Ar/39 Ar dates exclude systematic uncertainties. Both Deccan ages and the Chicxulub impact age shift younger by ∼ 200 kyr, and there is no overlap between the U−Pb and 40 Ar/39 Ar age models. The takeaway is that either the Deccan 40 Ar/39 Ar and U−Pb datasets can agree or the FC tuff 40 Ar/39 Ar and U−Pb ages can agree but not both, unless systematic uncertainties are included. https://doi.org/10.5194/gchron-3-181-2021 Geochronology, 3, 181–198, 2021
194                             B. Schoene et al.: An evaluation of Deccan Traps eruption rates using geochronologic data

sion. Continued work addressing both analytical and geolog-       and whether or not this correlates with the eruptive history
ical uncertainties on determining basalt eruption ages from       (Black and Gibson, 2019; Self et al., 2008; Svensen et al.,
geochronology is necessary to validate that assumption. The       2010; Svensen et al., 2004). Key to this work is that we as
40 Ar/39 Ar and U−Pb datasets for the Deccan Traps from           geochronologists set the standard for uncertainty assessment
Sprain et al. (2019) and Schoene et al. (2019) pose a unique      in data collection and age interpretation and for how these
opportunity to do this because both studies sample the LIP        data are used to generate eruption age models that the greater
with unprecedented resolution and push the limits of preci-       geoscience community can leverage in their own research.
sion and accuracy for each method, especially noting that the
precision of the 40 Ar/39 Ar data was limited by dating a K-
poor mineral.                                                     Data availability. There were no original codes or data produced
   We have highlighted here several issues with the way the       as part of this paper. All codes and data used in this analysis are
40 Ar/39 Ar data have been used to interpret eruption rates       openly available as described in the referenced papers.
of the Deccan Traps, and do so because this misinterpreta-
tion has appeared in summaries of the two articles (Burgess,
2019), the popular media (e.g., Voosen, 2019), and in sub-        Author contributions. All authors conceived and carried out the
                                                                  analysis presented in this paper. BS prepared the figures and wrote
sequent presentations and papers discussing these datasets
                                                                  the text, which were revised by the coauthors.
(Henehan et al., 2019; Hull et al., 2020; Linzmeier et al.,
2020; Milligan et al., 2019; Montanari and Coccioni, 2019).
The potential fallout of these misunderstandings is that it       Competing interests. The authors declare that they have no con-
risks painting a picture among non-geochronologists that the      flict of interest.
U−Pb and 40 Ar/39 Ar methods cannot agree on the erup-
tion history of the Deccan Traps and that the geological
community should be skeptical of geochronology in gen-            Acknowledgements. Gerta Keller, Thierry Adatte, and Syed
eral. We have shown that, systematic uncertainties aside,         Khadri are thanked for ongoing collaboration on research related to
the 40 Ar/39 Ar dataset for the Deccan Traps determined by        the Deccan Traps, which formed the basis for this study. Drafts of
Sprain et al. (2019) is largely compatible with the U−Pb          this paper benefited from comments by and discussion with mem-
dataset presented in Schoene et al. (2019), which is an           bers of the Schoene Lab Group. Kip Hodges, Paul Renne, Courtney
achievement for geochronology and should be celebrated.           Sprain, and an anonymous reviewer are thanked for their comments.
However, we also show that one of the key misinterpreta-          Darren Mark is thanked for feedback and editorial handling.
tions of the Sprain et al. (2019) analysis by other workers,
that eruption rates increased following the Chicxulub im-
pact, is not supported by either dataset given the current age    Review statement. This paper was edited by Darren Mark and
                                                                  reviewed by Kip Hodges, Paul Renne, Courtney Sprain, and one
constraints for the impact. This relationship could be further
                                                                  anonymous referee.
tested by, for example, additional geochronology on the Dec-
can Traps, reproducing the current U−Pb date for the impact,
and/or further constraining U−Pb and 40 Ar/39 Ar intercali-
bration such that the U−Pb record of the Deccan Traps could
be compared to the 40 Ar/39 Ar date for the impact.               References
   To be clear, this paper is not meant to suggest that the
pulsed eruption model based on the U−Pb geochronology             Alvarez, L. W., Alvarez, W., Asaro, F., and Michel, H. V.: Ex-
is correct. This model should be treated as a working hy-           traterrestrial cause for the Cretaceous-Tertiary extinction, Sci-
pothesis that needs to be tested with additional high-precision     ence, 208, 1095–1108, 1980.
geochronology on samples that can test the stratigraphic cor-     Andersen, N. L., Jicha, B. R., Singer, B. S., and Hil-
relations used in Schoene et al. (2019); in addition, con-          dreth, W.: Incremental heating of Bishop Tuff sanidine re-
tinued work to produce more robust estimates for eruption           veals preeruptive radiogenic Ar and rapid remobilization
ages from complex zircon datasets is needed (Galeotti et al.,       from cold storage, P. Natl. A. Sci. USA, 114, 12407,
2019; Keller et al., 2018; Schoene et al., 2010). Additional        https://doi.org/10.1073/pnas.1709581114, 2017.
geochronology is also needed to provide a broader perspec-        Barry, T., Kelley, S., Reidel, S., Camp, V., Self, S., Jarboe, N., Dun-
                                                                    can, R., Renne, P., Ross, M., and Wolff, J.: Eruption chronology
tive on Deccan volcanism regionally (Knight et al., 2003;
                                                                    of the Columbia River Basalt Group, in: The Columbia River
Eddy et al., 2020; Parisio et al., 2016; Schöbel et al., 2014;
                                                                    Flood Basalt Province, Geological Society of America, Special
Sheth et al., 2019). These data must be combined with sam-          Paper, 497, 45–66, 2013.
ples and geophysical data that characterize the intrusive his-    Beane, J. E., Turner, C. A., Hooper, P. R., Subbarao, K. V., and
tory of the Deccan Traps. Finally, to better understand the         Walsh, J. N.: Stratigraphy, composition and form of the Dec-
potential climatic impact of Deccan magmatism, more work            can Basalts, Western Ghats, India, B. Volcanol., 48, 61–83,
must to be done to understand the history of volatile release       https://doi.org/10.1007/BF01073513, 1986.

Geochronology, 3, 181–198, 2021                                                        https://doi.org/10.5194/gchron-3-181-2021
B. Schoene et al.: An evaluation of Deccan Traps eruption rates using geochronologic data 195 Blaauw, M. and Christen, J. A.: Flexible paleoclimate age-depth ceous/Tertiary boundary?, Earth Planet. Sc. Lett., 80, 361–374, models using an autoregressive gamma process, Bayesian Anal., https://doi.org/10.1016/0012-821X(86)90118-4, 1986. 6, 457–474, 2011. Courtillot, V., Feraud, G., Maluski, H., Vandamme, D., Moreau, Black, B. A. and Gibson, S. A.: Deep Carbon and the Life M. G., and Besse, J.: Deccan flood basalts and the Creta- Cycle of Large Igneous Provinces, Elements, 15, 319–324, ceous/Tertiary boundary, Nature, 333, 843–846, 1988. https://doi.org/10.2138/gselements.15.5.319, 2019. Davies, J., Marzoli, A., Bertrand, H., Youbi, N., Ernesto, M., Black, B. A. and Manga, M.: Volatiles and the tempo of flood and Schaltegger, U.: End-Triassic mass extinction started basalt magmatism, Earth Planet. Sc. Lett., 458, 130–140, by intrusive CAMP activity, Nat. Commun., 8, 15596, https://doi.org/10.1016/j.epsl.2016.09.035, 2017. https://doi.org/10.1038/ncomms15596, 2017. Blackburn, T. J., Olsen, P. E., Bowring, S. A., McLean, N. M., Kent, Duraiswami, R. A., Sheth, H., Gadpallu, P., Youbi, N., and Chel- D. V., Puffer, J., McHone, G., Rasbury, E. T., and Et-Touhami, lai, E. H.: A simple recipe for red bole formation in continental M.: Zircon U−Pb Geochronology Links the End-Triassic Extinc- flood basalt provinces: weathering of flow-top and flow-bottom tion with the Central Atlantic Magmatic Province, Science, 340, breccias, Arab. J. Geosci., 13, 1–14, 2020. 941–945, 2013. Eddy, M. P., Schoene, B., Samperton, K. M., Keller, G., Adatte, Bond, D. P. G. and Wignall, P. B.: Large igneous provinces and T., and Khadri, S. F.: U−Pb zircon age constraints on the mass extinctions: An update, Geol. S. Am. S., 505, 29–55, 2014. earliest eruptions of the Deccan Large Igneous Province, Burgess, S.: Deciphering mass extinction triggers, Science, 363, Malwa Plateau, India, Earth Planet. Sc. Lett., 540, 116249, 815–816, 2019. https://doi.org/10.1016/j.epsl.2020.116249, 2020. Burgess, S., Muirhead, J., and Bowring, S.: Initial pulse of Siberian Ellis, B. S., Mark, D. F., Pritchard, C. J., and Wolff, J. A.: Temporal Traps sills as the trigger of the end-Permian mass extinction, Nat. dissection of the Huckleberry Ridge Tuff using the 40 Ar/39 Ar Commun., 8, 1–6, 2017. dating technique, Quat. Geochronol., 9, 34–41, 2012. Burgess, S. D. and Bowring, S. A.: High-precision geochronol- Ernst, R. E. and Youbi, N.: How Large Igneous Provinces affect ogy confirms voluminous magmatism before, during, and af- global climate, sometimes cause mass extinctions, and represent ter Earth’s most severe extinction, Sci. Adv., 1, e1500470, natural markers in the geological record, Palaeogeogr. Palaeocl., https://doi.org/10.1126/sciadv.1500470, 2015. 478, 30–52, 2017. Byrnes, J. S. and Karlstrom, L.: Anomalous K-Pg–aged seafloor Galeotti, S., Sahy, D., Agnini, C., Condon, D., Fornaciari, E., attributed to impact-induced mid-ocean ridge magmatism, Francescone, F., Giusberti, L., Pälike, H., Spofforth, D. J. A., Sci. Adv., 4, eaao2994, https://doi.org/10.1126/sciadv.aao2994, and Rio, D.: Astrochronology and radio-isotopic dating of the 2018. Alano di Piave section (NE Italy), candidate GSSP for the Pri- Chenet, A., Quidelleur, X., Fluteau, F., Courtillot, V., and Bajpai, S.: abonian Stage (late Eocene), Earth Planet. Sc. Lett., 525, 115746, 40 K−40 Ar dating of the Main Deccan large igneous province: https://doi.org/10.1016/j.epsl.2019.115746, 2019. Further evidence of KTB age and short duration, Earth Planet. Ganino, C. and Arndt, N. T.: Climate changes caused by degassing Sc. Lett., 263, 1–15, https://doi.org/10.1016/j.epsl.2007.07.011, of sediments during the emplacement of large igneous provinces, 2007. Geology, 37, 323–326, 2009. Chenet, A.-L., Fluteau, F., Courtillot, V., Gérard, M., and Sub- Ghosh, P., Sayeed, M. R. G., Islam, R., and Hundekari, S. M.: barao, K. V.: Determination of rapid Deccan eruptions across Inter-basaltic clay (bole bed) horizons from Deccan traps of the Cretaceous-Tertiary boundary using paleomagnetic sec- India: Implications for palaeo-weathering and palaeo-climate ular variation: Results from a 1200 m-thick section in the during Deccan volcanism, Palaeogeogr. Palaeocl., 242, 90–109, Mahabaleshwar escarpment, J. Geophys. Res., 113, B04101, https://doi.org/10.1016/j.palaeo.2006.05.018, 2006. https://doi.org/10.1029/2006jb004635, 2008. Haslett, J. and Parnell, A.: A simple monotone process with appli- Chenet, A.-L., Courtillot, V., Fluteau, F., Gérard, M., Quidelleur, cation to radiocarbon-dated depth chronologies, J. R. Stat. Soc. X., Khadri, S. F. R., Subbarao, K. V., and Thordarson, T.: De- C.-Appl., 57, 399–418, 2008. termination of rapid Deccan eruptions across the Cretaceous- Henehan, M. J., Ridgwell, A., Thomas, E., Zhang, S., Alegret, Tertiary boundary using paleomagnetic secular variation: 2. Con- L., Schmidt, D. N., Rae, J. W. B., Witts, J. D., Landman, straints from analysis of eight new sections and synthesis for a N. H., Greene, S. E., Huber, B. T., Super, J. R., Planavsky, 3500 m-thick composite section, J. Geophys. Res., 114, B06103, N. J., and Hull, P. M.: Rapid ocean acidification and pro- https://doi.org/10.1029/2008jb005644, 2009. tracted Earth system recovery followed the end-Cretaceous Clyde, W. C., Ramezani, J., Johnson, K. R., Bowring, S. A., and Chicxulub impact, P. Natl. Acad. Sci. USA, 116, 22500, Jones, M. M.: Direct high-precision U−Pb geochronology of https://doi.org/10.1073/pnas.1905989116, 2019. the end-Cretaceous extinction and calibration of Paleocene astro- Hildebrand, A. R., Penfield, G. T., Kring, D. A., Pilkington, M., nomical timescales, Earth Planet. Sc. Lett., 452, 272–280, 2016. Camargo, Z., A., Jacobsen, S. B., and Boynton, W. V.: Chicxulub Condon, D., Schoene, B., McLean, N., Bowring, S., and Parrish, R.: crater: a possible Cretaceous/Tertiary boundary impact crater on Metrology and traceability of U−Pb isotope dilution geochronol- the Yucatan Peninsula, Mexico, Geology, 19, 867–871, 1991. ogy (EARTHTIME Tracer Calibration Part I), Geochim. Cos- Hull, P. M., Bornemann, A., Penman, D. E., Henehan, M. J., Norris, mochim. Ac., 164, 464–480, 2015. R. D., Wilson, P. A., Blum, P., Alegret, L., Batenburg, S. J., and Corfu, F.: A century of U−Pb geochronology: The long quest to- Bown, P. R.: On impact and volcanism across the Cretaceous– wards concordance, Geol. Soc. Am. Bull., 125, 33–47, 2013. Paleogene boundary, Science, 367, 266–272, 2020. Courtillot, V., Besse, J., Vandamme, D., Montigny, R., Jaeger, Jay, A. E. and Widdowson, M.: Stratigraphy, structure and volcanol- J.-J., and Cappetta, H.: Deccan flood basalts at the Creta- ogy of the SE Deccan continental flood basalt province: implica- https://doi.org/10.5194/gchron-3-181-2021 Geochronology, 3, 181–198, 2021
You can also read