AN EXHAUSTIVE ANALYSIS OF LAZY VS. EAGER LEARNING METHODS FOR REAL-ESTATE PROPERTY INVESTMENT - OpenReview
←
→
Page content transcription
If your browser does not render page correctly, please read the page content below
Under review as a conference paper at ICLR 2019

A N E XHAUSTIVE A NALYSIS OF L AZY VS . E AGER
L EARNING M ETHODS FOR R EAL -E STATE P ROPERTY
I NVESTMENT∗
 Anonymous authors
 Paper under double-blind review

                                              A BSTRACT
           Accurate rent prediction in real estate investment can help in generating capital
           gains and guaranty a financial success. In this paper, we carry out a comprehen-
           sive analysis and study of eleven machine learning algorithms for rent prediction,
           including Linear Regression, Multilayer Perceptron, Random Forest, KNN, ML-
           KNN, Locally Weighted Learning, SMO, SVM, J48, lazy Decision Tree (i.e., lazy
           DT), and KStar algorithms. Our contribution in this paper is twofold: (1) We
           present a comprehensive analysis of internal and external attributes of a real-estate
           housing dataset and their correlation with rental prices. (2) We use rental predic-
           tion as a platform to study and compare the performance of eager vs. lazy machine
           learning methods using myriad of ML algorithms. We train our rent prediction
           models using a Zillow data set of 4K real estate properties in Virginia State of the
           US, including three house types of single-family, townhouse, and condo. Each
           data instance in the dataset has 21 internal attributes (e.g., area space, price, num-
           ber of bed/bath, rent, school rating, so forth). In addition to Zillow data, external
           attributes like walk/transit score, and crime rate are collected from online data
           sources. A subset of the collected features - determined by the PCA technique-
           are selected to tune the parameters of the prediction models. We employ a hierar-
           chical clustering approach to cluster the data based on two factors of house type,
           and average rent estimate of zip codes. We evaluate and compare the efficacy of
           the tuned prediction models based on two metrics of R-squared and Mean Ab-
           solute Error, applied on unseen data. Based on our study, lazy models like KStar
           lead to higher accuracy and lower prediction error compared to eager methods like
           J48 and LR. However, it is not necessarily found to be an overarching conclusion
           drawn from the comparison between all the lazy and eager methods in this work.

1       I NTRODUCTION
Real estate rent prediction has a key role in calculating the Rate of Return- a measure for evaluating
the performance of an investment in the housing market. Rate-of-Return can measure the quality
of a real estate investment over a time-period and Net Present Value (NPV) is one of its important
factors (Investopedia)1 . In real-estate NPV defines the profitability of the investment based on rate
of return. The NPV yields an accurate insight to real estate investors on whether they achieve a
satisfactory rate of return within a certain period of time. Equation 1 shows how to calculate NPV2 :

                                                   N
                                                   X     CFn
                                         NPV =                                                       (1)
                                                   n=0
                                                       (1 + r)n

In equation 1, CF is the cash flow generated from a rental property for each period n in the holding
period N (i.e., the time period of an investment), and r is the desired investor rate of return. Based on
equation 1, one of the important factors in evaluating the NPV of a real estate property investment
is cash flow (CF) that is calculated based on equation 2 for a 12-month period:
    1
        https://www.investopedia.com/terms/f/futurevalue.asp
    2
        https://www.propertymetrics.com/blog/2015/06/11-/what-is-npv/

                                                     1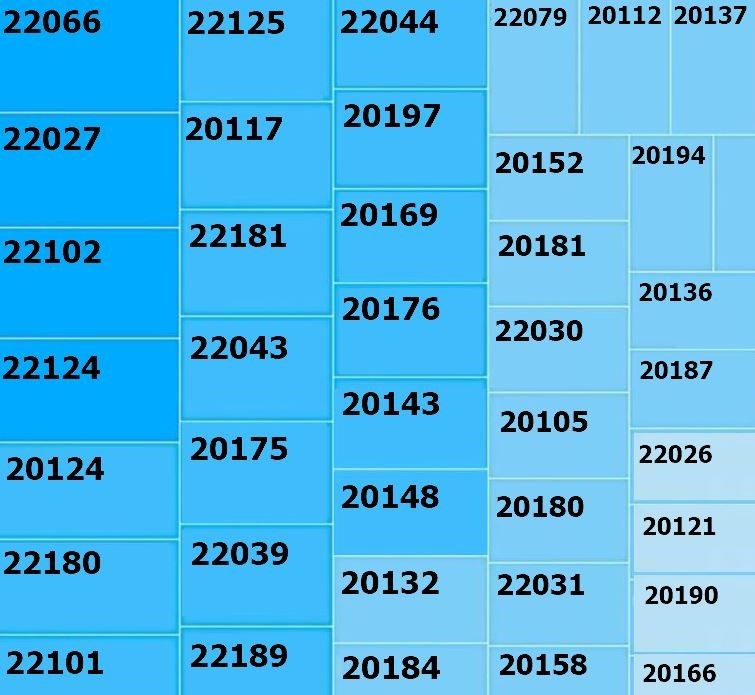
Under review as a conference paper at ICLR 2019

                                  CF = 11ρ − (12µ + τ +  + ι)                                      (2)

where ρ is the rent income (for simplicity, the Vacancy rate analysis is not discussed here, and the
assumption is based on 11-months rent income per year), µ is the house mortgage, τ is the annual
house tax,  is the annual house expenses, and ι is the mortgage house insurance. In equation 2, ρ is
only factor that has a positive effect on cash flow. Therefore, it is very essential to provide an accu-
rate rent prediction method. For many people, house is an invaluable asset. Therefore, having a safe
investment is a significant task. Proper rental property investments can lead to a successful and prof-
itable Rate of Return over time. However, such ventures can be very risky due to miscalculation or
inaccuracy of algorithms used in rent prediction. Applying machine learning algorithms to perform
house rent prediction is not a novel trend. Lambert & Greenland (2015) investigates eager learning
methods like MLP, and bagging REP trees to estimate the rental rate for both the land-owners and
students interested in renting a place close to a university campus. The coverage area of the training
set is limited to three distant zip codes surrounding a university campus. The input features enter-
tained in this work include proximity to university campus, apartment appliances and dimensions,
the length of the apartment contract, and the date of the residence’s constructions. The study reports
bagging REP trees as the best rent prediction algorithm. However, the proposed global learning-
based solution can generate a biased model due to the skewed data set, all located surrounding a
university campus. In the previous studies, the prediction models for real estate rent/price prediction
are very generic and they don’t differentiate according to the house type and/or zip code (Limsom-
bunchai, 2004; Yu & Wu, 2016). Figure 1 shows zip code-wise variation of the rent behavior, even
for the real estate properties which are in the same state/city or a close geo-spatial proximity from
each other. For instance, the zip codes 22066 and 20190 are neighbors but they show a very different
behavior in terms of the average rent price.

Figure 1: Average rent prices for real-estate
properties based on zip code in the state of
VA. The dark blue shows higher rent prices               Figure 2: Two-layer clustering technique,
compared to the bright blue color which in-              first according to house type, and then based
dicates lower rent prices.                               on average rent price.

In addition, statistical data shows that house type parameter affects the rent price due to internal
factors like area space, number of bed/bathrooms, HOA fee, community factors, so forth (see Fig-
ure 3). The average rent price for a zip code depends on internal factors (like house type, number
of bed/bath, price, area space, other) and external factors. In fact, external factors like walk/transit
score, crime rate, and school ratings corresponding to a zip code impact the price of rent and are
deal-breakers for many real estate investors (US News)3 . In this paper, internal and external house
properties are entertained. Walk score indicates the errands that can be accomplished on foot or
those that require a car to nearby amenities. Transit score indicates the connectivity (i.e., proximity

  3
    https://realestate.usnews.com/real-estate/articles/
how-homicide-affects-home-values

                                                   2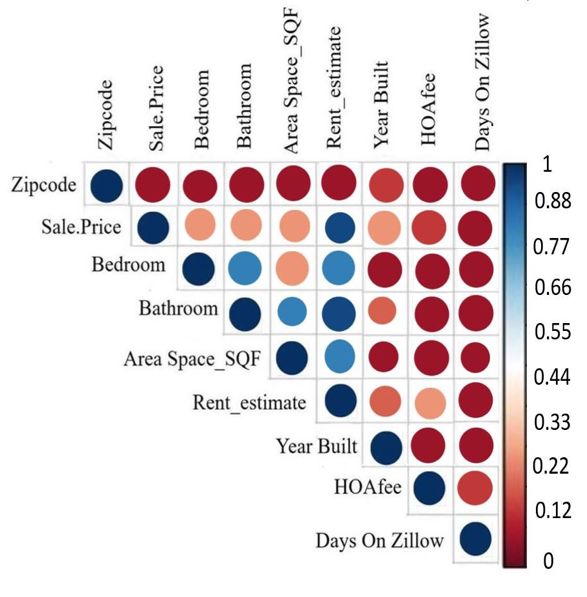
Under review as a conference paper at ICLR 2019

            Figure 3: Rent distribution for different house types for multiple zip codes.

to metro), access to jobs, and frequency of service. Crime score indicates the rate of violent and
non-violent incidents related to a zip code (FBI) 4 .
In the past studies, the impact of eager learning methods for real estate rent/price prediction has
been investigated (Lambert & Greenland, 2015). Eager methods require less space in comparison
with lazy algorithms. However, in the real estate rent prediction domain, we are not dealing with
streaming data, and so data volume is not a critical issue. In general, unlike eager learning methods,
lazy learning (or instance learning) techniques aim at finding the local optimal solutions for each test
instance. Kohavi et al. (1996) and Homayouni et al. (2010) store the training instances and delay
the generalization until a new instance arrives. Another work carried out by Galván et al. (2011),
compares a limited number of memory-based learning vs neural network methods, and report the
superiority of memory-based method over Neural Network approach using multiple data sets of UCI
machine learning data set repository, including Iris, Diabetes, Sonar, Vehicle, car, and balance. In
this study, the two lazy learning algorithms, namely Integer Part and Atomic Radios outperformed
eager learning algorithms, namely SMO and Naive Bayes algorithm. Our work is inspired by these
research explorations.
We collected a Zillow data set of 4K real estate properties in Virginia State. In addition, transit/walk
score, and crime rate are collected from information sources like alltransit.cnt.org, walkscore.com,
and crimereports.com respectively. The transit parameters entertained in the data collected from All-
Transit data source clearly indicates the proximity to metro as a significant parameter in determining
the transit score of a location.
The data set consists of three house types: town-house, single family, and condo. This study is mo-
tivated by the need to build models with respect to house type and zip code. To deal with the sparse
(i.e., thin) data in every zip code, we divided the data set according to house type, and then applied
K-means clustering to generate subsets of instances within zip codes with similar average rent prices
as illustrated in Figure 2. The clustering method uses the similarity measure of average-rent to com-
pute the distance between the data points. The data samples in each cluster is later used to train a
rent prediction model. In this work, we study the impact of several machine learning methods on
this data set by performing a comparative analysis of lazy vs. eager learning methods. We report the
empirical results to compare the performance of lazy vs. eager learning algorithms in real-estate rent
prediction for each house type and a subset of zip codes with similar average rent prices. We examine
the performance of Linear Regression (LR), Sequential Minimal Optimization (SMO), Multilayer
Perceptron (MLP), J48, SVM, and Random Forest (FR) algorithms (eager/globally-based learning)
against K-Nearest Neighbors (KNN), Multi-Label KNN (ML-KNN), lazy Decision Tree (Lazy-DT),
locally weighted learning (LWL) and KStar (K*) algorithms (lazy/memory-based learning/instance-
based), using two performance evaluation metrics: i) R-squared and ii) Mean Absolute Error (MAE).
The target variable is the rent price and the evaluation metrics show the variance between the pre-
dicted target variable and the actual rent price. Our rent prediction algorithm uses a salient subset of
data set attributes, which is determined during feature selection using Principal Component Analysis
technique (PCA). PCA technique filters out unwanted features based on each house type (i.e., single
family, town house, and condo), and independent of the learning algorithm applied on the data. For

  4
    https://ucr.fbi.gov/crime-in-the-u.s/2011/crime-in-the-u.s.-2011/
violent-crime/violent-crime

                                                   3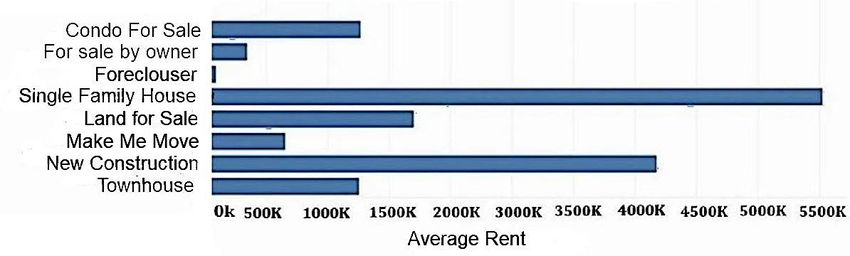
Under review as a conference paper at ICLR 2019

imputation, we removed the observations with many missing attributes as the proportion of these
instances to the entire data set was less than 3%. The remainder of this paper is structured as fol-
lows: In section 2 related work is discussed. We describe the data set used in this paper for analysis
in section 3. Section 4 describes our methodological framework including data preprocessing, data
exploration and feature selection, building prediction models, and model evaluation. In section 5,
experiments and results are discussed. Finally, section 6 gives the conclusion.

2   R ELATED W ORK

Real estate rent/price prediction using machine learning techniques has already been studied in sev-
eral works (Galván et al., 2011; Limsombunchai, 2004; Khamis & Kamarudin, 2014; Basu & Thi-
bodeau, 1998; Webb, 2011; Kuntz & Helbich, 2014). In Wang et al. (2014), PSO-SVM algorithm is
used for real-estate price prediction. Liu (2013) uses spatiotemporal dependencies between housing
transactions to predict future house prices. This approach is limited by spatial autocorrelation, since
the degree of similarity between observations is not solely based on the distance separating them.
Some of the previous work focus on hedonic price models as a method of estimating the demand
and value in the housing market and determination of house prices (Önder et al., 2004; Ozus et al.,
2007). In these studies, rather than internal and external house features, economic submarkets are
used in the prediction model which are defined in terms of the characteristics of neighborhoods or
census units. Limsombunchai (2004) uses a sample size of 200 houses of all house types in New
Zealandto train a hedonic price and an artificial neural network (ANN) model, and shows that the
eager method ANN outperforms the hedonic model. The problem with the hedonic approach is dis-
regarding the differences between the properties in the same geographical area. Park & Bae (2015)
determine the house sales trends of the US housing market subject to the Standard & Poor’s Case-
Shiller home price indices and OFHEO which is the housing price index of the Office of Federal
Housing Enterprise Oversight. The authors used and compared the classification accuracy of four
methods C4.5, RIPPER, Naı̈ve Bayesian, and AdaBoost, where RIPPER algorithm outperformed
others. We are now at the age where people in different fields are hacking their way into machine
learning. Machine learning techniques have become available as commodities which can be used to
perform prediction and classification tasks in various domains like real-estate rent/price prediction.
Khamis & Kamarudin (2014) compared the efficacy of the eager learning method Neural Network
(NN) against the hedonic model Multiple-Linear Regression (MLR), and showed that NN outper-
forms MLR. However, Galván et al. (2011) reports the superiority of lazy learning methods over NN.
According to Webb (2011), eager learning methods can sometimes lead to suboptimal predictions
because of deriving a single model that seeks to minimize the average error over the entire data set,
whereas lazy learning can help improve prediction accuracy. While our study is inspired by Galván
et al. (2011) and Webb (2011), we take our analysis to the next level, by comparing the impact of
eager and lazy learning algorithms in the prediction accuracy of the generated models with respect
to each house type and a subset of zip codes with similar average rent prices. We use a two-layer
clustering technique, and a subset of internal and external real-estate property factors.

3   DATA SET D ESCRIPTION

There are variety of housing data sources in the real estate market. Zillow API delivers home de-
tails including historical data on sales prices, year of sale, tax information, number of bed/baths, so
forth, for the US. In fact, Zillow is tied to various sources like real estate agents, homeowners, tax
assessors, public records, and Multiple Listing Service (MLS). Normally, rent prices in real-estate
housing do not change abruptly within a very short time window. For example, rent price of a real
estate property is not subject to change every day. Hence, there is no need for frequently updating
the rent price in the dataset. We analyzed the real-estate rent prices in different zip codes provided by
Zillow, and did not find any drastic changes within a period shorter than 4 months, which suggests
that the listed rent prices are reasonably reliable. We used the Zillow API to collect a data set of res-
idential housing data for the state of Virginia. The size of this data set contains about 4000 housing
property records (including townhouse, single-family, and condo) with 21 attributes. In addition,
external attributes, namely walk score, transit score, and crime rate are collected. Figure 4 shows
the crime rate for violent and non-violent crime incidents in different zip codes. The description of
walk score is illustrated in Table 1.

                                                   4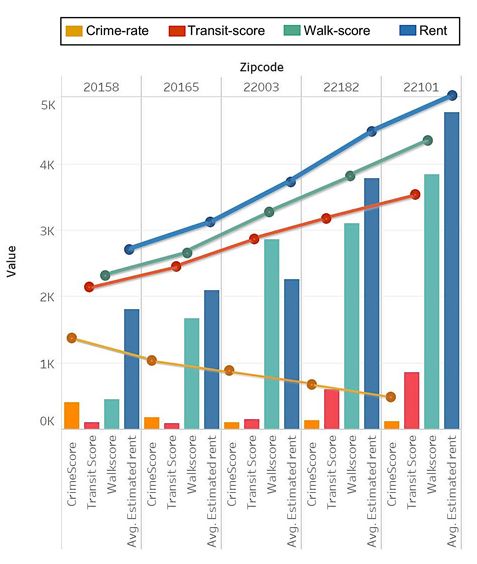
Under review as a conference paper at ICLR 2019

               Table 1: Categorical Description of Walk Score (www.walkscore.com).
               Walk Score                            Description

               90-100         Walker’s Paradise: daily errands do not require a car.
               70-89          Very Walkable: most errands can happen on foot.
               50-69          Somewhat walkable: some errands can happen on foot.
               25-49          Car-Dependent: most errands require a car.
               0-24           Car-Dependent: almost all errands require a car.

Figure 4: Crime score in the zip code level
obtained from www. crimereports.com, in-                Figure 5: K-means clustering of transit score
cluding violent and non-violent crimes.                 data generated 48 clusters with maximum
                                                        distance 6 miles.

We collected transit score data from All Transit source5 : their dataset is collected from 824 agen-
cies, and it includes 662K stop locations and 13K routs. Transit and walk scores are collected per
household, while crime rate is obtained for each zip code , normalized by the number of people liv-
ing in that area using Selenium tool with Python. Crime score data was normalized using Dickson
method (Dickson, 2014) indicated by equation 3:

                                            CrimeIncidents
                          Incidentnorm =                   ∗ 100, 000                             (3)
                                              population

We obtained zip code-wise population by collecting data from www.moving.com. The zip code-wise
correlation between normalized crime rate and population suggests that crime rate is influenced by
both geographic areas (i.e., zip codes) and population.

4       M ETHODOLOGY

4.1      DATA P REPROCESSING

One of the rudimentary principles in calibration of machine learning models when dealing with a
biased data is to re-sample the data to balance them (Sanjuán, 2012). Based on our assessment
of the data set, some of the geographic areas have much higher densities compared to other areas.
To normalize the data, we re-sampled the data in zip codes with higher house prices due to their
crowded density relative to the zip codes with lower house prices. For imputing the missing values
of external attributes, we used K-means clustering and KNN. Figure 5 shows the result of this
clustering to impute transit score data. The distances between data points is calculated with respect
to each cluster centroid. To reduce the dimensionality of the data set and enhance the generalization
of the model, we perform feature selection by applying PCA to all 21 attributes of the data set.
However, before applying PCA, attributes are normalized based on Min-Max Normalization.
    5
        https://alltransit.cnt.org

                                                 5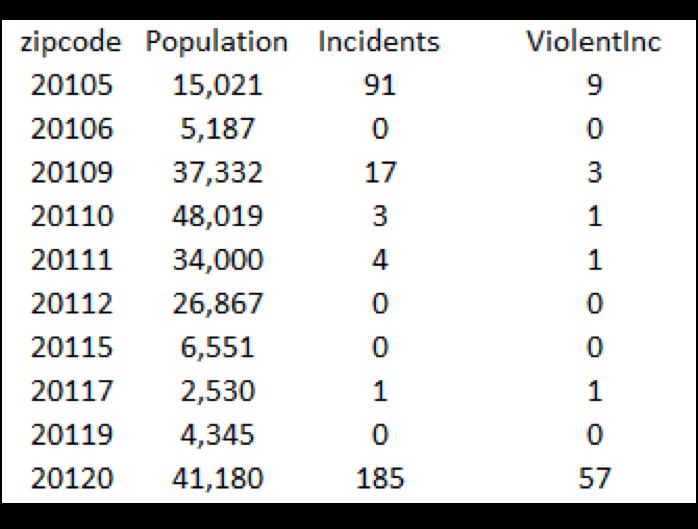
Under review as a conference paper at ICLR 2019

Figure 6: Correlation matrix of VA data set               Figure 7: Dependency between average rent
for 3 house types.                                        price across multiple zip codes and urban
                                                          planning parameters (external attributes) of
                                                          walk-score, transit-score, and crime-rate.

4.2   DATA E XPLORATION

We analyzed the correlations between various variables of the data set. Discovering co-linearity
between the data set variables and the target variable yields valuable insights about the dependent
variables that affect the rent price. Figure 6 illustrates the co-linearity between the data set attributes
in the VA data set; since zip code is a nominal attribute, there is no col-linearity between zip code
and rent price. Also, there is a strong dependency between rent and internal attributes like number
of bed/bathrooms, area space, year, and sale price. Figure 7 illustrates the correlation between
average rent price and urban planning parameters of walk/transit-score and crime-rate. The trend in
Figure 7 indicates a positive correlation between average rent and walk/transit score, and a negative
correlation between the average rent and crime rate across multiple zip codes.
Based on the plots in Figure 1 and 3, we hypothesize that there is a rent prediction model for every
house type within a zip code/similar zip codes. To test this hypothesis, we carry out the following
analysis: prior to attribute selection, to obtain a suitable representation of the data set, we apply PCA
(principle component analysis) to the 21 data set attributes. The attributes consist of ZipID (a unique
id for each house in the Zillow API), Number of bed/baths, floor size (the area of the house based
on SQF), latitude and longitude (geographical location of each house), year built (the year of house
construction), status (house type), zip code, house features (facilities in a house described by owner),
estimated rent (basic amount of rent price for each house used as a class label in the prediction task),
so forth. Since zip code and house type are nominal attributes, there is no collinearity between the
rent price and these two attributes. In addition, the results provided by the PCA technique suggests
that zip code and house type attributes should not be included in the subset of attributes used for
training the models. Rather, they should be used for clustering the data set. This is further explained
in subsection 4.4.

4.3   F EATURE S ELECTION

To identify important attributes, we apply PCA (principle component analysis) - which is a well-
known and studied method- on three subsets of data samples, each subset covering a different house
type across all zip codes in the state of VA. This is illustrated in Figure 8. Table 2 indicates the
attributes selected based on the house type, which is further explained here: unlike town house and

                                                    6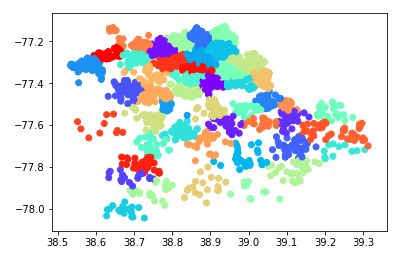
Under review as a conference paper at ICLR 2019

condo, features like HOA fee, walk/transit score show a very low variance for single family in-
stances. The higher variance of transit score, especially for condos explains the outpacing of median
appreciation rates of condos compared to single family detached-houses in large metropolitan areas
(Harney, 2017). Number of bedrooms is found to be an important feature only when house type is
single-family or town-house. Next, unlike town-house instances, average school rating is discovered
to be an important feature for both single-family and condo instances. This can be explained due
to sparsity of school rating for town-house instances in our data set. In our future work, we will
employ data mining techniques to obtain this information for town-house instances. We validated
the abovementioned strategy by training our models based on a data set including all house types,
and then based on each house type. We discovered that the latter approach leads to relatively higher
accuracy and lower prediction error.

Figure 8: The PCA plot shown separately for townhouse (TH), condo (CO), and single family (SF)
instances in all VA zip codes. The vertical axis shows the coefficients of the dominant principal
component.

Table 2: Selected Features determined by PCA technique for 3 house types (‘SF’ for Single Family,
‘TH’ for Town House, and ‘CO’ for Condo.
                              CO TH SF             Attributes
                               X     X     X           price
                                     X     X         bed/path
                               X     X     X           area
                               X     X     X          views
                               X     X     X     price per SQFT
                               X     X     X           year
                               X           X      school rating
                               X     X           days-on-zillow
                               X     X                 HOA
                               X     X          walk/transite score
                               X     X     X        crime rate

4.4   DATA C LUSTERING

Based on the statistical analysis in Figure 1, 3, and 8, first, we clustered the housing data set based
on house type and zip code attributes, to eventually learn a model for each cluster. However, we
observed that the some of the clusters are very sparse with the number of instances below 100,
which could immensely affect the ability to train the prediction models (Adomavicius & Zhang,
2012; Li et al., 2016). To increase the density of the training samples and facilitate the accuracy
of prediction models at the same time, we carried out a different strategy which is illustrated in
Figure 2, described as follows: first, we divided the data set into three groups based on the house
type attribute. We refer to these groups as status-clusters. Next, we calculated the average rent
for every zip code in each status-cluster. Furthermore, we applied K-means clustering to cluster

                                                  7
Under review as a conference paper at ICLR 2019
the content of each status-cluster based on the average-rent. Using this clustering technique, we
increased the density of the training samples.
4.4.1 P ROBLEM F ORMULATION
Given a status − clusterj ,i = (sf, th, co) where sf=single-family, th= town-house, and co=condo
with a set of observations (o1 , o2 , · · · , om ) where each observation is a di dimensional vector, K-
means clustering partitions the observations into n(n = k, h, gs.t., n
m) sets S.
Clustering the data points according average-rent implies organizing instances of similar zip codes
inside the same cluster, e.g., cluster sj . The next task is to train a model for each cluster sj (see
Figure 2): sj → Learner → fj , such that fj is a rent prediction model.
4.5 B UILDING P REDICTION M ODELS
In this study, as illustrated in Figure 2, we build rent prediction models with respect to each house
type and a subset of zip codes with similar average rent prices, using six eager and five lazy learning
algorithms. We use WEKA with a customized setting to carry out the implementation (Hall et al.,
2009). During the implementation, the dataset is split by 70:30 into train and test sets.
4.5.1 DATA PARTITIONING
In our experiments, we use 10-Fold Cross-Validation to partition the training data set into 10 equal
parts. During each round of 10 iterations, we repeat the prediction by using one of the 10 parts as
test data and the other 9 parts as training data to create a prediction model. Next, we select the model
with the best accuracy. We then evaluate the rent prediction model on the test data set that covers
30% of the entire Virginia housing data set collected from Zillow website. We select a subset of
well-known eager and lazy learning algorithms described below:
• MLP or Artificial Neural Network ANN with a single hidden layer is an eager learning
algorithm and that can approximate nonlinear functions.
• LR is a lazy learning method used in prediction and estimation of real values (like rent,
price of houses, so forth). LR can very valuable for business decisions.
• J48 is a variant of C4.5 algorithm. Unlike other lazy trees, J48 does not postpone the
prediction decision until completing the construction of the tree.
• SVM is a machine learning method that is used for both classification and regression. A
version of SVM used for regression is called Support Vector Regression.
• SMO can be implemented as a lazy or eager version.
• RF is an ensemble learning method which uses several decision trees at the training time,
and the output is the mean prediction of the decision trees. Since the algorithm brings extra
randomness into the model by searching for the best feature among a random subset of
features, it generally results in a model with high accuracy.
• LWL is used to build models that are not learnt from the entire data set. The model is learnt
through selected patterns which are created based on the query received. LWL is suitable
to generate accurate model when we have plenty of data.
• KStar is an instance-based learner. It has a good performance in the presence of noise and
on data sets with imbalanced attributes. KStar is based on the concept of clustering and
functions with entropic distance to find the similar instances (Hernández & Dayana, 2015;
p.Y & H.B, 2017).
• Lazy-DT is a learning method that for each test instance, builds the best decision tree. It’s
important advantage is avoiding decision tree problems like fragmentation and replication
(Kohavi et al., 1996).
• ML-KNN algorithm is derived from KNN. Based on experiments involving three real-
world multi-label learning problems, ML-KNN achieves higher performance compared to
some of the popular multi-label learning methods (Zhang & Zhou, 2007).
8Under review as a conference paper at ICLR 2019
• KNN is an example of instance-based learning method, which can be used for prediction
and estimation.
The important attributes determined during feature selection are used as input of the above-
mentioned models to predict the target variable rent price.
4.6 M ODEL E VALUATION
The key comparison measure used for regression analysis and model evaluation described in this
section uses two different measures: i) Mean Absolute Error (MAE) and ii) R-squared(R2). MAE
measures the accuracy of the prediction models over the test data set. R-squared (or the coefficient
of determination) is a quadratic statistical scoring rule which shows how close the actual target data
are to the fitted regression line. R-squared is used to show the variance between the predicted target
variable and the actual rent price. Hence, the lower MAE and the higher R2, the better our model fits
the data. Based on these evaluation metrics, we calculate and compare the efficacy of the produced
rent prediction models for eleven machine learning algorithms MLP, RF, LR, J48, SVM, SMO,
LWL, KStar, lazy-DT, ML-KNN, and KNN based on the hierarchical clustering method depicted in
Figure 2. For KNN’s combination function, we used simple unweighted voting for K=3, based on
Euclidean distance. The comparison of MAE and R-squared is illustrated in Table 3.
5 E XPERIMENTS AND R ESULTS
This section discusses the result of our experiments carried out to evaluate and compare the perfor-
mance of MLP, RF, LR, J48, SVM, SMO, LWL, KStar, Lazy-DT, ML-KNN, and KNN algorithms.
According to Table 3, KStar algorithm outperforms the other algorithms and shows the highest R-
squared value (close to 1 or 100%) and lowest MAE compared to other algorithms tested in this
work. Based on the overall measure of the fit of the model, we compare the best of eager methods
with that of lazy methods. Among the eager methods tested, LR and J48 show the lowest MAE that
is the highest accuracy, and LR shows the lowest variance (i.e., highest R-squared), while KNN and
KStar show the minimum variance (i.e., highest R-squared value) among the lazy methods. In ad-
dition, KStar shows the highest accuracy (i.e., lowest MAE) compared to other ML methods tested
in this work. In fact, KStar algorithm decreased the prediction error by 69%, 41%, and 8% for
single-family, town-house, and condo respectively, compared to LR method. KStar decreased the
prediction error by 71%, 55%, and 5% for single-family, town-house, and condo respectively, com-
pared to RF method. Also, KStar decreased the prediction error by 67%, 55%, and 31% for single-
family, town-house, and condo respectively, compared to J48 method. Finally, KStar decreased
the prediction error by 71%, 49%, and 6.8% for single-family, town-house, and condo respectively,
compared to KNN method. Although KStar beats all eager methods in terms of prediction accu-
racy, this is not necessarily found to be an overarching trend while comparing the remaining lazy vs.
eager methods in this work. For instance, LR and J48 show lower variance on average, compared
to lazy-DT. Based on Table 3, the low variations of MAE measure across different algorithms for
the town-house records compared to single-family and condo is happening due to skewness of the
data set: the number of single-family properties, and then condo, dominate the data set compared to
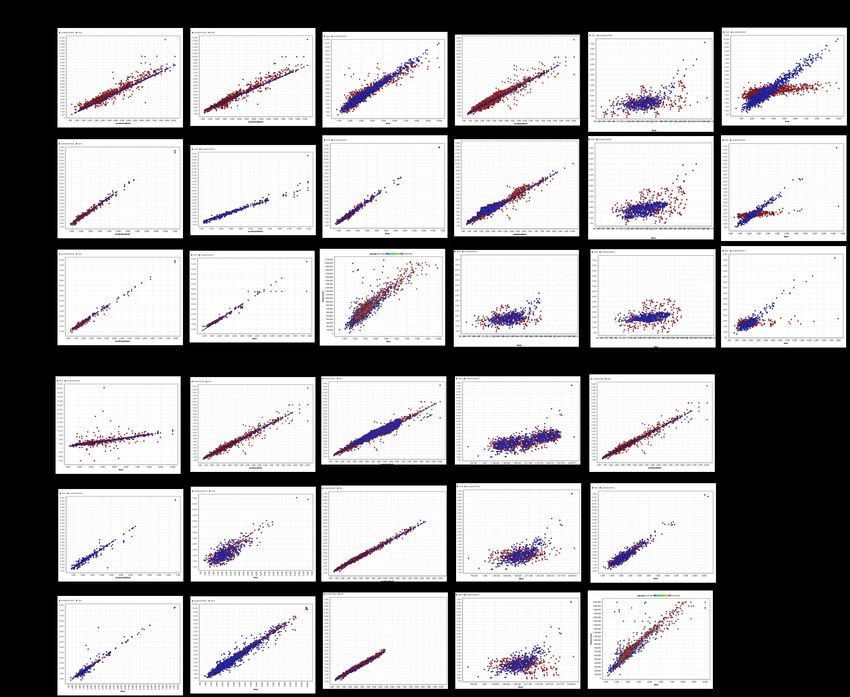
town-house records, which indicates the skewness of the data set.Figure 9 illustrates the regression
model outputs vs. the measured rent price. The results show that KStar regression model provides
the best fit. However, not all the lazy methods discussed in this work dominate all the other eager
methods in terms of variance and/or accuracy. All algorithms perform relatively well when it comes
to the town-house data. We observed that for town-house records, the performance of the learning
method LR is very close to KNN lazy learning method.
6 C ONCLUSION
Although eager methods require less memory space compared to lazy algorithms, it is not consid-
ered an outstanding advantage in the real-estate housing domain. After all, we are not dealing with
streaming data. Based on our experiments, real estate rent prices are not subject to change within
periods shorter than 6 months, hence we don’t consider this a real-time problem. Therefore, even
though lazy learning methods show to be slower in terms of execution time compared to eager meth-
ods, we are still fine with lazy methods due to their high prediction accuracy and low variance. Based
9Under review as a conference paper at ICLR 2019
Table 3: Comparison of eager vs. lazy learners for rent prediction using VA housing data set. The
values show the average evaluation measures R2 and MAE. Higher R-squared (R2) values show
lower variance, and lower Mean Absolute Error (MAE) shows higher accuracy.
Single-Family Town-House Condo
Algorithm
R2 MAE R2 MAE R2 MAE
MLP 0.58 410 0.91 105.4 0.88 152.4
RF 0.68 322.7 0.78 109.7 0.90 109.3
LR 0.79 294.1 0.96 83.37 0.90 112.7
J48 0.70 280.7 0.87 110.48 0.90 150.48
SVM 0.60 300.2 0.84 120 0.90 101.2
SMO 0.70 342.02 0.90 98.02 0.90 254.1
LWL 0.86 299.2 0.95 98.1 0.90 121.4
KStar 0.95 91.7 0.97 49.3 0.90 103.2
Lazy-DT 0.81 399.6 0.89 89.6 0.90 121.6
ML KNN 0.82 289.6 0.80 100.6 0.90 108.6
KNN 0.93 321.065 0.92 97.15 0.90 110.78
Figure 9: Predicted rent (blue) vs. the measured rent (red).
on this study, the fact that KStar algorithm outperformed the other techniques shows a unique per-
formance in dealing with noisy and imbalanced housing dataset attributes in comparison with other
Lazy learners. Furthermore, compared to other eager decision tree counterparts in this work (like
RF), J48 shows a better performance in dealing with the sparsity of data by delaying the construc-
tion of decision tree until the last step, and using known attributes to induce an accurate prediction.
In addition, LR and J48 algorithms show lower variance on average, compared to lazy-DT, which
indicates that not all the lazy methods discussed in this work dominate all the other eager methods
in terms of variance and/or accuracy.
10Under review as a conference paper at ICLR 2019
R EFERENCES
Gediminas Adomavicius and Jingjing Zhang. Stability of recommendation algorithms. acm trans-
actions on information systems :tois. 2012.
Sabyasachi Basu and Thomas G. Thibodeau. Analysis of spatial autocorrelation in house prices. the
journal of real estate finance and economics. Real Estate Finance and Economics, 1998.
Dickson. How to calculate crime rate. 2014. URL http://crimeanalystsblog.
-blogspot.com/2014/02/how-to-calculate-crime-rate.html.
Inés M. Galván, Joś M. Valls, Miguel Garcia, and Pedro Isasi. A lazy learning approach for building
classification models. International journal of intelligent systems, 2011.
Mark Hall, Frank Eibe, Geoffery Holmes, Bernhard Pfahringer, Peter Reutemann, and Ian H. Witten.
The weka data mining software: an update. acm sigkdd explorations newsletter 11.1. 2009.
Ken Harney. Condos may be appreciating faster than single-family houses. washington-
post/realestate. 2017.
Tegera Hernández and Caridad Dayana. An experimental study of k* algorithm. international journal
of information engineering & electronic business. 2015.
Haleh Homayouni, Sattar Hashemi, and Ali Hamzeh. A lazy ensemble learning method to classifi-
cation. IJCSI, 2010.
Azme Bin Khamis and Nur Kamarudin. Comparative study on estimate house price using statistical
and neural network model. International Journal of Scientific & Technology Research, 2014.
Ron Kohavi, Jormeh H. Friedman, and Yun Yeogirl. Lazy decision trees. AAAI/IAAI, 1996.
Michael Kuntz and Mark Helbich. Geostatistical mapping of real estate prices: an empirical com-
parison of kriging and cokriging. international journal of geographical information science. 2014.
John Lambert and Jessica Greenland. Is the price right? prediction of monthly rental prices in provo,
utah. 2015.
Xiang Li, Charles X. Ling, and Huaimin Wang. The convergence behavior of naive bayes on large
sparse datasets. acm transactions on knowledge discovery from data : Tkdd. 2016.
Visit Limsombunchai. House price prediction: hedonic price model vs. artificial neural network.
new zealand agricultural and resource economics society conference. 2004.
Xiaolong Liu. Spatial and temporal dependence in house price prediction. the journal of real estate
finance and economics. 2013.
Ervin Ozus, Vedia Dokmeci, Gulay Kiroglu, and Guldehan Egdemir. Spatial analysis of residential
prices in istanbul. european planning studies. 2007.
Byeonghwa Park and Jae Bae. Using machine learning algorithms for housing price prediction: The
case of fairfax county, virginia housing data. expert systems with applications. 2015.
Preema p.Y and Anita H.B. Kannada script recognitions from scanned book cover images. interna-
tional journal of applied engineering research. 2017.
Antonio Bella Sanjuán. Model integration in data mining: From local to global decisions. Doctoral
Dissertation, 2012.
Xibin Wang, Junhoa Wen, Yihoa Zhang, and Yubiao Wang. Real estate price forecasting based on
svm optimized by pso. optik-international journal for light and electron optics. 2014.
Geoffrey I. Webb. Lazy learning. encyclopedia of machine learning. springer us. 2011.
Hujia Yu and Jiafu Wu. Real estate price prediction with regression and classification. 2016.
Minling Zhang and zhi-hua Zhou. Ml-knn: A lazy learning approach to multi-label learning. pattern
recognition. 2007.
Zenep Önder, Vedia Dökmeci, and Berna Keskin. The impact of public perception of earthquake
risk on istanbul’s housing market. journal of real estate literature. 2004.
11You can also read


