An Historic Rainfall at San Juan Puerto Rico
←
→
Page content transcription
If your browser does not render page correctly, please read the page content below
An Historic Rainfall at San Juan Puerto Rico
                       Gary S. Votaw, Odalys Martinez, Amaryllis Cotto
                  Althea Austin-Smith, Felix Castro, Jose Alamo, Walter Snell

Historical Synopsis

     Fig. 1. Microwave imagery from satellite showing precipitable water at 800 pm AST July
     17, 2013. Approximate location of the tropical wave, as analyzed by the Ocean Prediction
     Center (OPC) is shown by the white line.

A high amount of moisture associated with an otherwise ordinary looking tropical wave passed
through the Lesser Antilles on Wednesday, July 17, 2013 (Fig. 1). The forecaster on duty late in
the afternoon at the National Weather Service in San Juan Puerto Rico had become concerned
that showers were going to arrive earlier than the ongoing forecast was anticipating and that they
may be enhanced by orographic effects over eastern Puerto Rico. A flash flood watch was issued
by 656 pm AST, to be in effect beginning at midnight that night and lasting through the
following afternoon. The forecast included 1 to 3 inches of rainfall and local amounts to 5
inches. Later that night the trend in concern continued. The early morning discussion stated that
the large amount of showers could be expected to produce “2 to 3 inches, with higher amounts of
up to 5 inches, especially across portions of eastern Puerto Rico and the Cordillera Central.”
There was potential for afternoon heating to cause flooding rains to spread westward across
Puerto Rico, so the flash flood watch was updated to include the entire island.

No unusual amount of wind had developed in the wave, and its fast forward speed (about 20
knots) suggested that it would not easily develop a closed center. The Hurricane Prediction
Center at Miami was not issuing statements suggesting that this wave might develop within the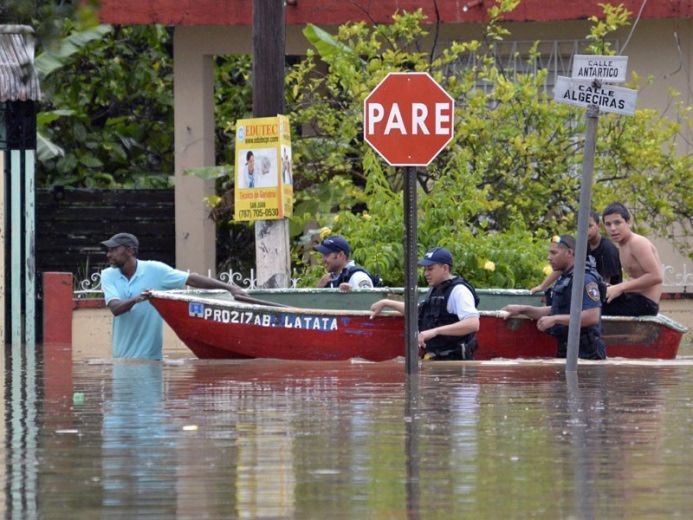
next couple days. Figure 2 shows the OceanSAT image from the satellite passing over Puerto
Rico around midnight. While there may have been a few localized winds approaching 30 knots
(red) north of the main island there was little concern about wind. Buoys in the area were not
recording velocity that strong actually occurring on the water surface, and there was no
indication that a cyclonic closed low was developing.

Fig. 2. OceanSAT satellite image of winds over the Caribbean Sea and the Antilles.

The routine upper air sounding (Fig. 3) completed at the Weather Forecast Office (WFO) San
Juan during Wednesday evening showed that 29 knots of wind had developed only 2,000 feet
above ground. While this pointed out that this was a strong wave the associated moisture was
still the larger concern, with 2.28 inches of precipitable water on that sounding and it was
expected to rise slightly more by morning.
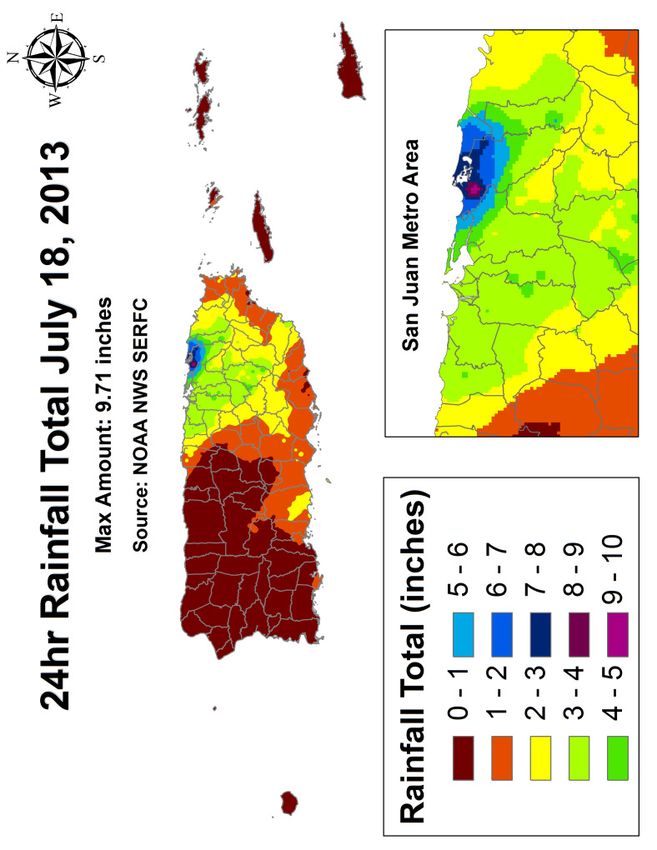
Fig. 3. Upper air sounding at 00z July 18, 2013 (800 pm AST, July 17).

Fig. 4 Upper air sounding at 12z (800 am AST) on July 18, 2013.
On Thursday morning, the 18th, convective showers were moving onshore and were moving
towards the northwest. The morning sounding at WFO San Juan (Fig. 4) showed winds from the
southeast above 300 ft MSL. This indicated that the trough axis was somewhere northwest of
San Juan but it was also likely that the wave was slowing down. After OPC analyzed all
available data the wave was indeed thought to be slightly west and northwest of San Juan. The
trough provided low level convergent flow while upper level was divergent, ideal for developing
thunderstorms.

Heavy showers and thunderstorms had occurred during that Wednesday night but were not
widespread. Late in the morning on Thursday (the 18th) convection was increasing, especially
across San Juan Metro. San Juan Luis Munoz Marin International Airport already had almost an
inch of rainfall (0.85) by 1100 am but was unprepared for what was to come. The next four hours
would bring over 7½ more inches of rainfall (Fig. 5). Unofficially, the 2.89 inches recorded
between noon and 100 pm was highest hourly total ever recorded at this airport (since 1967).

Fig. 5. Recorded rainfall at the San Juan Airport, for September 18, 1989 and July 18, 2013.

When the afternoon had finished 9.23 inches of rain had fallen at the airport, breaking the
previous record of 8.84 inches which occurred as Hurricane Hugo came onshore on September
18, 1989. In comparison to the September 18 event with Hugo, the rainfall on July 18 occurred
more quickly and later in the day. The only day on which more rainfall was observed in the San
Juan area, back to 1898, was the 9.67 inches on August 15, 1944. Incidentally, the day with the
third most rainfall ever at the airport was on September 10, 1996, when Hurricane Hortense
passed over the southwest corner of the island. That rainfall also occurred over a longer period.
From a perspective of how often this should be expected to occur, Table 1 shows the frequency
of 24 hour precipitation at the San Juan International Airport, suggesting this was about a 50 year
event. That is not to say it cannot happen again tomorrow, only that is how often it can be
expected when a much longer period is considered. Unofficially, another record was broken, that
of the highest one-hour rainfall recorded at the airport, of 2.89 inches.

  Average           Probability of occurrence in any                   Precipitation frequency
 recurrence        given year (and percent chance of               estimates with 90% confidence
   (years)              occurring in that year)                          intervals (in inches)
         5                        1 in 5 (20%)                            5.66   (5.04-6.39)
         10                      1 in 10 (10%)                            6.77   (6.00-7.62)
         25                       1 in 25 (4%)                            8.30   (7.35-9.36)
         50                       1 in 50 (2%)                            9.50   (8.38-10.7)
      100                        1 in 100 (1%)                           10.80   (9.45-12.2)
      200                       1 in 200 (0.5%)                          12.00   (10.5-13.7)
      500                       1 in 500 (0.2%)                          13.80   (12.0-15.8)
     1000                       1 in 1000 (0.1%)                         15.20   (13.2-17.6)

Table 1. 24 hour precipitation frequency and probability of recurrence, based on San Juan
International Airport.

           Probability of                          Precipitation frequency for selected
           occurrence in                           90% confidence intervals (in inches)
 Average any given year
recurrence (and percent
  (years)     chance of               1 Hour             2 Hours         3 Hours           6 Hours
             occurring
            in that year)
     5          1 in 5 (20%)      2.15 (1.98-2.33)   2.70 (2.47-2.92) 2.95 (2.69-3.22) 3.89 (3.48-4.34)
    10         1 in 10 (10%)      2.31 (2.12-2.51)   2.95 (2.69-3.17) 3.26 (2.96-3.55) 4.42 (3.94-4.94)
    25          1 in 25 (4%)     2.51 (2.30-2.73) 3.25 (2.96-3.50) 3.62 (3.29-3.96) 5.09 (4.47-5.71)
    50          1 in 50 (2%)     2.65 (2.42-2.89) 3.45 (3.13-3.75) 3.89 (3.51-4.29) 5.58 (4.86-6.31)
    100        1 in 100 (1%)     2.76 (2.51-3.04) 3.65 (3.29-4.00) 4.14 (3.70-4.60) 6.06 (5.23-6.93)
    200       1 in 200 (0.5%)    2.87 (2.61-3.19) 3.83 (3.43-4.25) 4.38 (3.88-4.93) 6.54 (5.57-7.56)
    500       1 in 500 (0.2%)    3.01 (2.69-3.37) 4.06 (3.59-4.56) 4.69 (4.10-5.34) 7.18 (5.99-8.40)
   1000       1 in 1000 (0.1%) 3.10 (2.77-3.50) 4.23 (3.69-4.79) 4.91 (4.25-5.67) 7.64 (6.33-9.05)

Table 2. Precipitation Frequency and probability of recurrence, based on San Juan International
Airport for 1, 2, 3 and 6 hours.

Usually in a tropical environment the lower part of the atmosphere is conditionally unstable,
meaning that layer requires some force acted upon it to become unstable. Often, an oceanic air
mass passing over an island becomes unstable due to the added heat it acquires from the daytime
heating of the ground it passes over. We might then have a “streamer” of showers downwind of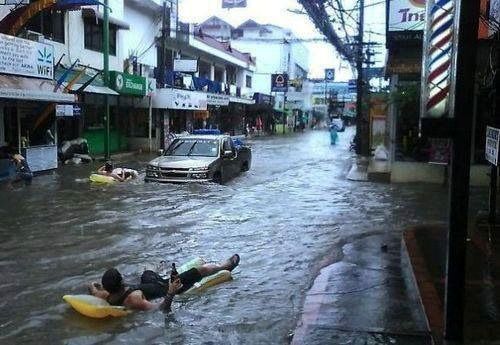
that island. Usually the showers are not extremely heavy and have a limited vertical extent. One
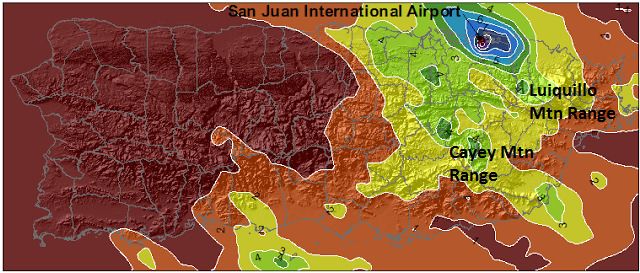
curious aspect of the spatial distribution of the rainfall in this event (Fig. 6) is that the highest
rainfall occurred downwind of both the Cayey and Luquillo Mountain Ranges. It is probable that
the mountains played a role in repeated development of convection over the same areas on this
day, but, it is difficult if not impossible to confirm this process did occur or would in the future.
Due to thick clouds and frequent rain the airport also set a record for the coolest July 18th.
Fig. 6. Total rainfall overlaid onto a topographic map of mainland Puerto Rico.
New Records
New Previous
Location Record Type Date/Year Date/Year
Record Record
Luis Muñoz Marín 24 hr maximum
July 18th, 2013 9.23" 2.17" 1969
Intl Airport rainfall
San Juan Metro 24 hr maximum
July 18th, 2013 9.23" 3.19" 1950
Area rainfall
Wettest day on September 18th,
Luis Muñoz Marín
record for any July 18th, 2013 9.23" 8.84" 1989 (Hurricane
Intl Airport
given day Hugo)
2nd wettest day on
San Juan Metro August 15th,
record for any July 18th, 2013 9.23" 9.67"
Area 1944
given day
Luis Muñoz Marín Lowest maximum
July 18th, 2013 82ºF 83ºF 1995
Intl Airport temperature
San Juan Metro Lowest maximum
July 18th, 2013 82ºF 82ºF 1950
Area temperature (tied)
Table 3. New official climatology records set for San Juan International Airport.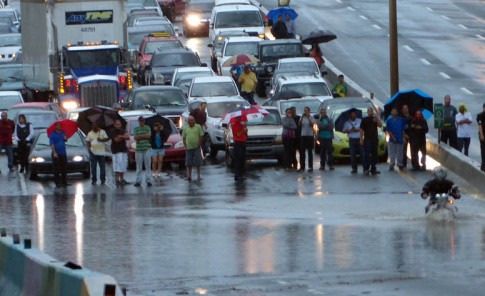
Fig. 7. Spatial distribution of rainfall on July 18th, with greatest rainfall occurring over San Juan
Metro (inset).
Spatially, the heaviest rain did fall on eastern Puerto Rico (Fig. 7). Contrary to concerns, heavy
rain did not develop on the west end of the island. This was due in part to the thick clouds and
lack of sunshine produced by ongoing convection over the east, and in part because outflow at
high levels from convection was causing subsistence over the west.

Lightning

Almost 3,500 lightning strikes were recorded within 40 km of the airport on this day in the
EarthNetworks web site (http://weather.weatherbug.com/weatherbug-professional/about-
weatherbug). It was so often and so close that some wondered if it was an unusual amount of
lightning or that it was more fierce than normal. Even Saharan dust, which was following closely
behind this system, was suspected to be playing a role. Or, was the lightning appropriate given
the storm intensity? It is well known that the number of lightning strikes can be closely related to
the intensity of rain. The ratio of rainfall to lightning has been studied at several locations. One
of these (Tapia, Smith & Dixon, 1997) was done across east-central Florida during 1992-1993.
In that study, the number of cloud-to-ground lightning flashes was counted and correlated with
how much rain fell. In Figure 8 below, rainfall rate (vertical axis) and the number of lightning
strikes (horizontal) are compared in 5-minute intervals. On a few of these days a high rainfall to
lightning ratio (High RLR), represented by the blue line, was recorded on a few days in Florida
during these thunderstorms. Heavy rain fell on these days but with relatively few lightning
strikes. For most of their studied days, less rain and more lightning was noted (red Low RLR
line). The median RLR for their study is the orange line. For the actual ratio for the storms in San
Juan on July 18, the raw data is rather noisy (green) line. There were no 5-minute periods when

Fig. 8. Ratio of rainfall to number of lightning strikes, comparing rainfall recorded every 5
minutes with the number of lightning strikes over the same period.
lightning strikes numbered between 15 and 22 so no measured data is shown there. The black
trend line (derived from the measured data) shows that the RLR for July 18 in San Juan was
somewhere in the middle, between the extremes observed in Florida. Though it did not seem so,
for the amount of rain that occurred, the lightning activity was appropriate or possibly even
slightly below what might have been expected!

An infra-red image during the peak of the convection (Fig. 9) shows some yellows over San Juan
Metro, indicating that temperatures at the top of clouds were in excess of -80C. No
environmental conditions that cold were measured on the TJSJ sounding that morning and the
coldest it did measure (-73.5C) was at 17,138 m MSL (56,227 ft MSL), higher than Figure 4
shows. These convective towers were likely exceeding even this height and it is not unusual for
colder temperatures to be measured at the tops of extreme thunderstorms.

Fig. 9. Infra-red satellite image over Puerto Rico at 116 pm AST. The colors correspond to the
temperature at cloud top. They are located where particularly strong thunderstorms were located
at the time, and are usually located where intense lightning has been occurring.
Warnings and Advisories Issued

                                   Flash Flood Warnings
Begin Time      Until                         Municipalities (or portions of)
1226 pm         300 pm      Canovanas, San Juan, Carolina, and Loiza
1235 pm         300 pm      Dorado
1252 pm         315 pm      Caguas, Guaynabo, Gurabo, San Juan, Tujillo Alto, and Aguas
                            Buenas
140 pm          430 pm      Bayamon, Guaynabo, Naranjito, San Juan, Toa Alta, Toa Baja, and
                            Catano
331 pm          630 pm      Canovanas, Trujillo Alto, Carolina, Rio Grande, and Loiza
                         Urban and Small Stream Flood Advisories
Begin Time      Until                           Municipalities (or portions of)
1146 am         245 pm      Caguas, Canovanas, Guaynabo, Gurabo, San Juan, San Lorenzo,
                            Trujillo Alto, Yabucoa, Aguas Buenas, Carolina, Rio Grande, and
                            Loiza
1229 pm         1245 pm     Barranquitas, Bayamon, Caguas, Cayey, Cidra, Coamo, Comerio,
(corrected at   (corrected  Naranjito, Salinas, Santa Isabel, Aguas Buenas, and Aibonito
1250 pm         at 345 pm)
219 pm          515 pm     Coamo, Guayanilla, Jayuya, Juana Diaz, Orocovis, Penuelas,
                           Ponce, Santa Isabel, Utuado, Villalba, and Adjuntas
229 pm          530 pm     Canovanas, San Juan, Trujillo Alto, Carolina, and Loiza
313 pm          615 pm     Canovanas, Cieba, Naguabo, San Juan, Trujillo Alto, Fajardo,
                           Carolina, Luquillo, Rio Grande, and Loiza
423 pm          715 pm     Canovanas, Naguabo, Juncos, Las Piedras, Maunabo, Patillas, San
                           Lorenzo, Yabucoa, and Humacao
                                Special Marine Warnings
1156 am         130 pm     Coastal waters of northern Puerto Rico out 10 nm, Atlantic waters
                           of Puerto Rico and USVI from 10 nm to 19.5N
446 pm          545 pm     Coastal waters off of southeast Puerto Rico
951 pm          1115 pm    Coastal waters of northern Puerto Rico from Arecibo west to
                           Aguadilla and out 15 nm
Reports and Damage
Location Time Report
Hatillo/ 1100 am Lightning struck a balcony and knocked down a power line in Barrio
Camuy Pajuil
Ponce 1100 am Lightning broke light post in Barraida Clausell No. 19 Calle
Vega Baja 1110 am Tree down over highway 688, street flooded in front of Puma Gas
Station at Highway 2
Vega Alta 1112 am Flash flood - Rio Machchal and Ponderosa out of their banks, trees
down at Highway 2 near Vista Santa Rosa sector, and at Highway 686
Vega Alta 1116 am Various streets in Barrio Ponderosa were flooded, Highway 2 flooded
in front of clinic
Carolina 1140 am Heavy rain, 0.50-0.74 inches in 15 minutes at Los Colobos
Carolina 1203 pm Heavy rain, 1.00-1.24 inches in 15 minutes near Los Colobos
Carolina 1240 pm House flooded at Villa Mar sector and Road Mar Del Norte
Vega Alta 1240 pm Highway 2 closed due to flooding
San Juan 119 pm Kennedy Ave reported flooded
San Juan 135 pm House reported flooded at Cacique Street in Ocean Park sector
Guaynabo 150 pm San Patricio Shopping Center was flooded
San Juan 200 pm House flooded at Antarctica Street in Puerto Nuevo sector
Yabucoa 200 pm Mudslide in Barrio la Pica
Vega Alta 200 pm Rio Cibuco out of its banks and flooding roads 620 and 647
San Juan 210 pm House flooded in Betances Street at Villa Palmeras sector
Carolina 230 pm Isla Verde Ave flooded and impassable
Carolina 244 pm Roberto Clemente Ave flooded in front of Julia de Burgos Park
Guaynabo 259 pm Tabonucco Ave near San Patricio Mall flooded at Longhorn Restaurant
San Juan 259 pm Barrio Las Monjas in Hato Rey sector flooded
Vega Alta 300 pm Highways 620 at Fatima, 677 at Cadelaria, 647 at Vega Alta, 667 and
675 at Bajura, 690 and 2 in Sabana
Naguabo 356 pm Flooded Highways 31 in La Pitina sector, and Exit 22 on Highway 53
San Juan 400 pm Many streets flooded and impassable at Ocean Park sector
Yabucoa 415 pm Flash flood
Las Piedras 530 pm Flash flood - Barrio Tejas reported torrential rainfall (3.00 inches)Conclusion
In recorded weather back to 1898, only
August 15, 1944, when the U.S. Weather
Bureau office was located in Old San Juan,
saw more rain than this day in the metro
area. This tropical wave placed San Juan in
a prime location for streamer showers to
build into monster thunderstorms with ultra-
intense lightning and torrential rain. Actual
recorded rainfall amounts were higher than
initial forecasts, but the warnings issued by
WFO San Juan were timely and on target.
This was an extraordinary day for the San
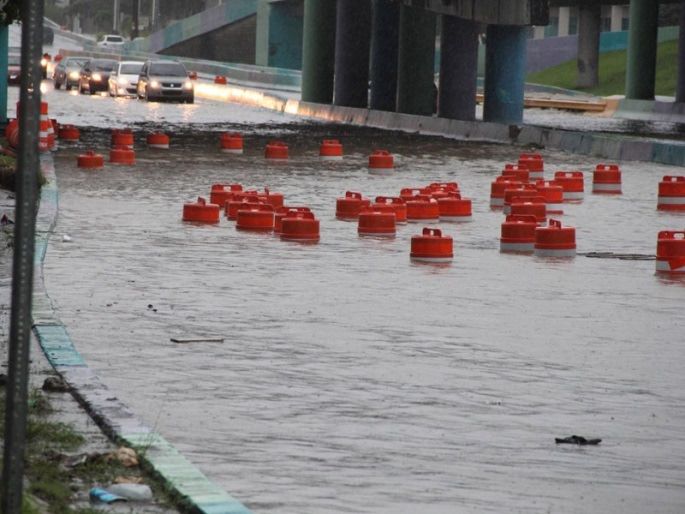
Juan Metro area. It was estimated that
more than $1,000,000 in property damage
resulted from the 3 to 5 inches of rain
across most of the area, with a maximum
well over 9 inches at and around the
airport. Countless hours of time for
people were lost as they became stranded
by flooding waters, blocked from going
where they needed to, and business lost
from flooding. For those who were only
inconvenienced, driving only a few miles
required hours on the highway.
The streaming effect enhanced instability
downwind from the Luquillo Mountain Range
and the Cayey Mountain Range. Coupled
with proximity of the tropical wave,
divergence aloft, and very high moisture, the
streamers repeatedly developed very efficient
rain producing thunderstorms across San Juan
Metro. The lightning, while extreme, was
essentially what can be expected with this
much rainfall.You can also read