An initial outlook at the austral summer 2018- 2019 sea-ice forecasts in the Southern Ocean
←
→
Page content transcription
If your browser does not render page correctly, please read the page content below
An initial outlook at the austral summer 2018-
2019 sea-ice forecasts in the Southern Ocean

         Coordinating Seasonal Predictions of Sea Ice
              in the Southern Ocean for 2017-2019

       F. Massonnet, P. Reid, J. Lieser, C. M. Bitz, J. Fyfe, W. Hobbs

                            December 12, 2018

                             Primary contact:

               francois.massonnet@uclouvain.be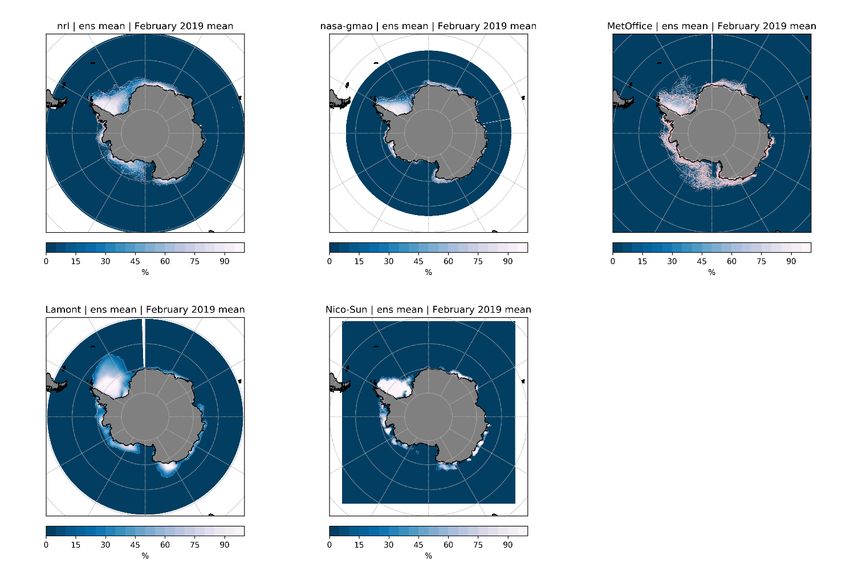
The Sea Ice Prediction Network South
The Sea Ice Prediction Network South (SIPN South) is an international project
endorsed by the Year of Polar Prediction (YOPP). Its goal is to make an initial
assessment of the ability of current systems to predict Antarctic sea ice globally and
regionally, with a focus on the summer season. The project has three strategic
objectives:

          1. Provide a focal point for seasonal outlooks of Antarctic sea ice (winter
              and summer), where the results are exchanged, compared, discussed
              and put in perspective with those from the Arctic thanks to interactions
              within the (Arctic) SIPN,
          2. Provide news and information on the state of Antarctic sea ice, highlight
              recent published research, report ongoing observational campaigns and
              disseminate upcoming events (conferences, workshops, webinars, et
              cetera),
          3. Coordinate a realistic prediction exercise targeting austral summer
              2019, in conjunction with the Year Of Polar Prediction (YOPP)’s Special
              Observing Period that will take place in November-February 2018-2019.

We remind the reader that SIPN South is not an operational forecasting exercise. A
brief assessment of forecast skill was performed in Massonnet et al. (2018) for the
predictions of February 2018 collected last year.

Forecasting sea ice during austral summer 2018-2019
Austral summer 2018-2019 will be particularly rich in terms of Antarctic observations,
as the Year Of Polar Prediction Special Observing Period is taking place between
November 16th, 2018 and February 15th, 2019. Since the inception of SIPN South, it
was decided to align a prediction exercise with this Special Observing Period. We
issued a call on October 31st, 2018, to collect forecasts covering the period December
1st 2018-February 28th 2019.

So far we have received 10 submissions and would like to thank all contributors
for their participation. We expect two additional submissions within the next days.
These new submissions will be displayed in future reports but, in any case, they will
not use data past December 1st. We take note that requesting contributions for the
1st of the month is not ideal for those groups producing monthly forecasts initialized
at the beginning of each month, and will change our guidelines next year accordingly.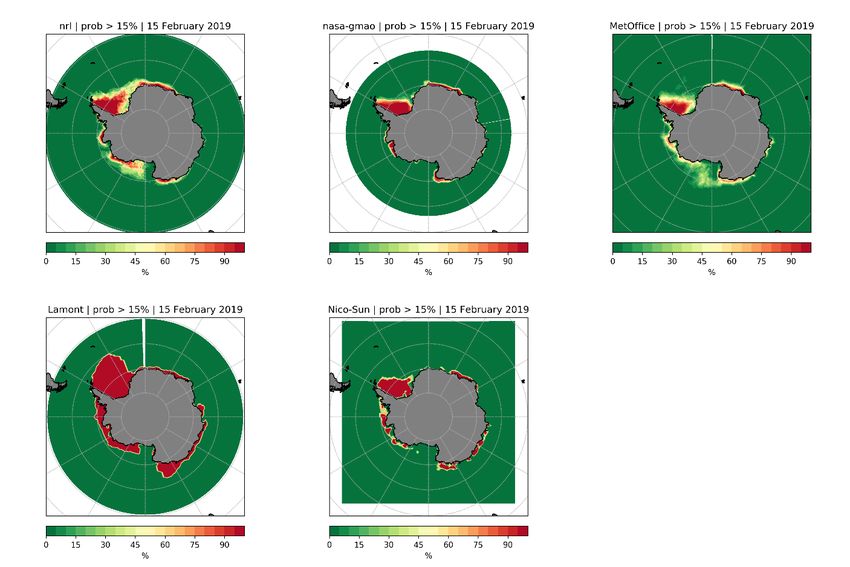
We asked contributors to provide, in order of descending priority, (1) the total
Antarctic sea-ice area (“SIA”) for each day of December-February 2018-2019, (2) the
sea-ice area per 10° longitude bands (“rSIA”) for each day of December-February
2018-2019 and (3) the sea-ice concentration (“SIC”) for each day of December-
February 2018-2019. All contributors were able to submit (1), four submitted (1) and
(2), and four submitted (1), (2) and (3). Two submissions consisted in monthly mean
forecasts. These forecasts were interpolated to daily resolution in order to facilitate
intercomparisons. Seven groups used fully coupled dynamical models and three
groups used a statistical model trained on past data.
Table 1. Information about contributors to the summer 2018-2019 coordinated sea ice forecast experiment.
Contributor Short name Forecasting method Nb. of Initialization Diagnostics
name (in figures) forecasts date provided
1 Naval Research 9 SIA + rSIA + SIC
nrl Coupled dynamical model Oct. 31st, 2018
Lab
2 Nico Sun Nico-Sun Statistical model 3 Nov. 30th, 2018 SIA + SIC
3 NASA-GMAO nasa-gmao Coupled dynamical model 10 Nov. 27th, 2018 SIA + SIC
4 FIO-ESM FIO-ESM Coupled dynamical model 1 Nov. 1st, 2018 SIA
5 ECMWF ecmwf Coupled dynamical model 50 Dec. 1st, 2018 SIA + rSIA
6 1 SIA + rSIA + SIC
Lamont Sea Ice
Lamont Statistical model Oct. 31st, 2018 (monthly,
Group
interpolated daily)
7 1 SIA
Alek Petty Petty-NASA Statistical model Nov. 30th, 2018 (monthly,
interpolated daily)
8 Modified- 20 SIA
Modified CanSIPS Coupled Dynamical Model Nov. 30th, 2018
CanSIPS
9 Met Office MetOffice Coupled Dynamical Model 42 Nov. 25th, 2018 SIA + rSIA + SIC
10 CMCC CMCC Coupled Dynamical Model 50 Nov. 1st, 2018 SIA
Circumpolar sea-ice area
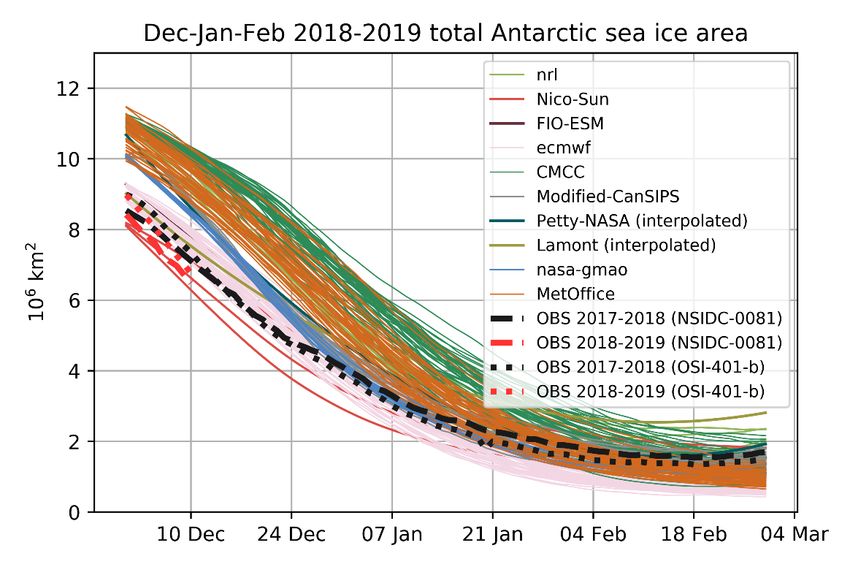
Fig. 1 shows the total sea-ice area (SIA) forecasted for each day of December-
January-February 2018-2019. We stress that SIA is not a very physical diagnostic, but
it gives a first impression on how the forecasts behave. In this figure, we have also
plotted for reference the sea-ice area from two observational references, the NSIDC-
0081 product (Maslanik and Stroeve, 1999) and the OSI-401-b product (Tonboe et al.,
2017). The SIPN South forecasts appear to be biased high at the time of initialization,
for reasons that will be investigated later on. The summer minimum is predicted to
occur later than the observed minimum of last year (Fig. 2). However, last year, most
forecasts also had their minimum later than the minimum that was actually observed.Figure 1. Total (circumpolar) Antarctic sea ice area of the 10 forecasts for each day
of December-February 2018. The black dashed lines are two observational
references (Maslanik and Stroeve, 1999; Tonboe et al., 2017) for last year and the
red lines for the first ten days of December 2018.
Figure 2. Timing of the seasonal (February) Antarctic minimum sea-ice area of the
forecasts. Two observational references (Maslanik and Stroeve, 1999 and Tonboe et
al., 2017) are shown for last year. To filter the effects of synoptic variability on total
sea-ice area, the minimum was determined from a quadratic fit of the daily February
sea-ice area time series.Spatial information
Five groups submitted the spatial information of daily sea-ice concentration for each
day of December-February 2018-2019. Groups provided several members (from 1 to
50) in order to sample uncertainty associated to the (unpredictable) evolution of the
climate system, so that each member of a given model could be seen as a possible
realization of that model. Fig. 3 displays the ensemble mean of monthly mean sea-ice
concentration for February 2019, together with the sea-ice edge lines (15% sea-ice
concentration contours) for each member. Sea-ice presence is forecasted in the
Weddell Sea along the Antarctic Peninsula in all contributions. This is a region where
the ice is climatologically present. There is high inter-model uncertainty regarding the
presence of ice in the Ross Sea in February 2019. Last year, the NASA-GMAO correctly
predicted a massive retreat of sea ice in that region, which will again be free of ice
according to that prediction system.
Figure 3. Ensemble mean of February 2019 monthly mean sea ice concentration, as forecasted by the five
groups that submitted daily sea ice concentration information. The very thin salmon lines are the ice edge
position for each forecast member, determined as the 15% contour line of the monthly mean sea ice
concentration for the member.Figure 4. Probability of ice presence for the 15th of February 2019, as forecasted by the five groups that submitted daily sea ice concentration information. The probability of presence corresponds to the fraction of ensemble members that simulate sea ice concentration larger than 15% in a given grid cell, for that day. A dynamic animation of that figure for all 28 days of February is available here. The maps of ensemble February mean sea-ice concentration (Fig. 3) are useful to appreciate the expected average conditions that could prevail in February, but are difficult to interpret for potential final users of the forecasts. Therefore, we also show the daily probability of sea-ice presence (Fig. 4; a dynamic animation of this figure is available here). Green pixels are those where the ice is extremely unlikely to be present, while red ones are those where the ice is extremely likely to be present. From the forecasts, it can be noted that strategic locations like Prydz Bay (75E, 70S) or the north-western tip of the Antarctic Peninsula are likely to be accessible during February.
Next steps
After February 2019, we will evaluate the forecasts with two observational references.
A more detailed analysis of this first exercise will be published in March 2019.

Scripts and data availability
The data presented in this report and the scripts used to generate figures can be
retrieved and reproduced by cloning the following Git project:

             https://github.com/fmassonn/sipn-south-public/

                           Branch master, commit
                 1e9950070f19a6083ad4a1e29b9f05ce9cf6dbdd

List of contributors
Contributor long name   Contributor   Contributors
                        short name
Naval Research Lab      nrl           Joe Metzger, Neil Barton, Michael Phelps
Nico Sun                Nico-Sun      Nico Sun
NASA-GMAO               nasa-gmao     Richard Cullather, Anna Borovikov, Eric Hackert, Robin Kovach,
                                      Jelena Marshak, Andrea Molod, Kazumi Nakada, Steven
                                      Pawson, Max Suarez, Yury Vikhliaev, Bin Zhao
FIO-ESM                 Qi Shu        Fangli Qiao, Zhenya Song, Xunqiang Yin, Yajuan Song
ECMWF                   Steffen
                        Tietsche
Lamont Sea Ice Group    Lamont        Xiaojun Yuan, Cuihua Li
Alek Petty              Petty-NASA    Petty-NASA
Modified CanSIPS        Modified-     Michael Sigmond, Bill Merryfield, Woosung Lee, Alan Dirkson
                        CanSIPS
Met Office              MetOffice     Ed Blockley, GloSea5 Seasonal Forecast team
CMCC                    CMCC          Andrea Borrelli, Antonella Sanna

References
       Maslanik, J. and J. Stroeve, 1999, updated daily. Near-Real-Time DMSP SSMIS Daily Polar
Gridded Sea Ice Concentrations, Version 1. [NSIDC-0081]. Boulder, Colorado USA. NASA National
Snow

       Massonnet, F., P. Reid, J. L. Lieser, C. M. Bitz, J. Fyfe, W. Hobbs (2018). Assessment of
February 2018 sea-ice forecasts for the Southern Ocean. https://eprints.utas.edu.au/27184/
Tonboe, R., J. Lavelle, R. H. Pfeiffer and E. Howe, 2017. Product User Manual for OSI SAF Global
Sea Ice Concentration (Product OSI-401-b). http://osisaf.met.no/docs/osisaf_cdop3_ss2_pum_ice-
conc_v1p6.pdf [Accessed May 30th, 2018]
To know more about SIPN South:
Website:
http://acecrc.org.au/sipn-south/
EGU Cryosphere blog article on SIPN South:
https://blogs.egu.eu/divisions/cr/tag/sipn/
Video summarizing SIPN South’s first experiment:
https://www.youtube.com/watch?v=MUeWapsdSwQ
Full report of the first experiment:
Massonnet, F., P. Reid, J. L. Lieser, C. M. Bitz, J. Fyfe, W. Hobbs (2018). Assessment of
February 2018 sea-ice forecasts for the Southern Ocean. https://eprints.utas.edu.au/27184/You can also read