An interactive atlas for marine biodiversity conservation in the Coral Triangle
←
→
Page content transcription
If your browser does not render page correctly, please read the page content below
Earth Syst. Sci. Data, 11, 163–174, 2019
https://doi.org/10.5194/essd-11-163-2019
© Author(s) 2019. This work is distributed under
the Creative Commons Attribution 4.0 License.

        An interactive atlas for marine biodiversity conservation
                           in the Coral Triangle
                 Irawan Asaad1,2 , Carolyn J. Lundquist1,3 , Mark V. Erdmann4 , and Mark J. Costello1
                        1 Instituteof Marine Science, University of Auckland, Auckland, New Zealand
                                   2 Ministry of Environment and Forestry, Jakarta, Indonesia
                        3 National Institute of Water & Atmospheric Research, Hamilton, New Zealand
                     4 Conservation International-Asia Pacific Marine Programs, Auckland, New Zealand

                                  Correspondence: Irawan Asaad (i.asaad@auckland.ac.nz)

                                    Received: 9 July 2018 – Discussion started: 10 August 2018
                      Revised: 16 December 2018 – Accepted: 18 December 2018 – Published: 30 January 2019

       Abstract. An online atlas of the Coral Triangle region of the Indo-Pacific biogeographic realm was developed.
       This online atlas consists of the three interlinked parts: (1) Biodiversity Features; (2) Areas of Importance for
       Biodiversity Conservation; (3) recommended priorities for Marine Protected Area (MPA) Network Expansion
       (http://www.marine.auckland.ac.nz/CTMAPS). The first map, Biodiversity Features, provides comprehensive
       data on the region’s marine protected areas and biodiversity features, threats, and environmental characteris-
       tics. The second provides spatial information on areas of high biodiversity conservation values, while the third
       map shows priority areas for expanding the current Coral Triangle MPA network. This atlas provides the most
       comprehensive biodiversity datasets that have been assembled for the region. The datasets were retrieved and
       generated systematically from various open-access sources. To engage a wider audience and to raise participation
       in biodiversity conservation, the maps were designed as an interactive and online atlas. This atlas presents repre-
       sentative information to promote a better understanding of the key marine and coastal biodiversity characteristics
       of the region and enables the application of marine biodiversity informatics to support marine ecosystem-based
       management in the Coral Triangle region.

1   Introduction                                                   lated fields (e.g., genomics, oceanography, climatology, evo-
                                                                   lution) to foster better analyses and interpretations (Reich-
The advancement of internet technology has led to the devel-       man et al., 2011; Costello et al., 2013).
opment of marine biodiversity informatics, namely informa-            There has been massive improvement in online biodiver-
tion technologies that are employed to support the manage-         sity databases covering species names (e.g., WoRMS; Horton
ment of data and information on marine biodiversity (Bisby,        et al., 2016), species occurrence records (e.g., GBIF; GBIF,
2000; Heidorn, 2011; Parr and Thessen, 2018). They enable          2018), OBIS; OBIS, 2015), species ranges (e.g., Map of Life:
people to freely access primary and secondary data over on-        Jetz et al., 2012, AquaMaps; Kaschner et al., 2016), species
line systems, promote integration of data across datasets, and     protection status (e.g., IUCN Redlist; UNEP-WCMC, 2015),
facilitate collaboration between parties (Costello and Van-        biodiversity and fisheries-related data (e.g., Sea Around Us;
den Berghe, 2006). Publicly available biodiversity informa-        Pauly and Zeller, 2015), and taxa specific information (e.g.,
tion is important for engaging the public and policymakers in      FishBase; Froese and Pauly, 2016, AlgaeBase; Guiry and
the addressing of global issues that threaten ecosystem ser-       Guiry, 2018, and sea turtles; Kot et al., 2015) that are man-
vices and functions such as biodiversity loss, climate change,     aged, curated, and supported by international projects and
habitat destruction, and overfishing (Costello, 2009). Inte-       initiatives. However, the culture of data publishing is still a
gration of data across disciplines is increasingly imperative,     concern (Costello et al., 2013). Less than 1 % of ecological
as biodiversity research requires interactions with other re-

Published by Copernicus Publications.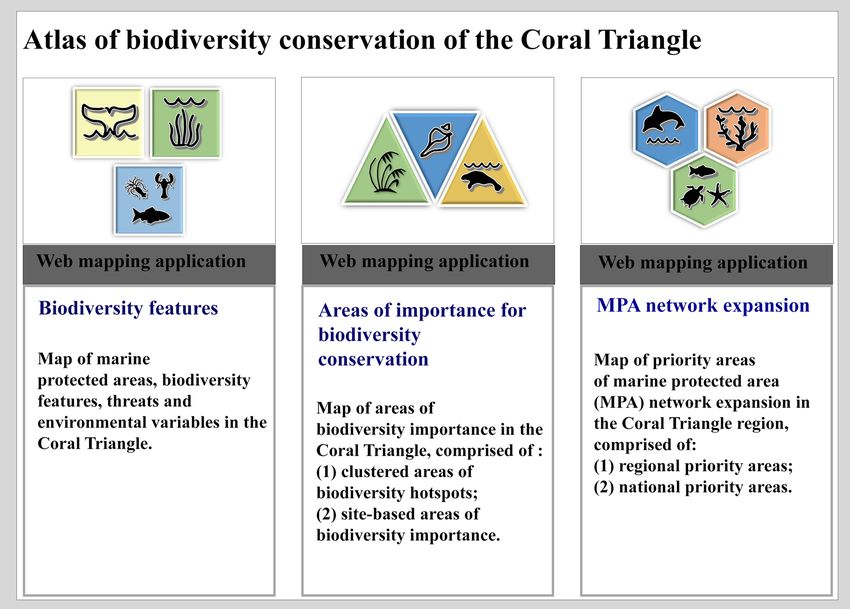
164                                                                          I. Asaad et al.: Atlas for biodiversity conservation

data is accessible after publication (Reichman et al., 2011)        tween the Indian Ocean and Pacific Ocean and a global fo-
and more than 57 % of the papers in environmental biol-             cus for marine biodiversity conservation due to its superlative
ogy publications examined in a 2011 review had not released         species richness and endemicity. This region is considered to
their data (Alsheikh-Ali et al., 2011).                             contain the world’s highest number of shallow-water reef-
   Biodiversity informatics is expected to grow exponen-            building coral species (Veron et al., 2009), reef fishes (Allen,
tially. Software, infrastructure, and management tools to           2008), mangrove biodiversity (Polidoro et al., 2010; Walton
store, publish, and share biodiversity data, particularly over      et al., 2014), mushroom corals (Hoeksema, 2007), and razor
the internet and World Wide Web, have been improved sig-            clams (Saeedi et al., 2016), with areas of high biodiversity
nificantly in recent years (Michener, 2015). Such devel-            importance clustered along the southern part of the Philip-
opment is supported by the availability of metadata stan-           pines, the northeastern part of Malaysian Sabah, the central
dards to facilitate description of datasets and data records        to eastern part of Indonesia, the eastern part of Papua New
(e.g., Ecological metadata language (EML); Michener et              Guinea, and the Solomon Islands (Asaad et al., 2018a). Al-
al., 1997); Darwin core; GBIF, 2010), widely assessed repos-        though considerable biodiversity and natural resources data
itories for depositing ecologically relevant data (e.g., Dryad;     have been collected for the region by scientists and conser-
http://datadryad.org/; Figshare; https://figshare.com/; KNB;        vation programmes, the data have been scattered and diffi-
https://knb.ecoinformatics.org/) and a variety of open-source       cult to access. While our prioritization of locations for ma-
data management tools (e.g., MySQL, R, and Kepler).                 rine protected areas (MPAs) (Asaad et al., 2018a, b) was suc-
   Geographic information systems (GIS) provide a tool              cessfully collating data of biodiversity features, threats, and
to explore spatial relationships within and between data            environmental variables, this did not make it easily viewable
(Wright et al., 2016; Hamylton, 2017), and there is a growing       to the public. In addition, a previous online atlas of the CT
trend of internet-based GIS (i.e., GIS designed for operating       was developed to support coral reef management and pro-
online over the World Wide Web) (Morets, 2017). The appli-          vided biophysical and MPA data from the region (Cros et
cation of internet GIS through online atlases (the process of       al., 2014), but was more limited in data on species ranges
designing, generating, and delivering maps on the internet)         (e.g., threatened species, endemic species). Thus, updated,
provides a number of advantages over traditional desktop-           more systematic and comprehensive “biodiversity informat-
based GIS (Neumann, 2008). Web-based maps can deliver               ics” datasets are required to showcase all of the available data
up to date data, can be generated using a low-cost software         in the region.
and hardware infrastructure, and facilitate inexpensive map            This online atlas aims to support the objective of the
distributions. In addition, online atlases enables the integra-     CTI-CFF initiative (the Coral Triangle Initiative on Coral
tion of different data sources and collaborative mapping (e.g.,     Reefs, Fisheries, and Food Security). The CTI-CFF initia-
Google Maps, Openstreet Maps; Neumann, 2008; Fu and                 tive is a multilateral partnership of six countries (Indonesia,
Sun, 2010; Clarke, 2014). These geo-based websites appli-           Malaysia, Papua New Guinea, the Philippines, Solomon Is-
cations are supported by Open GIS infrastructure that allow         lands, and Timor-Leste) working collaboratively to conserve
users in the world to access and operate GIS and to facili-         and sustainably manage their coastal and marine resources
tate the exchange of spatial data and information (Sui, 2014).      (CTI-CFF, 2009). One of the objectives of the Coral Triangle
In the biodiversity conservation discipline, online atlases of-     Initiative is to establish and effectively manage MPAs within
fer greater accessibility and allow for user-driven interaction     the region, including a region-wide Coral Triangle MPA sys-
(Peterson, 2018). Furthermore, the advancement of smart-            tem (CTMPAS) (CTI-CFF, 2009). The CTMPAS is a sys-
phone applications (apps) that are linked to mobile web-            tem of MPAs within the CT which includes a range of MPA
based maps provides an avenue to involve broader audiences          types and MPA network. This system comprises MPAs that
in the natural sciences and a convenient tool for scientists to     form local ecological and/or governance networks that are
disseminate their research (Teacher et al., 2013; Marchante et      nested within larger-scale social networks (CTI-CFF, 2013).
al., 2017). Online atlases exist for several coastal regions, in-   Thus, the collections of geospatial data collated in this online
cluding Ireland’s Marine Atlas (https://atlas.marine.ie/), the      GIS database support the development of MPAs and manage-
Oregon Coastal Atlas (https://www.coastalatlas.net/), and the       ment of marine resources in the region by giving access to
European Atlas of the Seas (Barale et al., 2015). These             policymakers, scientists, and the general public to the most
coastal web-atlases serve a variety of functions, including         comprehensive, up-to-date and integrated spatial information
being data repositories, and allow users to explore and over-       available for the Coral Triangle.
lay different data with geospatial analysis tools. Therefore,
Wright et al. (2011) define the coastal online atlas as “a col-
lection of maps with supplementary tables, illustrations, and       2   Methods (Web map design)
information which systematically illustrate the coast”.
   To take advantage of the potential of online atlases, here       This atlas was developed to interactively display geo-
we developed an application for the Coral Triangle (CT) re-         referenced biodiversity information on the Coral Triangle
gion of the Indo-Pacific realm, a marine area situated be-          (CT): (1) Biodiversity Features; (2) Areas of Importance for

Earth Syst. Sci. Data, 11, 163–174, 2019                                             www.earth-syst-sci-data.net/11/163/2019/
I. Asaad et al.: Atlas for biodiversity conservation                                                                            165

Biodiversity Conservation; and (3) priority areas for Marine       to explore a wide variety of functions offered by the maps, 15
Protected Area (MPA) Network Expansion.                            types of widgets (a control element in a graphical user inter-
   To generate the atlas, related datasets were retrieved from     face) were embedded (e.g., Home button, Layer list, Select,
the Coral Triangle database collected in the previous chapters     Draw; see Table 2). A documentation website was developed
(Asaad et al., 2018a, b). These datasets were collated and de-     to define the map’s objectives, datasets, classifications, and
veloped from various sources (Table 1). For consistency, all       original citations of the sources.
the datasets were clipped to the CT region following the im-
plementation boundary of the Coral Triangle Initiative (CTI-
                                                                   3   Results
CFF, 2009) with bounding geographic coordinates of 23◦ N
to 16◦ S and 90 to 175◦ E. All of the data preparations were       The atlas of the Coral Triangle is an online GIS database,
performed using ArcGIS Desktop 10.5 (ESRI, 2016) and Ar-           and can be assessed through a web front-page (http://www.
cGIS Pro. 2.0 (ESRI, 2017).                                        marine.auckland.ac.nz/CTMAPS; Fig. 1). These geospatial
   The ArcGIS Pro 2.0 was used to deliver and share all of         datasets were built on three interlinked themes: (a) Biodiver-
the maps to web feature layers in ArcGIS Online, and de-           sity Features (http://marine.auckland.ac.nz/CT_Biodiversity;
sign three digital maps using the ArcGIS Online template.          Fig. 2), which provides comprehensive data on the region’s
Here, a similar template was used for each map to allow map        marine protected areas, biodiversity features, threats, and
comparisons. These digital maps used a website as an inter-        environmental characteristics; (b) Areas of Importance for
face and can be accessed from any computer or other elec-          Biodiversity Conservation (http://www.marine.auckland.ac.
tronic device that is connected to the internet using a standard   nz/CT_Priority), which provides spatial distributions of ar-
browser (e.g., Internet Explorer, Google Chrome, or Safari).       eas of high biodiversity conservation value; and (c) pri-
The maps were hosted by ArcGIS Online in a cloud service           ority areas for Coral Triangle Marine Protected Area
provided by the Amazon EC2 (Elastic Compute Cloud).                (MPA) Network Expansion (http://www.marine.auckland.ac.
   Each atlas consists of different feature layers:                nz/CT_MPA), which provides spatial information of priority
  – The map of “biodiversity features” is comprised of             areas for potential expansion of the existing MPA network.
    10 feature layers, including (a) seven layers of bio-          Relevant information on the maps can be accessed through an
    diversity features (biogenic habitat, species richness-        accompanying documentation website (https://sites.google.
    ranges, species richness-occurrence, species of conser-        com/view/coral-triangle-digital-map).
    vation concern, species of restricted range, important ar-
    eas for sea turtles and habitat rugosity; (b) two types        4   Data availability
    of threat (anthropogenic and climate change); and (c) a
    composite of 16 environmental variables (Table 1).             The “Data availability” is covered in the results section.
  – The map of “areas of importance for biodiversity con-
    servation” is comprised of two feature layers: (a) re-         5   Discussion
    gional biodiversity hotspots; and (b) sites of biodiversity
    importance (Table 1).                                          The atlas of the Coral Triangle showcases all of the currently
                                                                   available marine biodiversity conservation data for the Coral
  – The map of “priority areas for marine protected area           Triangle region. They are derived from the most comprehen-
    network expansion” consists of nine feature layers:            sive biodiversity conservation datasets for the region, featur-
    (a) three layers highlighting recommended priority ar-         ing spatial information for the region based on their habitat
    eas for expansion of the Coral Triangle MPA network            and species-specific attributes, vulnerabilities to threats, and
    under scenarios of regional expansion to encompass             environmental characteristics. The maps also include a set of
    10 %, 20 %, and 30 % of CT marine area within the net-         data to indicate areas of importance for biodiversity conser-
    work; and (b) six layers showing priority areas for ex-        vation, existing MPAs, and priority areas of the designation
    pansion of individual CT country MPA networks for In-          of new MPAs or MPA expansion in the Coral Triangle, show-
    donesia, Malaysia, the Philippines, Papua New Guinea,          ing priorities for biodiversity conservation at both regional
    Solomon Islands and Timor-Leste. Each layer of the na-         and national scales.
    tional priority areas is comprised of three scenarios of          Collating and comparing datasets from different sources
    MPA expansion (10 %, 20 %, 30 %) (Table 1).                    presented a number of challenges. To have a consistent for-
                                                                   mat and spatial attributes, all datasets were converted into
  – Three base layers are included for each web map: exist-
                                                                   a vector format (i.e., lines or polygon shape) and standard-
    ing marine protected areas, national exclusive economic
                                                                   ized geographic projections. To reduce data discrepancy, the
    zones (EEZs) and country boundaries (Table 1).
                                                                   biodiversity feature datasets were classified using equal in-
  To access the maps, a gallery-like web front page was de-        terval classes based on their biodiversity values. The datasets
veloped with a hyperlink to each digital map. To allow users       were then grouped into themes (biodiversity features, areas

www.earth-syst-sci-data.net/11/163/2019/                                             Earth Syst. Sci. Data, 11, 163–174, 2019
166 I. Asaad et al.: Atlas for biodiversity conservation
Table 1. Coral Triangle datasets specifications.
Data Feature Type, spatial Descriptions Sources
layer resolution,
class
Base Layers
a. Coral Generated from Polygon The boundary covers the full exclusive VLIZ (2014)
Triangle the Coral Triangle economic zones (EEZs) of Indonesia,
boundary Initiative Malaysia, Papua New Guinea,
implementation the Philippines, Solomon Islands,
boundary and Timor-Leste, and includes
the EEZs of two additional nations:
Brunei Darussalam and Singapore.
b. Country Internal boundary Polyline The EEZs and internal boundaries VLIZ (2014)
boundary of Coral Triangle are indicative only, and a dispute
countries over boundaries exists.
c. Marine Coverage of Polygon The layers’ attribute table provides IUCN and
protected 678 units of detailed information following its UNEP-WCMC (2016),
areas (MPAs) MPA native sources (WDPA, CTAtlas) Cros et al. (2014),
coverage (e.g., information about name, MoF-MoMAF (2010),
local name, designation type, MoMAF (2016)
IUCN category, coverage; IUCN and
UNEP-WCMC, 2016; Cros et al., 2014)
with amendment and adjustment from
local sources (Indonesian database).
To allow simple indexing, a new CT MPAs
ID format (MPA_ID) is introduced.
The new ID consists of 10 digits
(C IC XXXX yyy):
– C = Country; 1 = Indonesia, 2 = Malaysia,
3 = Philippines, 4 = Papua New Guinea,
5 = Solomon Islands, and 6 = Timor-Leste
– IC = IUCN MPAs category;
strict nature reserve (1a = 11, 1b = 12),
national park (20), habitat and
species management Areas (40),
protected landscape/seascape (50), and
managed resource protected areas (60)
– XXXX = establishment year (e.g., 1980)
– yyy = Number; ordered based on their
establishment year
Biodiversity features
a. Biogenic Refers to the habitats Grid square Calculated based on UNEP-WCMC
Habitat that are created cells; 5 km; the number of biogenic et al. (2010),
by plants and 3 classes habitat present Giri et al.
animals. in each cell. (2011a, b),
UNEP-WCMC and
Spatial distribution Cell values ranged 1–3. Short (2005)
of coral reef, seagrass,
and mangroves.
b. Species A modeled geographic Grid square Calculated based on the number Kaschner
richness – distribution of cells; 50 km; predicted species in each cell. et al. (2016)
ranges 10 672 species 10 classes The number of predicted species
ranges. per cell ranged 0–5509.
c. Species The occurrence records Grid square Based on the index of expected OBIS (2015)
richness – of 19 251 species. cells; 50 km; species richness of ES50
occurrence 10 classes (estimated species in
random 50 samples).
d. Species of The occurrence records of Grid square Based on the index of expected OBIS (2015),
conservation 834 species of conservation cells; 50 km; species richness of ES35 Froese and
concern concern (Bony fish, anthozoans, 10 classes (estimated species in Pauly (2016),
elasmobranchs, mammals, random 50 samples). IUCN (2015),
and mollusks). UNEP-WCMC (2015)
e. Species of The distribution of Grid square Calculated based on the number of Allen (2008),
restricted- 373 restricted-range cells; 5 km; of species present in each cell. Allen and
range reef fish species. 10 classes Cell values ranged 1–101. Erdmann (2013).
Earth Syst. Sci. Data, 11, 163–174, 2019 www.earth-syst-sci-data.net/11/163/2019/I. Asaad et al.: Atlas for biodiversity conservation 167
Table 1. Continued.
Data Feature Type, spatial Descriptions Sources
layer resolution,
class
f. Important Nesting sites and Grid square The richness calculated based on MoF-MoMAF (2010),
areas for migratory route of cells; 5 km; the number of sea turtle species OBIS (2015)
sea turtle six species 3 classes present in each cell (i.e., 1, 2, 3).
(2055 records).
g. Habitat A vector ruggedness Grid square The VRM index ranged from 0.1 Basher et al.
rugosity measure (VRM) of cells; 50 km; (areas with low terrain (2014),
benthic terrain, 10 classes variations) to 0.9 (areas Wright et al.
generated from with high terrain variations). (2012)
bathymetric data.
h. Anthropogenic Spatial distribution Grid square The cumulative impact of 19 different Halpern et al.
pressure of AP on marine cells; 5 km; types of anthropogenic stressors. (2008, 2015a, b)
(AP) environments. 10 classes The AP value ranged 0–15.4,
indicating areas from low to
high human-induced pressure.
i. Climate Spatial distribution of sea Grid square The projected thermal stress index Van Hooidonk
change surface thermal stress level cells; 5 km; ranged 5.6–20.2, indicating areas et al. (2016)
pressure (the average of degree 10 classes from low to high vulnerability
heating weeks, DHW) to climate change.
from 2006 to 2099.
j. Environmental Spatial distribution of Point; 50 km; Composite point features of Basher et al.
Variables environmental variables 10 classes 16 environmental variables, (2014)
(physical, biochemical, i.e., depth, slope, land distance,
and nutrients). temperature, surface current,
salinity, wind speed, tide,
primary productivity, photosynthetically
active radiation (PAR), chlorophyll a,
pH, dissolved oxygen, nitrate, silicate,
and calcite.
Areas of Importance for Biodiversity Conservation
a. Regional Clusters of areas Grid square cells; Developed based on the multi-criteria analysis Asaad et al.
biodiversity of biodiversity 55 km; three classes to five ecological criteria (sensitive habitat, (2018a)
hotspots importance. of hotspots (high, species richness, the presence of species of
medium, and low) conservation concern, the occurrence of
and one class was not restricted-range species, areas of importance
significant for particular life history stages).
Analyzed based on the spatial patterns of data
using the hotspots analysis tool in ArcGIS.
The analysis clustered the cells from hotspot
(high-score cells) to coldspots (low-score cells).
b. Sites of Distribution of Grid square cells; Developed based on the similar ecological Asaad et al.
biodiversity sites of areas of 55 km; five classes criteria to those used in the biodiversity (2018a)
importance biodiversity (high, medium-high, hotspots region analysis.
importance. medium, medium-low,
and low) While the hotspots analysis identified clustered
areas of biodiversity importance. The site-based
analysis identifies specific sites of highest
biodiversity importance by analyzing
the biodiversity score of each cell.
The higher the score, the higher their
biodiversity importance.
of important for biodiversity conservation, and priority ar- indeed available, yet they are frequently scattered and not
eas for MPA network expansion). Each theme consists of always easily accessed. Using an approach such as the one
sub-themes, to promote simple indexing, retrieving, and data we describe here, these widely scattered datasets can be in-
management. Here, this study showed that for conducting a tegrated and amalgamated to perform such complex tasks as
biodiversity conservation programme, biodiversity data are biodiversity prioritization analysis (Asaad et al., 2018a, b).
www.earth-syst-sci-data.net/11/163/2019/ Earth Syst. Sci. Data, 11, 163–174, 2019168 I. Asaad et al.: Atlas for biodiversity conservation
Table 1. Continued.
Data Feature Type, spatial Descriptions Sources
layer resolution,
class
Marine Protected Area (MPA) Network Expansion
a. Regional Spatial distribution of Grid square cells; Prioritization analyses were performed using Asaad et al.
priority regional priority areas 0.5 km Zonation tools to analyze the proportions of (2018b)
areas with three expansion the CT region placed into an MPA network
scenario layers: (e.g., expansion of the MPA network from existing
10 %, 20 %, and 30 %. coverage to 10 %, 20 %, and 30 % of
the exclusive economic zone (EEZ) area).
The prioritization scenarios were based on seven
sets of biodiversity features (biogenic habitat,
habitat rugosity, species richness, distribution of
threatened and endemic species, areas important for
sea turtle); two types of threat (anthropogenic and
climate change induced pressure); and
the coverage of the existing MPA network.
Regional analyses were performed for the full CT EEZ region.
b. National Spatial distribution of Grid square cells; Developed based on the same approach as the regional Asaad et al.
Priority national priority areas with 0.5 km priority areas. (2018b)
Areas six layers of scenarios
representing national MPA National analyses were performed individually on
network expansion for Indonesia, each CT country’s national EEZ.
Malaysia, the Philippines,
Papua New Guinea, Solomon Each layer consisted of three scenarios of MPA expansion
Islands and Timor-Leste. (10 %, 20 %, 30 %)
Figure 1. Coral Triangle web-mapping application front-page. This gallery-like interface provides a hyperlink to access each of the maps of
the Coral Triangle Atlas.
Earth Syst. Sci. Data, 11, 163–174, 2019 www.earth-syst-sci-data.net/11/163/2019/I. Asaad et al.: Atlas for biodiversity conservation 169
Table 2. Widgets provided for the Coral Triangle Atlas.
Icon Widget Functions
Controller widgets (header panels)
About Displays general information about the apps, including purposes, data layers, and links to the documentation files.
Basemap gallery Provides a gallery of base maps and allows users to select their preference.
Layer list Presents a list of layers in the map and allows users to interactively choose layers that need to be activated.
Each layer has a checkbox and allows users to change the order of the layers in the map.
Legend Displays a legend of active layers showing in the map.
Placeholder widgets (on-screen panel)
Swipe Displays thumbnail views of different layers on top of the map to enable a quick comparison of the content
of different layers. Here we used the spyglass view model.
Draw Enables users to create and draw graphics (sketches) on the map. There are 11 feature creation tools (point,
line, polyline, freehand, triangle, rectangle, circle, ellipse, polygon, freehand polygon, and text).
It also displays measurements of the drawn features (lengths, areas, and perimeters).
Measurement Provides tools to measure areas (polygons), to calculate distance (line), and to show geographic
coordinates (point). Each measurement can be displayed in a variety of measurement units
(i.e., metric and imperial system).
Print Enables printing of the map. This widget allows users to choose the map layout (and format e.g., pdf, jpg, gif)
and an advanced option to select map scale, size, and printing quality.
Select Provides interactive tools to select features and perform tasks on the selected features. There are four options to draw
a selection: select by rectangle, polygon, circle, and line. The selected features actions can be explored through
the following functions.
– Display tasks: zoom to- , pan to- and flash.
– Export: to CSV files, to feature collections, and to GeoJSON (export to a features.geojson file).
– Statistics: display simple statistics of the selected features (sum, max, min, average, standard deviation).
– Save to My Content: save selected features to My Content page in ArcGIS Online or ArcGIS Enterprises.
– Create layer: enables to create layer for a single or selected feature.
– View in attribute table: previews the attribute table of the selected features.
Off-panel widgets
Home button Displays the initial extent of the map. The bounding coordinates of the map are from 23◦ N to 16◦ S and 90 to 175◦ E.
Attribute table Shows a tabular view of operational layers’ attributes. Located at the bottom of the map, and can be configured to
display selected features, zoom to and filter the table based on the map extent.
Coordinate Displays coordinates of the map (x and y values). Shows the coordinates in the WGS 1984 Mercator Auxiliary
Sphere (WKID 3857) projection. Located in the lower-left corner of the map.
Scale bar Shows a scale bar of the map. Updated dynamically based on map’s scale. Located in the lower-left corner of the map.
My location Displays the physical location and zooms the map to the users location.
Zoom slider Provides an interactive zoom for the map display.
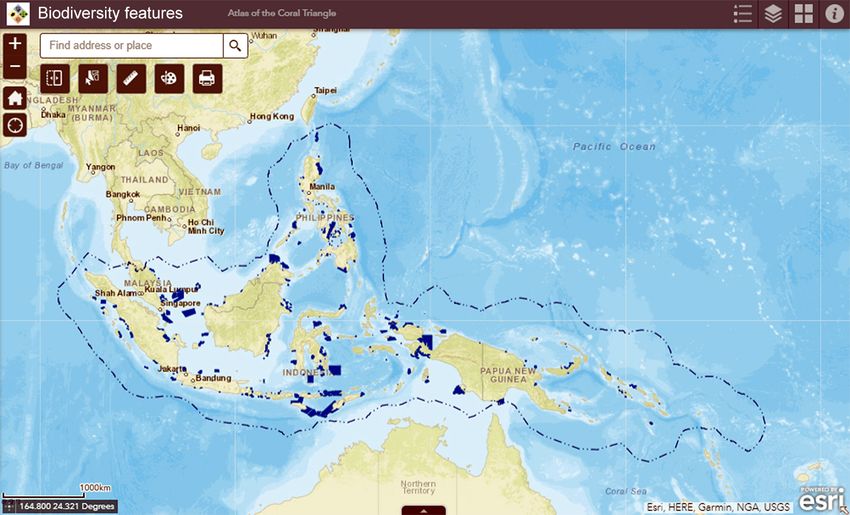
www.earth-syst-sci-data.net/11/163/2019/ Earth Syst. Sci. Data, 11, 163–174, 2019170 I. Asaad et al.: Atlas for biodiversity conservation Figure 2. The interface of the Atlas of the Biodiversity Conservation of the Coral Triangle. The Coral Triangle countries’ EEZs (blue-dashed line) and distribution of marine protected areas (blue) are indicated. This study developed an interactive web application that range of export formats, ranging from a generic “comma- featured maps and geospatial contents using a configurable separated values (CSV)” file that stores tabular data in plain template provided by ArcGIS Online. This approach reduces text, to a “Geo JavaScript Object Notation (GeoJSON)” file, the complexity of code writing, website programming, and an open standard format designed for representing simple ge- other technical knowledge needed to create a web map. We ographical features, along with their non-spatial attributes. opted to use accessible and less technical tools, to show that The “print” widgets provide an option to reproduce maps in even with limited skills in internet GIS and web develop- a variety of formats such as pdf, jpeg, and gif, which facilitate ment, scientific communities have an opportunity to develop inclusion in presentations or embedding of maps in reports. geospatial tools to support biodiversity conservation. Repli- To enable and encourage data explorations, the “select” wid- cation of this type of approach in the other regions is im- gets were supplied with functions to conduct simple statis- portant as there is a continuing trend of biodiversity loss and tical analysis (e.g., sum, average, maximum, minimum, and limited resources are available to protect all of the important standard deviation of selected data). biodiversity. This atlas could be linked to the previous Coral Triangle This atlas was designed to enable an efficient decision- Atlas developed by Cros et al. (2014) that is currently man- making process and to engage a wider stakeholder audience. aged by the Coral Triangle Initiative Secretariat. These at- To support these objectives, all of the datasets were featured lases are complementary in design and applications and may in a format that can be overlaid and visualized directly using provide options to stakeholders to retrieve reliable Coral Tri- a standard web browser. This web browser platform facili- angle data. Here, our atlas provides a supplement and en- tates interactive access and examination of the data without riches the previous atlas by providing access to explore areas the need for expensive GIS software. The spatial information of biodiversity importance within the coral Triangle and a set in each dataset can be extracted through (a) intuitively hover- of priority areas to designate new MPA within the region. We ing the mouse over and selecting a feature; (b) using “select” integrated ecological and biological datasets following stan- widgets and exporting the selected features to preferred data dard ecological criteria to identify areas for biodiversity con- formats; and (c) reproducing the maps in suitable graphic for- servation (Asaad et al., 2016). Our “Biodiversity Features” mats using “print” widgets. The “select” widgets provide a datasets are comprised of biogenic habitat, species richness- Earth Syst. Sci. Data, 11, 163–174, 2019 www.earth-syst-sci-data.net/11/163/2019/
I. Asaad et al.: Atlas for biodiversity conservation                                                                               171

occurrences, species richness-ranges, species of conservation      tion that can be used to develop a region-based biodiversity
concern, restricted range species, areas important for life his-   conservation strategy.
tory stage of species, and habitat rugosity. The datasets are         The collections of geospatial data collated on this online
ready to use and are applicable for identifying priority areas     GIS database are aimed to give access to policymakers, sci-
for biodiversity conservation. In addition, this atlas included    entific communities, and the general public full access to the
datasets of threats, comprised of present anthropogenic and        most comprehensive, up-to-date, and integrated spatial infor-
projected climate change induced pressures. Knowledge of           mation available for the Coral Triangle. This atlas presents
threat level provides key information for developing alter-        representative information to promote a better understanding
native marine spatial planning and management strategies,          of important areas for biodiversity conservation and the ap-
e.g., enforcement, habitat restoration, and mitigation (Green      plication of marine biodiversity informatics to support con-
et al., 2009; McLeod et al., 2010; Maynard et al., 2015). Fur-     servation prioritization in the Coral Triangle region.
thermore, this atlas also provided data for 16 environmental
variables (including physical, chemical, and oceanographic
variables). As such, this atlas offers an opportunity to ex-       Author contributions. IA conceived the research ideas, designed
plore the relationship between biologically diverse areas and      the methodology, developed the web GIS applications, and wrote
underlying physical and chemical parameters, as well as the        the manuscript. CJL gave advice and guidance in the study de-
relationship with potential pressure factors.                      sign, interpretation of the research, and reviewed the manuscript
                                                                   for scientific rigor and readability. MVE gave advice and guidance
   In this atlas, the biogenic habitat distribution map was
                                                                   in the study design, interpretation of the research, and reviewed the
retrieved from three types of coastal habitat (coral reefs,        manuscript for scientific rigor and readability. MJC gave advice and
seagrass, and mangroves) that may generate a bias towards          guidance in the study design, interpretation of the research, and re-
coastal regions. A detailed habitat map and a defined list         viewed the manuscript for scientific rigor and readability.
of habitat types are needed to fully evaluate the ecologi-
cal and biological significance of the marine area. In addi-
tion, this atlas focuses on the biodiversity features within       Competing interests. The authors declare that they have no con-
the economic exclusive zones (EEZs) of the Coral Trian-            flict of interest.
gle countries. There are vast resources found outside the
EEZ including some of the most productive ecosystems (e.g.,
seamounts, hydrothermal vents), rare and unique species, and       Acknowledgements. Irawan Asaad is supported by the New
migratory routes of endangered marine species. Thus, biodi-        Zealand Aid Programme through the New Zealand ASEAN
versity data of areas beyond national jurisdictions potentially    Scholarship. We would like to thank Dr Tilmann Steinmetz (NIWA
complement the EEZ data to improve and develop a compre-           – Wellington), Keith Van Graafeiland (ESRI – Redlands), Graeme
hensive biodiversity conservation programme in the region.         Glen, and Robert Carter (UoA – Auckland) for their technical
                                                                   assistance in developing this online atlas.
   There are opportunities to improve and advance the
geospatial functionality of this Coral Triangle atlas. An en-      Edited by: Falk Huettmann
visioned future version of this atlas is a dynamic online          Reviewed by: Alan White, Simon Pittman, and one anonymous
database which provides tools to add, upload and store new         referee
biodiversity data (e.g., species occurrence data). The grow-
ing trend of citizen science opens an opportunity to collect
and integrate potentially massive amounts of data to fill gaps
                                                                   References
in the biodiversity data records. In addition, the availability
of options for running online spatial analysis tasks such as       Allen, G. R.: Conservation hotspots of biodiversity and endemism
identifying priority areas or delineating protected reserves in      for Indo-Pacific coral reef fishes, Aquat. Conserv., 18, 541–556,
a defined geographic area or for a specific dataset may of-          2008.
fer an opportunity to further enhance the performance of this      Allen, G. R. and Erdmann, M. V.: Reef fishes of the
atlas.                                                               East Indies. Mobile Application Software, Version 1.1
   This atlas may be used by initiatives such as IODE–               (Rev.10.2016), available at: https://geo.itunes.apple.com/us/
ICAN (International Coastal Atlas Network), the Global               app/reef-fishes-east-indies-vol./id705188551?mt=8(9).        (last
Health Ocean Index (http://www.oceanhealthindex.org/), the           access: 15 June 2016), 2013.
                                                                   Alsheikh-Ali, A. A., Qureshi, W., Al-Mallah, M. H., and
GEO-Marine Biodiversity Observation Network (https://
                                                                     Ioannidis, J. P.: Public availability of published re-
boninabox.geobon.org/), UNEP-WCMC Network (http://
                                                                     search data in high-impact journals, PloS One, 6, e24357,
data.unep-wcmc.org/), and others network related to the UN           https://doi.org/10.1371/journal.pone.0024357, 2011.
SDG Goal 14 and the upcoming UN Decade of Ocean Sci-               Asaad, I., Lundquist, C. J., Erdmann, M. V., and Costello,
ence. This type of atlas fills a regional gap in data within         M. J.: Ecological criteria to identify areas for bio-
such global initiatives and provides more detailed informa-          diversity conservation, Biol. Conserv., 213, 309–316,
                                                                     https://doi.org/10.1016/j.biocon.2016.10.007, 2016.

www.earth-syst-sci-data.net/11/163/2019/                                                Earth Syst. Sci. Data, 11, 163–174, 2019
172 I. Asaad et al.: Atlas for biodiversity conservation
Asaad, I., Lundquist, C. J., Erdmann, M. V., and Costello, M. forests of the world using earth observation satellite data, Global
J.: Delineating priority areas for marine biodiversity conser- Ecol. Biogeogr., 20, 154–159, 2011a.
vation in the Coral Triangle, Biol. Conserv., 222, 198–211, Giri, C., Ochieng, E., Tieszen, L., Zhu, Z., Singh, A., Loveland,
https://doi.org/10.1016/j.biocon.2018.03.037, 2018a. T., Masek, J., and Duke, N.: Global distribution of mangroves
Asaad, I., Lundquist, C. J. L., Erdmann, M. V. E., Hooidonk, forests of the world using earth observation satellite data, in:
V., Van Hooidonk, R., and Costello, M. J. : Designat- Supplement to: Giri et al. (2011a), UNEP World Conservation
ing spatial priorities for marine biodiversity conservation in Monitoring Centre, Cambridge, UK, available at: http://data.
the Coral Triangle, Frontiers In Marine Science, 5, 400, unep-wcmc.org/datasets/4 (last access: 1 June 2016), 2011b.
https://doi.org/10.3389/fmars.2018.00400, 2018b. Green, A., Smith, S. E., Lipsett-Moore, G., Groves, C., Peterson,
Basher, Z., Bowden, D. A., and Costello, M. J.: Global Marine Envi- N., Sheppard, S., Lokani, P., Hamilton, R., Almany, J., and Aitsi,
ronment Datasets (GMED)-World Wide Web electronic publica- J.: Designing a resilient network of marine protected areas for
tion, Ver. 1.0 (Rev.01.2014), available at: http://gmed.auckland. Kimbe Bay, Papua New Guinea, Oryx, 43, 488–498, 2009.
ac.nz (last access: 1 June 2016), 2014. Guiry, M. D. and Guiry, G. M.: AlgaeBase, World-wide electronic
Barale, V., Assouline, M., Dusart, J., and Gaffuri, J.: The European publications, National University of Ireland, Galway, available
atlas of the seas: relating natural and socio-economic elements at: http://www.algaebase.org/, last access: 1 August 2018.
of coastal and marine environments in the European Union, Mar. Halpern, B. S., Walbridge, S., Selkoe, K. A., Kappel, C. V., Micheli,
Geod., 38, 79–88, 2015. F., D’Agrosa, C., Bruno, J. F., Casey, K. S., Ebert, C., Fox, H. E.,
Bisby, F. A.: The quiet revolution: biodiversity informatics and the Fujita, R., Heinemann, D., Lenihan, H. S., Madin, E. M. P., Perry,
internet, Science, 289, 2309–2312, 2000. M. T., Selig, E. R., Spalding, M., Steneck, R., and Watson, R.:
Clarke, K. C.: Maps & Web Mapping, Pearson Education, New A global map of human impact on marine ecosystems, Science,
York, 2014. 319, 948–952, https://doi.org/10.1126/science.1149345, 2008.
Costello, M. J.: Motivating online publication of data, BioScience, Halpern, B. S., Frazier, M., Potapenko, J., Casey, K. S., Koenig,
59, 418–427, 2009. K., Longo, C., Lowndes, J. S., Rockwood, R. C., Selig, E. R.,
Costello, M. J. and Vanden Berghe, E.: ’Ocean biodiver- and Selkoe, K. A.: Spatial and temporal changes in cumulative
sity informatics’; A new era in marine biology research human impacts on the world’s ocean, Nat. Commun., 6, 7615,
and management, Mar. Ecol. Prog. Ser., 316, 203–214, https://doi.org/10.1038/ncomms8615, 2015a.
https://doi.org/10.3354/Meps316203, 2006. Halpern, B. Frazier, M., Potapenko, J., Casey, K. S., Koenig, K.,
Costello, M. J., Michener, W. K., Gahegan, M., Zhang, Z.-Q., and Longo, C., Lowndes, J. S., Rockwood, R. C., Selig, E. R., and
Bourne, P. E.: Biodiversity data should be published, cited, and Selkoe, K. A.: Cumulative human impacts: raw stressor data
peer-reviewed, Trends Ecol. Evol., 28, 454–461, 2013. (2008 and 2013), https://doi.org/10.5063/F1S180FS 2015b.
Cros, A., Fatan, N.A., White, A., Teoh, S.J., Tan, S., Handayani, C., Hamylton, S. M.: Spatial Analysis of Coastal Environments, Cam-
Huang, C., Peterson, N., Li, R.V., Siry, H.Y., Fitriana, R., Gove, bridge University Press, Cambridge, UK, 2017.
J., Acoba, T., Knight, M., Acosta, R., Andrew, N., and Beare, D.: Heidorn, P. B.: Biodiversity informatics, Bulletin of the Association
The Coral Triangle Atlas; An Integrated Online Spatial Database for Information Science and Technology, 37, 38–44, 2011.
System for Improving Coral Reef Management, Plos One, 9, Hoeksema, B. W.: Delineation of the Indo-Malayan centre of max-
e96332, https://doi.org/10.1371/journal.pone.0096332, 2014. imum marine biodiversity: the Coral Triangle, in: Biogeography,
CTI-CFF: The Regional Plan of Action of the Coral Triangle on time, and place; Distributions, barriers, and islands, edited by:
Coral Reefs, Fisheries and Food Security (CTI-CFF) Initiative, Renema, W., Springer, The Netherlands, 117–178, 2007.
The secretariat of CTI-CFF Initiative, Jakarta, Indonesia, 2009. Horton, T., Kroh, A., Bailly, N., Boury-Esnault, N., Brandão, S.
CTI-CFF: Coral Triangle Marine Protected Area System Frame- N., Costello, M. J., Gofas, S., Hernandez, F., Mees, J., Paulay,
work and Action Plan, CTI-CFF, United States Agency for In- G., Poore, G., Rosenberg, G., Stöhr, S., Decock, W., Dekeyzer,
ternational Development Coral Triangle Support Partnership and S., Vandepitte, L., Vanhoorne, B., Vranken, S., Adams, M. J.,
US National Oceanic and Atmospheric Administration, Cebu Adlard, R., Adriaens, P., Agatha, S., Ahn, K. J., Ahyong, S.,
City, The Philippines, 2013. Akkari, N., Alvarez, B., Anderson, G., Angel, M., Arango, C.,
ESRI: ArcGIS Desktop Ver.10.5, ESRI, Redlands, CA, 2016. Artois, T., Atkinson, S., Barber, A., Barbosa, J. P., Bartsch, I.,
ESRI: ArcGIS Pro Ver. 2.0, ESRI, Redlands, CA, 2017. Bellan-Santini, D., Berta, A., Bieler, R., Błażewicz, M., Bock,
Froese, R. and Pauly, D.: FishBase, World Wide Web electronic P., Böttger-Schnack, R., Bouchet, P., Boyko, C. B., Bray, R.,
publication, Ver. (06/2016), available at: http://www.fishbase. Bruce, N. L., Cairns, S., Campinas Bezerra, T. N., Cárdenas, P.,
org, last access: 1 June 2016. Carstens, E., Cedhagen, T., Chan, B. K., Chan, T. Y., Cheng,
Fu, P. and Sun, J.: Web GIS; Principles and applications, ESRI L., Churchill, M., Coleman, C. O., Collins, A. G., Cordeiro,
Press, Redlands, CA, 2010. R., Crandall, K. A., Cribb, T., Dahdouh-Guebas, F., Daly, M.,
GBIF: https://www.gbif.org, last access: 1 April 2018. Daneliya, M., Dauvin, J. C., Davie, P., De Grave, S., de Mazan-
GBIF: Darwin Core Archives – How-to Guide, Ver. 1 Released on 1 court, V., Decker, P., Defaye, D., d’Hondt, J. L., Dijkstra, H.,
March 2010, contributed by: Remsen, D., Braak, K., Döring, M., Dohrmann, M., Dolan, J., Downey, R., Drapun, I., Eisendle-
Robertson, T., Global Biodiversity Information Facility, Copen- Flöckner, U., Eitel, M., Encarnação, S. C. d., Enghoff, H., Epler,
hagen, 21 pp., 2010. J., Ewers-Saucedo, C., Faber, M., Feist, S., Finn, J., Fišer, C.,
Giri, C., Ochieng, E., Tieszen, L., Zhu, Z., Singh, A., Loveland, Fonseca, G., Fordyce, E., Foster, W., Frank, J. H., Fransen, C.,
T., Masek, J., and Duke, N.: Status and distribution of mangrove Furuya, H., Galea, H., Garcia-Alvarez, O., Gasca, R., Gaviria-
Melo, S., Gerken, S., Gheerardyn, H., Gibson, D., Gil, J., Gitten-
Earth Syst. Sci. Data, 11, 163–174, 2019 www.earth-syst-sci-data.net/11/163/2019/I. Asaad et al.: Atlas for biodiversity conservation 173 berger, A., Glasby, C., Glover, A., Gordon, D., Grabowski, M., Turtles Online Database, Data provided by the SWOT Team and Gravili, C., Guerra-García, J. M., Guidetti, R., Guilini, K., Guiry, hosted on OBIS-SEAMAP, Oceanic Society, IUCN Marine Tur- M. D., Hajdu, E., Hallermann, J., Hayward, B., Hendrycks, tle Specialist Group (MTSG), and Marine Geospatial Ecology E., Herrera Bachiller, A., Ho, J. s., Høeg, J., Holovachov, O., Lab, Duke University, available at: http://seamap.env.duke.edu/ Hooper, J., Hughes, L., Hummon, W., Hyzny, M., Iniesta, L. swot (last assess: 1 June 2016), 2015. F. M., Iseto, T., Ivanenko, S., Iwataki, M., Jarms, G., Jaume, Marchante, H., Morais, M. C., Gamela, A., and Marchante, E.: Us- D., Jazdzewski, K., Kaminski, M., Karanovic, I., Kim, Y. H., ing a WebMapping platform to engage volunteers to collect data King, R., Kirk, P. M., Kociolek, J. P., Kolb, J., Kotov, A., Krapp- on invasive plants distribution, T. GIS, 21, 238–252, 2017. Schickel, T., Kremenetskaia, A., Kristensen, R., Kullander, S., Maynard, J. A., Mckagan, S., Raymundo, L., Johnson, S., Ahmadia, La Perna, R., Lambert, G., Lazarus, D., Le Coze, F., LeCroy, S., G. N., Johnston, L., Houk, P., Williams, G. J., Kendall, M., and Leduc, D., Lefkowitz, E. J., Lemaitre, R., Lörz, A. N., Lowry, Heron, S. F.: Assessing relative resilience potential of coral reefs J., Macpherson, E., Madin, L., Mah, C., Mamos, T., Manconi, to inform management, Biol. Conserv., 192, 109–119, 2015. R., Mapstone, G., Marek, P. E., Marshall, B., Marshall, D. J., McLeod, E., Moffitt, R., Timmermann, A., Salm, R., Menviel, L., McInnes, S., Meidla, T., Meland, K., Merrin, K., Messing, C., Palmer, M. J., Selig, E. R., Casey, K. S., and Bruno, J. F.: Miljutin, D., Mills, C., Mokievsky, V., Molodtsova, T., Monniot, Warming Seas in the Coral Triangle; Coral Reef Vulnerability F., Mooi, R., Morandini, A. C., Moreira da Rocha, R., Moretz- and Management Implications, Coast. Manage., 38, 518–539, sohn, F., Mortelmans, J., Mortimer, J., Musco, L., Neubauer, T. https://doi.org/10.1080/08920753.2010.509466, 2010. A., Neuhaus, B., Ng, P., Nguyen, A. D., Nielsen, C., Nishikawa, Michener, W. K.: Ecological data sharing, Ecol. Inform., 29, 33–44, T., Norenburg, J., O’Hara, T., Okahashi, H., Opresko, D., Os- 2015. awa, M., Ota, Y., Patterson, D., Paxton, H., Perrier, V., Perrin, Michener, W. K., Brunt, J. W., Helly, J. J., Kirchner, T. B., and W., Petrescu, I., Picton, B., Pilger, J. F., Pisera, A., Polhemus, Stafford, S. G.: Nongeospatial metadata for the ecological sci- D., Pugh, P., Reimer, J. D., Reip, H., Reuscher, M., Rius, M., ences, Ecol. Appl., 7, 330–342, 1997. Rützler, K., Rzhavsky, A., Saiz-Salinas, J., Santos, S., Sartori, MoF-MoMAF: Data of the Ecological representation gap analysis A. F., Satoh, A., Schatz, H., Schierwater, B., Schmidt-Rhaesa, for conservation areas in Indonesia, Ministry of Forestry and A., Schneider, S., Schönberg, C., Schuchert, P., Senna, A. R., Ministry of Marine Affairs and Fisheries, Jakarta, Indonesia, Serejo, C., Shamsi, S., Sharma, J., Shenkar, N., Short, M., Sicin- 2010. ski, J., Siegel, V., Sierwald, P., Simmons, E., Sinniger, F., Sivell, MoMAF: The database of Marine Protected Areas in Indonesia, D., Sket, B., Smit, H., Smol, N., Souza-Filho, J. F., Spelda, J., Ministry of Marine Affairs and Fisheries, Jakarta, Indonesia, Stampar, S. N., Sterrer, W., Stienen, E., Stoev, P., Strand, M., 2016. Suárez-Morales, E., Summers, M., Suttle, C., Swalla, B. J., Taiti, Morets, D.: Internet GIS, in: Encyclopedia of GIS, edited by: S., Tandberg, A. H., Tang, D., Tasker, M., Taylor, J., Tchesunov, Shekhar, S., Xiong, H., and Zhou, X., Springer International, A., ten Hove, H., ter Poorten, J. J., Thomas, J., Thuesen, E. V., Cham, Switzerland, 1074–1081, 2017. Thurston, M., Thuy, B., Timi, J. T., Timm, T., Todaro, A., Turon, Neumann, A.: Web Mapping and Web Cartography; Encyclopaedia X., Tyler, S., Uetz, P., Utevsky, S., Vacelet, J., Vader, W., Väinölä, of GIS, Springer, Boston, MA, 1261–1269, 2008. R., van der Meij, S. E., van Soest, R., Van Syoc, R., Venekey, OBIS: Data from the Ocean Biogeographic Information System, V., Vonk, R., Vos, C., Walker-Smith, G., Walter, T. C., Watling, Intergovernmental Oceanographic Commission of UNESCO, L., Wesener, T., Whipps, C., White, K., Williams, G., Wilson, R., available at: http://www.iobis.org/, last access: 22 January 2015. Wyatt, N., Wylezich, C., Yasuhara, M., Zanol, J., and Zeidler, W.: Polidoro, B. A., Carpenter, K. E., Collins, L., Duke, N. C., El- World Register of Marine Species (WoRMS), WoRMS Editorial lison, A. M., Ellison, J. C., Farnsworth, E. J., Fernando, E. Board, available at: http://www.marinespecies.org/, last access: S., Kathiresan, K., Koedam, N. E., Livingstone, S. R., Miyagi, 1 June 2016. T., Moore, G. E., Vien, N. N., Ong, J. E., Primavera, J. H., IUCN: The IUCN Red List of Threatened Species, Version 2015.4, Salmo, S. G., Sanciangco, J. C., Sukardjo, S., Wang, Y. M., and available at: https://www.iucnredlist.org/, last assess: 19 Novem- Yong, J. W. H.: The loss of species: Mangrove extinction risk ber 2015. and geographic areas of global concern, Plos One, 5, e10095, IUCN and UNEP-WCMC: The World Database on Protected Ar- https://doi.org/10.1371/journal.pone.0010095, 2010. eas (WDPA), UNEP – World Conservation Monitoring Centre, Parr, C. S. and Thessen, A. E.: Biodiversity Informatics, in: Ecolog- Cambridge, UK, available at: https://www.protectedplanet.net/, ical Informatics; Data Management and Knowledge Discovery, last assess: 1 August 2016. edited by: Recknagel, F. and Michener, W. K., Springer Interna- Jetz, W., McPherson, J. M., and Guralnick, R. P.: Inte- tional Publishing, Cham, Switzerland, 375–399, 2018. grating biodiversity distribution knowledge: toward a Pauly D. and Zeller D. (Eds.): Sea Around Us Concepts, Design global map of life, Trends Ecol. Evol., 27, 151–159, and Data, available at: http://www.seaaroundus.org/ (last access: https://doi.org/10.1016/j.tree.2011.09.007, 2012. 1 April 2018), 2015. Kaschner, K., Rius-Barile, J., Kesner-Reyes, K., Garilao, C., Kul- Peterson, M. P.: International perspectives on maps and the Internet, lander, S. O., Rees, T., and Froese, R.: AquaMaps; Predicted Springer, Berlin Heidelberg, 2018. range maps for aquatic species, World Wide Web electronic pub- Reichman, O. J., Jones, M. B., and Schildhauer, M. P.: Challenges lication, Version 08/2016, available at: http://www.aquamaps. and opportunities of open data in ecology, Science, 331, 703– org/, last assess: 1 August 2016. 705, 2011 Kot, C. Y., Fujioka, E., DiMatteo, A., Wallace, B., Hutchinson, B., Saeedi, H., Dennis, T. E., and Costello, M. J.: Bimodal latitudinal Cleary, J., Halpin, P., and Mast, R.: The State of the World’s Sea species richness and high endemicity of razor clams (Mollusca), www.earth-syst-sci-data.net/11/163/2019/ Earth Syst. Sci. Data, 11, 163–174, 2019
174                                                                                 I. Asaad et al.: Atlas for biodiversity conservation

  J. Biogeogr., 44, 592–604, https://doi.org/10.1111/jbi.12903,           VLIZ: Maritime Boundaries Geodatabase, Version 8, available at:
  2016.                                                                     http://www.marineregions.org/ (last access: 22 March 2016),
Sui, D.: Opportunities and Impediments for Open GIS, T. GIS, 18,            2014.
  1–24, https://doi.org/10.1111/tgis.12075, 2014                          Van Hooidonk, R., Maynard, J., Tamelander, J., Gove, J., Ah-
Teacher, A. G., Griffiths, D. J., Hodgson, D. J., and Inger, R.: Smart-     madia, G., Raymundo, L., Williams, G., Heron, S. F., and
  phones in ecology and evolution; A guide for the app-rehensive,           Planes, S.: Local-scale projections of coral reef futures and
  Ecol. Evol., 3, 5268–5278, 2013.                                          implications of the Paris Agreement, Sci. Rep., 6, 39666,
UNEP-WCMC: The Checklist of CITES Species Website, CITES                    https://doi.org/10.1038/srep39666, 2016.
  Secretariat, Geneva, Switzerland, Compiled by UNEP-WCMC,                Wright, D., Pendleton, M., Boulware, J., Walbridge, S., Gerlt, B.,
  Cambridge, UK, available at: http://checklist.cites.org (last ac-         Eslinger, D., Sampson, D., and Huntley, E.: ArcGIS Benthic Ter-
  cess: 1 February 2016), 2015.                                             rain Modeler (BTM), V. 3.0, Environmental Systems Research
UNEP-WCMC and Short, F. T.: Global distribution of seagrasses               Institute (ESRI), NOAA Coastal Services Centre, Massachusetts
  (version 3.0), 3rd update to the data layer used in Green and Short       Office of Coastal Zone Management, Redlands, CA, 2012.
  (2003), UNEP World Conservation Monitoring Centre, Cam-                 Wright, D. J. (Ed.): Ocean Solutions, Earth Solutions, 2nd edn., Esri
  bridge, UK, available at: http://data.unep-wcmc.org/datasets/7            Press, Redlands, CA, 2016.
  (last access: 1 June 2016), 2005.                                       Wright, D. J, Dwyer, N., and Cummins, V. (Eds.): Coastal Informat-
UNEP-WCMC, WorldFish Centre, WRI, and TNC: Global distribu-                 ics: Web Atlas Design and Implementation, IGI-Global, Hershey,
  tion of coral reefs, compiled from multiple sources including the         New York, 2011.
  Millennium Coral Reef Mapping Project, Version 1.3, updated             Walton, A., White, A. T., Tighe, S., Alino, P. M., Laroya,
  by UNEP-WCMC, includes contributions from IMaRS USF and                   L., Dermawan, A., Kasasiah, A., Hamid, S. A., Vave-
  IRD (2005), IMaRS-USF (2005) and Spalding et al. (2001),                  Karamui, A., Genia, V., Martins, L. D., and Green, A.
  UNEP World Conservation Monitoring Centre, Cambridge, UK,                 L.: Establishing a functional region-wide Coral Triangle ma-
  available at: http://data.unep-wcmc.org/datasets/1 (last access:          rine protected area system, Coast. Manage., 42, 107–127,
  1 June 2016), 2010.                                                       https://doi.org/10.1080/08920753.2014.877765, 2014.
Veron, J., Devantier, L. M., Turak, E., Green, A. L., Kininmonth,
  S., Stafford-Smith, M., and Peterson, N.: Delineating the Coral
  Triangle, Galaxea, Journal of Coral Reef Studies, 11, 91–100,
  2009.

Earth Syst. Sci. Data, 11, 163–174, 2019                                                     www.earth-syst-sci-data.net/11/163/2019/
You can also read