Analysis, Assessment and Early Warning of Mudflow Disasters along the Shigatse Section of the China-Nepal Highway - De Gruyter
←
→
Page content transcription
If your browser does not render page correctly, please read the page content below
Open Geosci. 2020; 12:44–58
Research Article
Liming Xiao, Yonghong Zhang*, Taotao Ge, Chen Wang, and Ming Wei
Analysis, Assessment and Early Warning of
Mudflow Disasters along the Shigatse Section of
the China–Nepal Highway
https://doi.org/10.1515/geo-2020-0004 Keywords: Shigatse section of the China–Nepal Highway,
Received Jan 07, 2019; accepted Nov 22, 2019 mudflow, disaster analysis, risk assessment, early warning
model
Abstract: China–Nepal Highway is an important interna-
tional passage connecting China and Nepal. Owing to its
location in a complex mountainous area in the Qinghai–
Tibet Plateau, the Shigatse section of the China–Nepal 1 Introduction
Highway is often impacted and troubled by mudflow. In
order to effectively conduct road construction and mainte- 1.1 Introduction to the Shigatse section of
nance and improve early disaster-warning capability, the
the China–Nepal Highway
relationship between various hazard factors and disaster
points was analysed. It is found that four factors such as
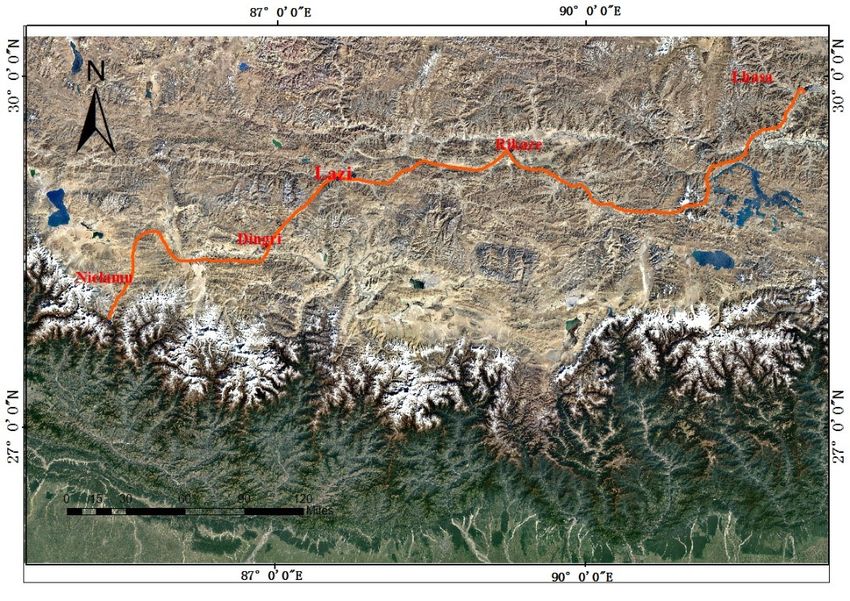
China–Nepal Highway, located in the central part of the
slope, precipitation, soil type and digital elevation have
Hindu Kush–Himalayan region, begins in the east in
the strongest correlation with the occurrence of the dis-
Lhasa, which is the capital city of the Tibet Autonomous
asters. From the distribution of disaster points, it is ob-
Region of the People’s Republic of China; it ends towards
served that the disaster point is closely related to the slope,
the west in Kathmandu, which is the capital of the Federal
its local correlation with precipitation is good and the its
Democratic Republic of Nepal. It is 943 km long and the
local correlation with the soil type and Digital Elevation
most important land-based connecting passage between
Model (DEM) data is significant. In order to quantitatively
China and Nepal. It is the “golden corridor” of tourism in
evaluate the susceptibility of mudflow disasters in the Shi-
the Tibet Autonomous Region and an important part of
gatse region, this paper uses the analytic hierarchy process
China’s “One Belt, One Road” initiative, as shown in Fig-
(AHP) as the main analysis method supplemented by the
ure 1. According to the statistics of the Ministry of Com-
fuzzy clustering method. The results show that the slope,
merce of the People’s Republic of China, the bilateral trade
when accompanied by heavy rainfall, is the most impor-
volume between China and Nepal reached 993 million USD
tant factor among four factors. In this paper, the neural
in 2017, a yearly increase of 11.2% over the last year. China–
network method is used to establish the identification and
Nepal Highway has played a very important role as the
early warning model of mudflow susceptibility. When the
main connecting road between the two countries. In 2017,
recognition rate reaches 66% or above, it can be used as an
bilateral trade between China and Nepal reached US$993
early-warning threshold for mudflow disasters. This study
million.
has conducted a useful exploration of the research, assess-
The Shigatse region is the bridgehead from China to
ment and early warning of mudflow disasters along the
Nepal, additionally, it is a region susceptible to mudflow.
Shigatse section of the China–Nepal Highway.
The frequent mudflow disasters in the Shigatse section
have hindered the smooth traffic of the China-Nepal High-
way. Therefore, it is urgent and pragmatic to study the iden-
*Corresponding Author: Yonghong Zhang: School of Automation, tification and early warning of mudflow disasters in the
Nanjing University of Information Science and Technology, 210044 plateau and mountains.
Nanjing, China; Email: zhangyhnew@163.com
Liming Xiao, Taotao Ge: School of Automation, Nanjing University
of Information Science and Technology, 210044 Nanjing, China
Chen Wang, Ming Wei: Collaborative Innovation Center on Fore-
cast and Evaluation of Meteorological Disasters, Nanjing University
of Information Science and Technology, 210044 Nanjing, China
Open Access. © 2020 L. Xiao et al., published by De Gruyter. This work is licensed under the Creative Commons Attribution 4.0
License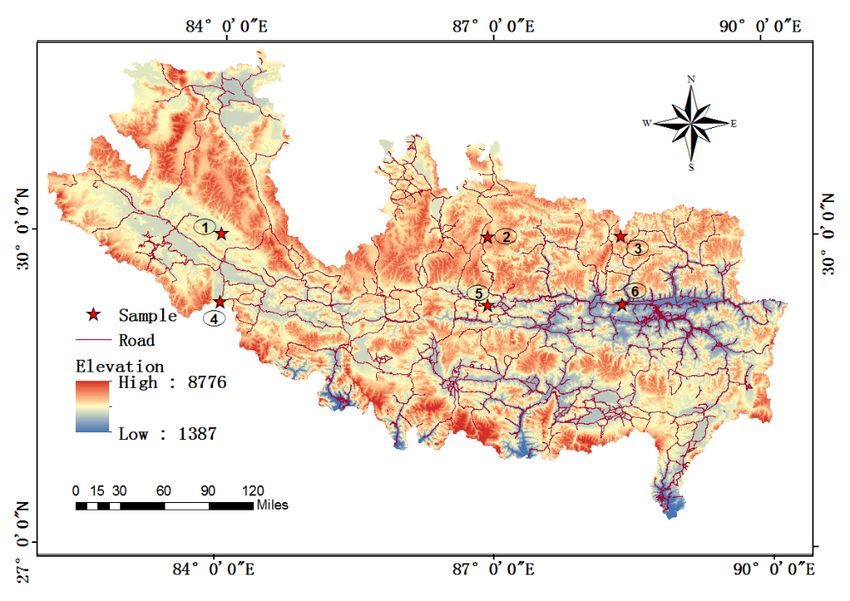
Analysis, Assessment and Early Warning of Mudflow Disasters along the Shigatse Section |   45

Figure 1: Location map of China–Nepal Highway (the red line in the picture represents the China–Nepal Highway)

1.2 Research progress                                                area as training points instead of using a point to repre-
                                                                     sent the mudflow catchment; then, geomorphology, lithol-
Nguyen combined remote sensing and GIS (Geographic In-               ogy, faults, earthquakes and river system were selected to
formation System) technology with the AHP to determin-               serve as evidence for analysis. The optimal buffer cutoff
ing the weights of various environmental factors in trigger-         distance of faults and rivers is determined by the maxi-
ing debris flow and to map the ecotone [1]. Xu established           mum study value of contrast ratio; finally, based on the
an information value model to calculate a total of seven im-         subject of evidence, the mudflow susceptibility map in
pact factors: elevation, slope, aspect, flow accumulation,           Kangding County is obtained [4]. Wang used SPOT5 im-
vegetation coverage, soil type and land use. The compre-             ages, DEM, the lithology distribution map and rainfall data
hensive information value was analysed using GIS tech-               to identify the triggering factors for mudflow susceptibil-
nology to determine the mudflow susceptibility [2]. Zhang            ity classification. Principal Component Analysis and Self-
selected the following seven major factors: loose material           organising Maps methods were used to analyse the trig-
volume per square kilometre, loose material supply length            gering factors such as basin relief ratio, slope gradient in
ratio, average gradient of the main channel, average hill            the initiation zone, drainage density, downslope curvature
slope, drainage density, curvature of the main channel and           of the main channel, vegetation coverage, main channel
poor vegetation area ratio and then analysed their impacts           aspect, topographic wetness index(TWI), Meltons rugged-
on the susceptibility of mudflow. The researchers used the           ness number, lithology, annual rainfall, form factor, and
combination weighting method, AHP and entropy weight                 cross-slope curvature of the transportation zone. The 14
method to select major factors causing mud-rock flow [3].            triggering factors were analysed to evaluate the mudflow
Chen modified the method of determining training points              disasters, and the results were further verified [5]. Truong
by setting the cells covered by the mudflow catchment                proposed a new machine learning integration method, i.e.,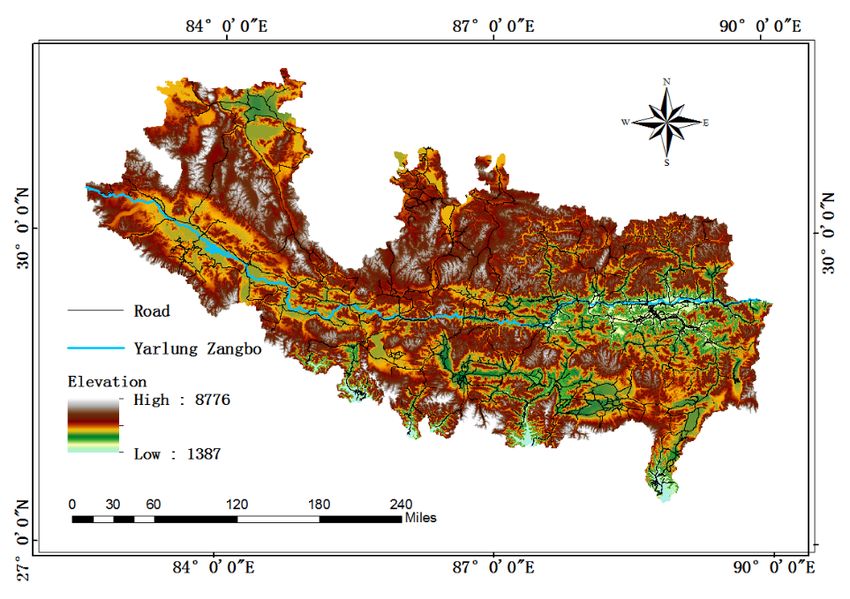
46 | L. Xiao et al.

a hybrid method of Bagging Ensemble (BE) and Logistic and compiled the following ten mudflow conditioning fac-
Model Tree (LMtree), called BE-LMtree. The following eight tors to determine the relationship between mudflow con-
triggering factors were extracted: slope, aspect, elevation, ditioning factors and mudflow inventory map: land use,
land cover, soil type, lithology, distance to faults and dis- distance to drainage, slope, elevation, lithology, distance
tance to river; 255 landslides were trained and verified. The to roads, distance to faults, slope orientation, TWI, and
performance of the new method is better than the support stream power index. Among these mudflow conditioning
vector machine and LMtree models [6]. Chang numerically factors, land use was found to be an important factor af-
simulated the mudflow intensity, velocity and maximum fecting mudflow [12] Ba compared the slope unit and grid
depth using the FLO-2D numerical analysis software and cell as the mapping unit for mudflow susceptibility as-
combined the regression cycles of 20, 100 and 200 years sessment. Using the improved information value model,
to classify the mudflow hazard levels in the study area [7]. the mudflow susceptibility maps based on slope units and
Aditian selected the following eight mudflow susceptibil- grid cells were obtained. Receiver Operating Characteristic
ity factors in Ambon to verify and compare the accuracy curve was used to evaluate the results, and mudflow sus-
of the mudflow susceptibility models based on bivariate ceptibility mapping based on slope units was found to per-
frequency ratio, multivariate logistic regression and artifi- form better than the grid cell-based method [13]. Tekin se-
cial neural network: elevation, slope, aspect, distance to lected 78%–83% for the training set and 17%–22% for the
river network, lithology, density of geological boundaries, validation set and used the LR model to model the mud-
distance to faults and distance to road network. Among flow susceptibility, including factors such as geology, land-
these susceptibility factors, Neural network model has ad- form classification, land use, elevation, slope, plane curva-
vantages in explaining the relationship between debris ture, profile curvature, slope length factor, solar radiation,
flow and other factors [8]. Othman extracted 16 geomor- stream power index, slope second derivate, TWI, heat load
phological factors mainly from the Digital Elevation Model index, mean slope, slope position, roughness, dissection,
(DEM) and evaluated and compared the frequency ratio, surface relief ratio, linear aspect and slope/aspect ratio.
weight of evidence, logistic regression and probability re- The results show that the susceptibility map generated us-
gression methods combined with geomorphological fac- ing the random selections considering the entire mudflow
tors to determine mudflow susceptibility. The results show polygons has better predictive ability [14]. Li mainly anal-
that the prediction results of each model are similar, and ysed the geological background, structure and genesis of
the focus should be on the careful selection of key fac- the large-scale mudflow in Guanzhong region. Through
tors. The most important factors for mudflow are lithol- geological surveys and physical mechanism testing, it is
ogy and slope [9]. Polykretis (2018) compared the perfor- found that the clay layer is the main rupture surface of ge-
mance of the weight of evidence, logistic regression (LR) ological disasters [15].
models and artificial neural network models in mudflow
susceptibility. The models selected the following eight fac-
tors: elevation, slope angle, aspect, distance to road net- 1.3 Destruction of roads by mudflow
work, distance to drainage network, distance to tectonic            disasters
elements, land cover and lithology to evaluate the factors
responsible for mudflow formation based on model train- Owing to the instability of the young mountain range in
ing. The results show that the training results of the three the Hindu Kush–Himalayan region, the geological struc-
models are promising, and the LR model is optimal [10]. ture and stratigraphic lithology along the Shigatse sec-
Mahdadi identified ten mudflow-related factors for assess- tion of the China–Nepal Highway are complex. The active
ing the susceptibility of mudflow and establishing mod- neotectonics movement, varying hydrothermal conditions
els to predict mudflow-prone areas. LR, frequency ratio and strong glacial activity all contribute to the frequent
and weight of evidence were used to evaluate the suscep- occurrence of mudflow disasters. The mountainous disas-
tibility. Through the visual interpretation of satellite im- ters have seriously affected the normal operation of the
ages and field survey data, the mudflow inventory map highway and hindered the progress of bilateral trade be-
was established, and the study area was divided into the tween China and Nepal. In addition, in recent years, be-
following five levels of susceptibility: very low, low, mod- cause of the impact of extreme global climate change and
erate, high and very high is verified that the LR model is the increasing disturbance of the geological environment
more reliable than the other two methods [11]. Shirani used caused by major engineering activities, the frequency and
the Index of Entropy and Dempster–Shafer (DS) models to intensity of mountainous disasters along the China–Nepal
establish mudflow susceptibility maps in the study area Highway have increased, resulting in growing casualties
Analysis, Assessment and Early Warning of Mudflow Disasters along the Shigatse Section |   47

and economic losses. Therefore, in order to reduce the      diverse and comprises mountains, wide valleys and lake
hazards posed by mountainous disasters such as mud-         basins with an average elevation of over 4,000 m [16].
flow along the China–Nepal Highway, safeguard people’s          There are roughly three regional climates in Shigatse:
lives and property along the highway and provide deci-      plateau temperate semi-arid monsoon climate between
sion support for the road reconstruction and rectification, the north of the Himalayas and south of the Gangdise-
conducting scientific research, risk assessment and provi-  Nyenchen Tanglha Mountains, plateau sub-frigid mon-
sion of early warning of the mountainous disasters along    soon semi-arid and arid climate in a small part of the
the China–Nepal Highway has meaningful research signif-     Gangdise- Nyenchen Tanglha Mountains and plateau tem-
icance and application values.                              perate monsoon semi-humid climate in the area south
                                                            of the main ridge of the Himalayas. The dry and rainy
                                                            seasons in Shigatse are distinct. The spatial distribution
1.4 Significance of research on disaster                    of precipitation is uneven; there is more precipitation in
       warning                                              the east (200–430 mm) and less in the northwest (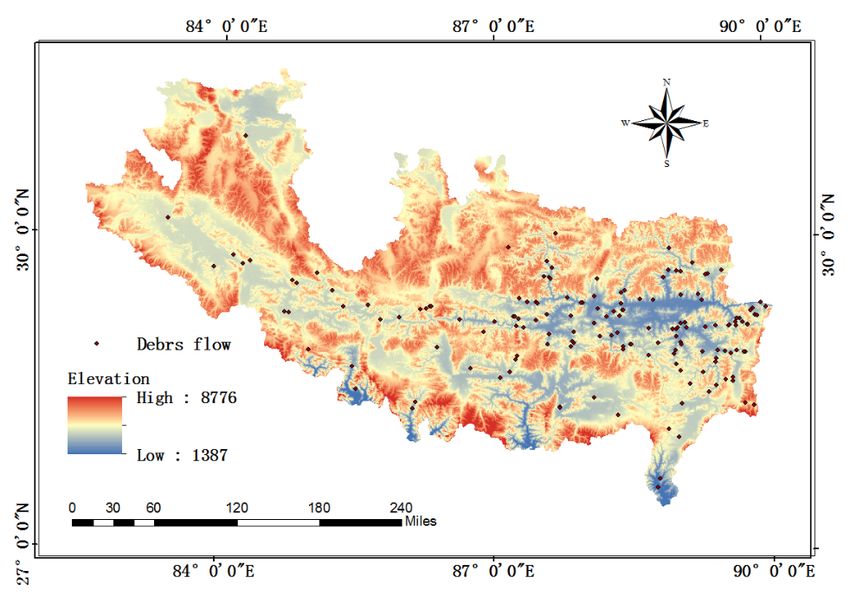
48 | L. Xiao et al.
Figure 2: Shigatse area map (including roads and the Yarlung Zangbo River)
Table 1: Classification of environmental factors affecting mudflow
Type Factor Data Scale Source
(resolution)
Terrain Slope, Aspect, DEM 30m·30m Geospatial data cloud
Elevation,
Curvature
Soil Sand, Clay, Silt Soil type map 1:1000000 Institute of Geographic Sciences and Natural
Resources Research at Chinese Academy of
Sciences
Vegetation NDVI Landsat8 30m·30m Geospatial data cloud
Climate Average annual Tropical Rainfall 0.25∘ ·0.25∘ NASA
precipitation Measuring
Mission (TRMM)
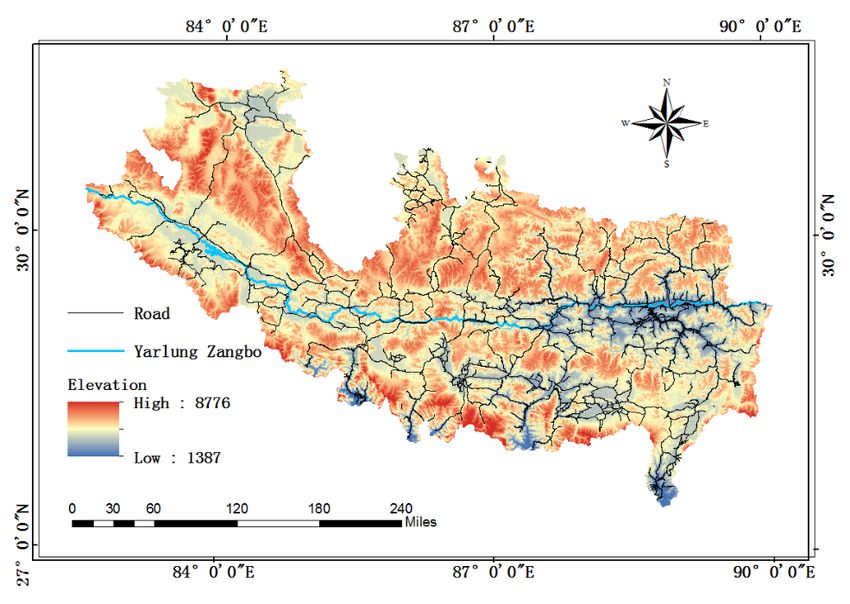
It can be seen from Figures 3 and 4 that the Yarlung represent the difference in elevation. This difference in dig-
Zangbo River crosses the Shigatse region from west to east. ital elevation forms a significant slope, which is more sus-
The China–Nepal Highway runs along the valley, and the ceptible to mudflow.
river generally runs parallel to the road. In the figure, the The mudflow information was provided by Tibet Mete-
brown area is the plateau mountain, green corresponds to orological Bureau of China. The location of point element
the valley and the grassland and different colour blocks is the core area of debris flow event. These events could be
Analysis, Assessment and Early Warning of Mudflow Disasters along the Shigatse Section |   49

Figure 3: Digital elevation map of the Shigatse region (blue represents the river, black represents the road)

Figure 4: Digital elevation map of the mudflow disasters in the Shigatse region (black dot represents the disaster point)

50 | L. Xiao et al.

Figure 5: Distribution of mountain slopes and mudflow disaster points in the Shigatse region (black dot represents the disaster point)

found in geological cloud site (http://geocloud.cgs.gov.cn/            3.4 Average annual precipitation
#/portal/home).
                                                                       May to September every year is the rainy season of the Shi-
                                                                       gatse region. The precipitation in this period accounts for
3.3 Slope                                                              more than 90% of the annual precipitation. The precipita-
                                                                       tion mainly occurs in July and August. During this period,
The unique plateau mountainous landforms in the Shi-                   it rains more at night, and thunderstorms and hail are com-
gatse region makes the area gully and undulating, and                  mon. The precipitation at night accounts for 70%–80% of
the slopes of the mountains are steep. Slope is an essen-              the total precipitation. The spatial distribution of precipi-
tial factor in the assessment of mudflow susceptibility be-            tation is uneven, with more in the east (200–430 mm) and
cause heavy precipitation in the region causes mudflow                 less in the northwest (
Analysis, Assessment and Early Warning of Mudflow Disasters along the Shigatse Section | 51

Figure 6: Distribution of average annual precipitation and mudflow disaster points in Shigatse region (black dot represents the disaster
point)

valley area is less than the rainfall in the high mountains       The topography and geology of Tibet are as follows:
on both sides of the river. The south side of the China–     mountainous areas account for 20%, high mountains ac-
Nepal Highway is the windward slope of the Himalayas,        count for 53%, and steep mountains account for 27%. The
and the warm and humid air from the Indian Ocean along       high slopes along the route are steep, and adverse geolog-
the Bay of Bengal supplies abundant water vapour to the      ical processes are well developed. The soil quality ratio is
area. Combined with large elevation drop and slope, all      clay and fine medium sand: gravel and other gravel soil:
factors lead to the high occurrence of mudflow disasters     rock =10:6:84. (https://wenku.baidu.com/view/0e754340f
in the area.                                                 11dc281e53a580216fc700abb6852ec.html?from=search).
                                                                  It can be seen from Figure 7 that along the China–
                                                             Nepal Highway, particularly in the 88∘ –90∘ degrees east-
3.5 Soil condition                                           ern region, the ratio of clay to sand is obviously lower, the
                                                             soil is relatively loose, and it is difficult to lock the roots
The Shigatse region has complex geological structures, of plants. During extreme weather such as heavy precipi-
varied stratigraphic lithology and fragile geological envi- tation, mudflow will likely occur.
ronment. The soil is mostly composed of clay, sand and silt.      As shown in Figure 8, the valley area along the China–
Under normal circumstances, areas with lower clay and Nepal Highway is in the 86∘ –88∘ western region. Corre-
higher sand ratios are more susceptible to mudflow. The sponding to the clay ratio distribution in Figure 7, the sand
area with a low clay ratio in the east, shown in Figure 7, ratio in this area is obviously higher, the soil is relatively
and the area with a high sand ratio in the west, shown loose and it is difficult to lock the roots of plants. Mudflow
in Figure 8, are susceptible to mudflow owing to their soil
type.
52 | L. Xiao et al. Figure 7: Distribution of clay ratio and mudflow disaster points in Shigatse region (black dot represents the disaster point) Figure 8: Distribution of sand ratio and mudflow disaster points in the Shigatse region (black dot represents the disaster point)
Analysis, Assessment and Early Warning of Mudflow Disasters along the Shigatse Section | 53

Table 2: Test data for verifying the susceptibility of mudflow disasters

       No                 Location 1           Location 2          Location 3    Location 4        Location 5        Location 6
    Latitude                30.00                30.00               30.00         29.33             29.33             29.33
   Longitude                84.00                87.00               88.50         84.00             87.00             88.50
Digital Elevation           5802                 6925                6925          5079              3233              6002
     Slope                    33                  33                   45            30                66                44
 Precipitation               700                 1115                 284           423               700               561
   Sand Ratio                 3                    8                   32            22                16                32

is likely to occur in extreme weather conditions such as
heavy precipitation.

4 Evaluation of mudflow disaster
4.1 Evaluation method
Mudflow refers to the mountains or other deep valleys,
steep terrain regions, because of heavy rain, blizzard, or
other natural disasters caused by landslides and special
with a large number of sediment and rocks in the torrent,
is essentially a strong surface change, only when the de-
bris flow of human living environment including build-
ings, transport facilities, life and property is dangerous,
as disasters. Take for example the landslide in Zhangmu
section on 18 September 2017, which caused damage to
the China-Nepal Highway, so it is called a disaster. Fig-
ure 9 is the landslide between Nyalam and Zhangmu on
18 September 2017, covers an area of about 300 square me-
ters. In general, this paper only focuses on the distribution
of landslides or debris flows, and do not care about some
specific area.
     According to the above analysis of the hazard factors,
the factors causing the mudflow disasters along the China–
Nepal Highway are diverse. The physical mechanism of
the interaction between these factors is complex. In or-
der to quantitatively assess the mudflow susceptibility in Figure 9: The Mudflow occurred between Nyalam and Zhangmu on
the Shigatse region, this research uses the analytic hierar- 18 September 2017. (Photographed by the author)
chy process (AHP) and fuzzy clustering method for calcu-
lation, with AHP [18] as the main analytical method and
fuzzy clustering method [19–21] as the verification method. 4.2 The verification of the vusceptibility of
AHP combines qualitative and quantitative decision anal-            mudflow disasters
ysis methods to provide a basis for selecting the best solu-
tion by dividing complex problems into several levels and In order to verify the susceptibility of mudflow disasters
factors. The fuzzy clustering method constructs the fuzzy by using AHP and fuzzy clustering method, six locations
matrix according to the attributes of the research object it- in the Shigatse region were selected for this test. The rel-
self. Subsequently, the clustering relationship between the evant data are shown in Table 2, and the corresponding
samples is determined on the basis of a certain degree of location distribution map is shown in Figure 9. These lo-
similarity.                                                   cations were selected based on the following characteris-
54 | L. Xiao et al. Figure 10: Distribution map of six test locations for mudflow susceptibility analysis (the star represents sample point) Figure 11: Overall risk map of the Shigatse area along with the China–Nepal Highway
Analysis, Assessment and Early Warning of Mudflow Disasters along the Shigatse Section | 55

tics: locations 1 and 4 are distributed along the north and            termined using different values of multiple factors:
south sides of the valley in the western part of the study             although its digital elevation is the smallest, loca-
area, locations 2 and 3 are distributed on the mountains               tion 5 is where the mudflow is most likely to occur
on the north side of the valley in the eastern part of the             because it has the highest slope. Although location
study area and locations 5 and 6 are distributed near the              2 has the largest amount of precipitation, mudflow
valley in the eastern part of the study area. These six loca-          susceptibility is lower owing to its lower slope. Lo-
tions represent various topographies in order to make the              cation 1 has the lowest sand ratio and lower slope,
mudflow susceptibility verification relatively objective.              so mudflow is the least likely to occur. Although lo-
     In order to know the total risk of debris flow in Shigatse        cation 3 has the highest sand ratio and digital eleva-
area, it is necessary to get the overall risk map of this place.       tion, the amount of precipitation is the lowest; there-
Based on the above research, the risk value of each grid               fore, the mudflow susceptibility is low.
point in the whole area is used to generate the overall risk           Therefore, in the mudflow disaster along the China–
map. The overall risk map of debris flow in Shigatse area is           Nepal Highway, the slope is the most important
shown in Figure 11. As can be seen from Figure 11, the risk            among the four factors, and need to be combined
of red area is high, so along the valley of the China–Nepal            with heavy rainfall. The area with high sand ratio is
Highway, the risk of debris flow is high.                              only susceptible to mudflow when supplemented by
                                                                       a larger amount of precipitation. The digital eleva-
                                                                       tion has the lowest impact among the four factors.
4.3 AHP test
AHP (analytic hierarchy process) is the decision mak-              4.4 Fuzzy clustering test
ing method combining qualitative and quantitative anal-
ysis [18]. Weight factors of hierarchical decision-making            1. When constructing fuzzy matrix R, the maximum
can be selected by experts. After discussion by researchers,            and minimum method in the similarity coefficient
initially it is considered that the contribution of digital el-         method is used, i.e.
evation, slope, precipitation and ratio of sand and soil to                                  ∑︀m (︀            )︀
debris flow is the same, so the selected analytic hierarchy                                    k=1 x ik ∧ x jk
                                                                                      r ij = ∑︀m (︀            )︀ ,   (2)
process weights are the same. Following are steps for anal-                                    k=1 x ik ∨ x jk

ysis.                                                                2. The fuzzy equivalent matrix of this paper is:
   1. To find the weight vector of the consistency decision
                                                                       ⎡                                                       ⎤
                                                                           1      0.7332   0.5974   0.5974   0.5974     0.5974
      matrix, the summation method is used. The specific               ⎢0.7332
                                                                       ⎢             1     0.5974   0.5974   0.5974     0.5974⎥⎥
                                                                       ⎢0.5974    0.5974      1     0.7346   0.6172     0.8719⎥
      formula is:                                                      ⎢                                                       ⎥
                                                                       ⎢0.5974    0.5974   0.7346      1     0.6172     0.7346⎥
                                                                       ⎢                                                       ⎥
                       n
                    1 ∑︁     a ij                                      ⎢
                                                                       ⎣0.5974    0.5974   0.6172   0.6172      1       0.6172⎦
                                                                                                                               ⎥
               wi =       ∑︀n        (i = 1, 2, · · · , n) (1)
                    n       k=1 a kj                                    0.5974    0.5974   0.8719   0.7346   0.6172       1
                      j=1

      where aij is the element of the consistency decision              The optimal threshold can be determined by actual
      matrix.                                                           conditions or by experienced experts. The general
   2. In the test, for objective decision, the weights of the           approach is to take the elements on the main diago-
      digital elevation, slope, precipitation and sand ra-              nal of the fuzzy equivalence matrix as the threshold.
      tio are assumed to be the same. Using MATLAB pro-                 The selection of 0.5974 as the threshold can exactly
      gramming calculation, the total AHP scores of loca-               divide the six sites into two categories.
      tions 1–6 were 0.0754, 0.0992, 0.1171, 0.1171, 0.1171          3. Through a MATLAB programming calculation, it
      and 0.1409 respectively. Therefore, the disaster sus-             can be concluded that when the threshold value is
      ceptibility ranked from low to high is: location 1, lo-           0.5974, the abovementioned six locations can be di-
      cation 2, location 3, location 4, location 6 and loca-            vided into the following two categories: the first is
      tion 5. According to the analysis, locations 5, 6 and 4           less susceptible to disasters (locations 1 and 2) and
      are close to the China–Nepal Highway and the river                the second is more susceptible to disasters (loca-
      valley, which are prone to disasters. Hence, the re-              tions 3, 4, 5 and 6).
      sult is in good agreement with the actual situation.              Comparing the test results of the abovementioned
      It can be seen from the data in Table 2 that the level            methods, both test results are consistent with each
      of susceptibility of the mudflow is complex and is de-            other. The ranking results of the AHP method are
56 | L. Xiao et al.
Table 3: Disaster data in the Shigatse region [Note: In the columns "less susceptible", "more susceptible" and "highly susceptible", the “0”
and “1” stand for "no" and "yes", respectively.]
No Longitude Latitude Digital Slope Precipitation Sand Less sus- More sus- Highly sus-
Elevation ratio ceptible ceptible ceptible
1 87.28 29.20 4282 22.85 259.51 68 0 1 0
2 87.23 29.23 4408 21.96 270.48 44 0 1 0
3 89.65 28.77 4144 20.56 536.68 68 0 1 0
4 87.65 29.64 4116 15.47 361.23 68 0 1 0
...... ...... ...... ...... ...... ...... ...... ...... ...... ......
153 83.02 30.22 4625 6.89 217.17 66 0 1 0
154 89.83 28.82 4283 12.04 586.80 68 1 0 0
155 89.56 28.41 4395 4.14 244.74 68 1 0 0
156 83.95 29.76 4571 10.03 379.60 66 0 1 0
more accurate and effective; hence, it is suitable for 5.2 Test plan design
the analysis of mudflow susceptibility in the region.
The results of the fuzzy clustering method validate 70% of the data was randomly extracted from the 156
the conclusion of the AHP and can be used as an aux- datasets as training set, and 30% of the data was used as
iliary method for the analysis of mudflow suscepti- test set. The attributes of digital elevation, slope, precipi-
bility in the region. tation and sand ratio in each data set are normalized and
trained as input nodes. The neural network parameters of
this test were set as follows: four neurons in the input layer,
three neurons in the output layer and three hidden layers
5 Establishment of an early with ten neurons in each layer, as shown in Figure 12.
warning model
In order to further study the early warning of mudflow dis-
asters along the Shigatse section of the China–Nepal High-
way, the neural network prediction method was used to
repeatedly test and calculate the identification and early-
Figure 12: Schematic diagram of the neural network
warning threshold value.
In this test, a total of 156 datasets were selected from
Shigatse region, 40 of which were less susceptible to dis- The learning algorithm selected in this experiment is
asters, 108 were more susceptible to disasters and eight the error inverse propagation algorithm. The activation
were highly susceptible to disasters. Each group of data function from the input layer to the hidden layer, between
consists of six attributes: longitude, latitude, digital eleva- the three hidden layers and from the hidden layer to the
tion, slope, precipitation and sand ratio. Part of the data is output layer are all ReLU functions (Rectified Linear Units,
shown in Table 3. ReLU = max(0,x)). The advantages of the ReLU function
are as follow: (1) solves the vanishing gradient problem (in
the positive region); (2) faster calculation and convergence
5.1 Neural network method speeds; (3) ReLU will make part of the neuron output be-
come 0, causing a sparse network and reducing the inter-
The neural network [22, 23] is a broad and interconnected dependence of parameters, which alleviates the problem
network of adaptive yet simple units whose organisation of over-fitting.
can simulate the interaction of biological nervous systems The maximum number of iterations in the test was
with real-world objects. In this paper, the neural network 2000, the learning rate was 0.01 and the error of the train-
method is used to establish the identification and early ing target was 0.01. In order to avoid over-fitting, some in-
warning model. terventions were performed during the training process,
i.e. randomly “killing” some neurons.Analysis, Assessment and Early Warning of Mudflow Disasters along the Shigatse Section | 57
It is important to note that the identification rate on
the training set is close to 100% and over-fitting is likely
to occur. When observing the original datasets, it can be
found that there are more datasets for cases susceptible
to disasters, which is up to 108 sets, and the data of cases
highly susceptible to disaster are too few, with only eight
sets. This may be the reason for the occurrence of over-
fitting. Therefore, when collecting data, if the ratio of the
three datasets can be controlled at approximately 1:1:1, the
identification rate on the test set will be further improved.
6 Summary and discussion
(a)
This paper studies the mudflow disasters in the Shigatse
section of China–Nepal Highway, including the relation-
ship between hazard factors and disaster points, the eval-
uation of disaster susceptibility and its early warning. The
conclusions are as follows.
By analysing the relationship between various hazard
factors and disaster points, it is found that the factors such
as slope, precipitation, soil type and digital elevation are
the most strongly correlated with the occurrence of disas-
ters. From the distribution of disaster points, the disaster
points are closely related to the slope and the local corre-
lation with precipitation is well. The local correlation with
soil type and DEM data is obvious. Areas where low propor-
tion of clay and a high proportion of sand are susceptible
(b) to mudflow.
In order to quantitatively evaluate the susceptibility of
Figure 13: Results of neural network algorithm: (a) The error de- mudflow disasters in Shigatse region, six representative
creases with the number of iterations; (b) The accuracy rates of ten
locations were selected for reflecting difference between
independent tests
the eastern and western of the region, as well as the topo-
graphic difference between valleys and hillsides.
5.3 Analysis of test results AHP was used as the main analytical method and was
supplemented by the fuzzy clustering method as the verifi-
After running many tests, we found that using the BP neu- cation method. The results show that the slope is the most
ral network prediction algorithm, the identification rate of important of the four factors, but it is complex and needs to
mudflow disaster susceptibility on the test set stabilised be accompanied with heavier precipitation; however, the
at 66%–74% (as shown in Figures 13(a) and 13(b)). Fig- area with high sand ratio is only susceptible to mudflow
ure 13(a) is a graph showing the error as a function of the when supplemented by heavier precipitation. The digital
number of iterations, and Figure 13(b) is a graph show- elevation has the lowest impact among the four factors.
ing the accuracy rates of ten independent tests. This pre- The neural network method was used to establish the
diction provides a basis for the early mudflow warning identification and early warning model of mudflow suscep-
in the Shigatse region. When inputting several major fac- tibility, and the identification rate was stabilised between
tors extracted from this paper, although there are complex 66% and 72% It is concluded that when the identification
physical relations among these factors, when the identifi- rate reaches 66% or higher, it can be used as an early-
cation rate from the neural network prediction algorithm warning threshold for mudflow disasters.
is greater than 66%, an early warning of mudflow disasters Although the influencing factors of mudflow disasters
in the region can be raised. along the Shigatse section of China–Nepal Highway are di-58 | L. Xiao et al.
verse and the mechanism of the impact is complex, this [9] Othman AA, Gloaguen R, Andreani L, Rahnama M. Improving
study explores the research, evaluation and early warning landslide susceptibility mapping using morphometric features
in the Mawat area, Kurdistan Region, NE Iraq: comparison of
model of mudflow disasters in the region, which is con-
different statistical models. Geomorphology. 2018;319:147–60.
ducive to the rectification and upgrading of China–Nepal
https://doi.org/10.1016/j.geomorph.2018.07.018.
Highway. Additionally, it has important theoretical mean- [10] Polykretis C, Chalkias C. Comparison and evaluation of landslide
ing and practical value, and provides a typical demonstra- susceptibility maps obtained from weight of evidence, logistic
tion for the prevention and early warning of plateau moun- regression, and artificial neural network models. Nat Hazards.
tain disasters. 2018;93(1):249–74. https://doi.org/10.1007/s11069-018-3299-
7.
[11] Mahdadi F, Boumezbeur A, Hadji R, Kanungo DP, Zahri F. GIS-
Acknowledgement: The study is supported by the Na- based landslide susceptibility assessment using statistical mod-
tional Science Foundation of China (Grant 41661144039). els: a case study from Souk Ahras province, N-E Algeria. Arab
J Geosci. 2018;11(17):476. https://doi.org/10.1007/s12517-018-
3770-5.
[12] Shirani K, Pasandi M, Arabameri A. Landslide susceptibility as-
References sessment by Dempster–Shafer and Index of Entropy models,
Sarkhoun basin, Southwestern Iran. Nat Hazards 2018, 93, 1379–
[1] Nguyen AK, Liou YA, Li MH, Tran TA. Zoning eco-environmental 1418.
vulnerability for environmental management and protection. [13] Ba QQ, Chen YM, Deng SS, Yang JX, Li HF. A comparison of
Ecol Indic. 2016;69:100–17. https://doi.org/10.1016/j.ecolind. slope units and grid cells as mapping units for landslide sus-
2016.03.026. ceptibility assessment. Earth Sci Inform. 2018;11(3):373–88.
[2] Xu WB, Yu WJ, Jing SC, Zhang GP, Huang JX. Debris flow sus- https://doi.org/10.1007/s12145-018-0335-9.
ceptibility assessment by GIS and information value model; in [14] Tekin S, Can T. Effects of landslide sampling strategies
a large-scale region, Sichuan Province (China). Nat Hazards. on the prediction skill of landslide susceptibility model-
2013;65(3):1379–92. https://doi.org/10.1007/s11069-012-0414- ings. Photonirvachak (Dehra Dun). 2018;46(8):1273–83.
z. https://doi.org/10.1007/s12524-018-0800-4.
[3] Zhang W, Chen JP, Wang Q, An YK, Qian X, Xiang LJ, et [15] Li B, Feng Z, Wang WP. Characteristics of the Sanmen Forma-
al. Susceptibility analysis of large-scale debris flows based tion clays and their relationship with loess landslides in the
on combination; weighting and extension methods. Nat Haz- Guanzhong area, Shaanxi, China. Arab J Geosci. 2015;8(10):7831–
ards. 2013;66(2):1073–100. https://doi.org/10.1007/s11069- 43. https://doi.org/10.1007/s12517-015-1822-7.
012-0539-0. [16] 360 Encyclopedia: Overview of the Shigatse Region,
[4] Chen XZ, Chen H, You Y, Chen XQ, Liu JF. Weights-of-evidence 2016 https://baike.so.com/doc/4000483-4197048.html
method based on GIS for assessing susceptibility to debris flows [17] Xiao YY, Ci RY. Shigatse 50 years of transport development tour.
in Kangding County, Sichuan Province, China. Environ Earth Sci. Shigatse daily. Shigatse. 2015 Jul;1:2.
2016;75(1):1–16. https://doi.org/10.1007/s12665-015-5033-z. [18] Shen RF. Operations Research. Beijing, China: Mechanical Indus-
[5] Wang Q, Kong YY, Zhang W, Chen JP, Xu P, Li HZ, et al. try Press; 2009. pp. 249–54.
Regional debris flow susceptibility analysis based on prin- [19] Li YM. Research on customer classification method based on
cipal component analysis and self-organizing map: a case fuzzy clustering. Master thesis, Guangdong University of Tech-
study in Southwest China. Arab J Geosci. 2016;9(18):718. nology, China, 2006.
https://doi.org/10.1007/s12517-016-2752-8. [20] Niu K. Several key technologies in clustering analysis and their
[6] Truong XL, Mitamura M, Kono Y, Raghavan V, Yonezawa G, Truong application in the field of telecommunications. PHD thesis, Bei-
X, et al. Enhancing Prediction Performance of Landslide Sus- jing University of Posts and Telecommunications, China, 2007.
ceptibility Model Using Hybrid Machine Learning Approach of [21] Qu FH, Cui GC, Li YF. Fuzzy clustering algorithm and its applica-
Bagging Ensemble and Logistic Model Tree. Appl Sci (Basel). tion. Beijing, China: National Defence Industry Press; 2011. pp.
2018;8(7):1046. https://doi.org/10.3390/app8071046. 46–52.
[7] Chang M, Tang C, Van Asch TW, Cai F. Hazard assess- [22] Zhou ZH. Machine Learning. Beijing, China: Tsinghua University
ment of debris flows in the Wenchuan earthquake-stricken Press; 2016. pp. 97–101.
area, South West China. Landslides. 2017;14(5):1783–92. [23] Zhu SQ. 21st Century College Computer Planning Textbook Man-
https://doi.org/10.1007/s10346-017-0824-9. agement Information System Theory and Practice. 3rd ed. Beijing,
[8] Aditian A, Kubota T, Shinohara Y. Comparison of GIS-based China: People’s Posts and Telecommunications Press; 2008.
landslide susceptibility models using frequency ratio, logis-
tic regression, and artificial neural network in a tertiary re-
gion of Ambon, Indonesia. Geomorphology. 2018;318:101–11.
https://doi.org/10.1016/j.geomorph.2018.06.006.You can also read