Analysis of Max Burgers AB's carbon footprint for 2017
←
→
Page content transcription
If your browser does not render page correctly, please read the page content below
Analysis of Max Burgers AB’s
carbon footprint for 2017
May 2018

Contact information:
Kaj Török, MAX Burgers AB, kaj.torok@max.se
Peter Wrenfelt, U&We, peter.wrenfelt@uandwe.se
Katrin Dahlgren, U&We, katrin.dahlgren@uandwe.se
Johanna Grant, ZeroMission, johanna.grant@zeromission.se
Max – Carbon footprint, 2017                                         May 2018

                     Contents
                     SUMMARY                                                    3

                     INTRODUCTION                                               6
                     Background and purpose                                     6
                     Assessment context                                         6
                     Goals                                                      7
                     Participants                                               8

                     METHOD                                                     9
                     Performance indicator                                  11
                     Scope of the assessment                                11
                     Data collection and quality                            11
                     Allocation of emissions                                14

                     ASSESSMENT BOUNDARIES                                 16
                     Time horizons                                         18
                     Significant sources of emissions                      18
                     Waste                                                 18
                     Staff journeys to and from work                       19
                     Guests' journeys                                      20
                     Land use change                                       20
                     Sensitivity of results                                21
                     Interpretation of results and limitations             22
                     Critical examination                                  23

                     THE CARBON FOOTPRINT – FROM SOIL TO TABLE             24
                     Carbon footprint of beef                               28
                     Greenhouse gases                                       28

                     CARBON FOOTPRINT OF MAX'S BUSINESS OPERATIONS         29

                     CARBON FOOTPRINT IN DIFFERENT COUNTRIES               31

                     MAX BURGERS' CARBON OFFSETTING                        33
                     Background                                             33
                     Actors and concepts                                    34
                     Process description                                    34
                     Confidentiality                                        37

                     AUDITOR'S REPORT (ERNST & YOUNG)                      38

                     REFERENCES                                            40

                                                                 2
Max – Carbon footprint, 2017 May 2018
Summary
During the spring of 2018, Max Burgers AB – in collaboration with
U&We, Sweden's most innovative sustainability consultancy –
undertook a greenhouse gas emissions assessment of its business
operations. The company’s aim is to inspire hope with regard to climate
change. The specific goal of this assessment was to comply from June
2018 with the requirements for carbon neutral products in the ISO
14021:2017 standard relating to self-declared environmental claims.
Furthermore Max Burgers intends to compensate for greenhouse gas
emissions by 10% over and above the level needed for carbon neutrality
so that the burgers have a positive climate impact.
The assessment is based on input data from Max and its suppliers,
together with emission factors from recognised databases and publicly
available studies relating to the carbon footprints of food.
Max reports the entire carbon footprint of its meals on its website and
on some of its menus. This helps guests choose the food which has the
smallest carbon footprint.
Max was an early mover in switching to wind power for its electricity.
In addition, it has successfully introduced new vegetarian products in
the last two years. During the last ten years, Max has offset the carbon
footprint of its own operations and those of its suppliers and farmers.
This carbon offsetting is done through tree-planting with smallholders,
which also reduces pressure on natural forests.
Max’s total carbon footprint in 2017 was about 135,000 tons of carbon
dioxide equivalents (CO2e) per year. The assessment showed that of the
total carbon footprint, from the farmers’ soil to the guests’ table,
including guests’ travel and waste etc, it is beef that has the greatest
impact on the environment. Almost 53% of the carbon footprint comes
from beef, while transport and travel only account for about 10%.
Compared with 2007 Max’s total carbon footprint has increased.
However, per Swedish krona of sales the emissions have declined by
about 15%1.
1
Based on carbon footprint adjusted for different conditions during the period. The
calculations for previous years have been re-worked to reflect conditions during 2017.
3Max – Carbon footprint, 2017 May 2018
The proportion of fossil-derived carbon dioxide in the production of
beef is less than a quarter of Max’s total carbon footprint (expressed as
CO2e). This means that just ending fossil fuel consumption would not
reduce Max’s carbon footprint significantly: it is also essential to reduce
the emissions of methane and nitrous oxide.
4Max – Carbon footprint, 2017 May 2018
Responsible at Max Kaj Török, Information and Sustainability Manager
Burgers
Companies included Max Burgers AB together with its subsidiaries and all
its franchisees
Company boundaries The entire business operations of Max Burgers AB –
125 restaurants in six countries (Sweden, Norway,
Denmark, Poland, Egypt and the United Arab
Emirates) of which about 90% are directly owned by
Max and the remainder are owned by franchisees.
However Max products sold in supermarkets are not
included.
Assessment boundaries The company’s entire operations, including
upstream and downstream emissions arising from
raw materials purchased and goods sold.
Description of operations Max Burgers AB is a burger chain in Sweden with 125
included in the assessment restaurants and over 40 million guests each year.
Scope of the assessment All emissions (scopes 1, 2 and 3) based on the
principle of operational control defined in the GHG
Protocol Corporate standard.
Method selected for the Third party validation by auditors Ernst & Young
assessment of compliance
Period of operation 1 January 2017 – 31 December 2017
Standards for greenhouse ISO 14067 Carbon footprint of products
gas assessment GHG Protocol Corporate Accounting and Reporting
Standard, Corporate Value Chain (Scope 3) Standard
and Scope 2 Guidance
Validation The assessment is done in accordance with ISO 14067
which is based on the GHG Protocol. Auditors Ernst
& Young have carried out an overview audit of
compliance with the GHG Corporate Standard.
Carbon footprint of Max See page 22 below.
Burgers AB
5Max – Carbon footprint, 2017 May 2018
Introduction
Background and purpose
With the assistance of U&We, Max Burgers AB has undertaken an assessment of
the greenhouse gas emissions from its business operations (including emissions by
suppliers). It is envisaged that this report will be used as supporting
documentation for a Climate Report. In addition, Max wants greater insight into
its carbon footprint so that it can reduce it, given that the overall objective is to
inspire hope with regard to climate change.
Assessment context
Responsible at Max Burgers Kaj Török, Information and Sustainability Manager
Companies included Max Burgers AB together with its subsidiaries and
all its franchisees
Company boundaries The entire business operations of Max Burgers AB –
125 restaurants in six countries (Sweden, Norway,
Denmark, Poland, Egypt and the United Arab
Emirates), of which about 90% are directly owned
by Max and the remainder are owned by
franchisees. However, Max products sold externally
in retail businesses are not included.
Assessment boundaries The company’s entire operations, including
upstream and downstream emissions arising from
raw materials purchased and goods sold.
Description of operations Max Burgers AB is a burger chain in Sweden with
included in the assessment 125 restaurants and over 40 million guests each
year.
Scope of the assessment All emissions (scopes 1, 2 and 3) based on the
principle of operational control defined in the GHG
Protocol Corporate standard.
Method selected for the Third party validation by auditors Ernst & Young
assessment of compliance
Period of operation 1 January 2017 – 31 December 2017
Standards for greenhouse ISO 14067 Carbon footprint of products
6Max – Carbon footprint, 2017 May 2018
gas assessment
GHG Protocol Corporate Accounting and
Reporting Standard, Corporate Value Chain (Scope
3) Standard and Scope 2 Guidance
Confirmation The assessment is done in accordance with ISO
14067 which is based on the GHG Protocol.
Auditors Ernst & Young have carried out an
overview audit of compliance with the GHG
Corporate Standard.
Carbon footprint of Max See page 22 below.
Burgers AB
Food production is responsible for a considerable proportion of
Sweden’s overall impact on the environment. In total, the food
production chain accounts for about 50% of eutrophication, 28% of
greenhouse gas emissions and 20% of energy use in Sweden (Sonesson
et al). Of these figures, a significant proportion arises from primary
food production.
In food production, it is carbon dioxide, (CO2), methane (CH4) and
nitrous oxide (N2O) which represent the largest potential contribution
to the greenhouse effect. The animal component, in particular the
ruminants, represent a significant proportion of the carbon footprint.
Methane is released from cows’ digestion and from their manure.
Losses of nitrogen in the form of nitrous oxide are proportional to the
total nitrogen flow in the production.
Goals
The goal for Max Burgers in 2018 is to comply with the requirements
for carbon neutral products in the ISO 14021:2017 standard relating to
self-declared environmental claims. This will be validated against the
GHG Protocol which ISO 14021:2017 is based on. The goal from June
2018 is to offset for greenhouse gas emissions by an additional 10%,
over and above the company’s emissions, so that the burgers have a
positive impact on the climate.
The goal of this assessment was to calculate Max’s greenhouse gas
emissions from the following activities:
7Max – Carbon footprint, 2017 May 2018
- Scope 1
- Refrigerants
- Leased cars
- Use of natural gas
- Scope 2
- Electricity consumption
- Heating and cooling
- Scope 3
- Waste
- Franchised restaurants
- Consumable supplies
- Packaging
- Guests’ journeys to and from the restaurants
- Handling of customer waste
- Incoming transport of ingredients and materials
- Food production
- Staff travelling to and from their place of work
- Business-related travel
- Upstream emissions from the production of electricity and heating
- Outgoing transport of food and waste
The result is a quantitative measurement of Max’s carbon footprint
which will be followed up each year and which provides input for
Max’s external communication in the form of a brief and readable
Climate Report. The results show where the company’s impact on the
climate is greatest, thereby providing guidance as to where efforts to
reduce emissions should be focused. The results also allow restaurant
guests to help reduce the company’s carbon footprint by choosing the
right menus.
This report presents the methodology used and the carbon footprint of
Max’s operations, including supplier emissions.
Participants
The main participants from Max were Marie Köster and Kaj Török,
together with other Max employees who submitted data on different
activities. Peter Wrenfelt, Katrin Dahlgren and Håkan Emilsson
participated from U&We. Many of Max’s suppliers have answered
8Max – Carbon footprint, 2017 May 2018
questions relating to their activities which have an impact on the
climate, including raw materials and transport. The authors would
particularly like to thank all those who helped to gather the information
needed to complete the assessment.
Method
ISO 14021:2017 (Environmental labels and declarations — Self-declared
environmental claims) focuses on products. ISO 14021 refers to ISO 14067
for quantifying carbon footprints. In turn, ISO 14067 refers to Product
Category Rules (PCR) for specific sectors for detailed guidance in terms
of boundaries and other methodological issues.
No PCR has been written for restaurant operations. A PCR Basic
Module exists for Accommodation, food and beverage services but this
cannot be used in its entirety for carbon footprinting. However, in this
instance it has been used to provide guidance, especially with regard to
determining the boundaries of the life-cycle.
The carbon footprint of the company’s operations is based on the
Greenhouse Gas (GHG) Corporate Accounting and Reporting
Standard. Separate research is done for the products since academic
research into the impact of farming is constantly producing new results.
Methane, nitrogen dioxide and other gases which impact the climate
are re-calculated to CO2 equivalents, so that an overall potential impact
can be described. Emissions factors from DEFRA with GWP values over
a 100-year period from the IPCC Fourth Assessment Report (AR4) have
been used for calculations. Energy-related conversions have been based
on publicly available conversion factors.
Activity data is based on information from invoices, suppliers and
internal statistics. Input data from Max and from its supply chain has
usually been for the period 1 January 2017 to 31 December 2017.
Deviations from this are stated in the results section.
The basis for the analysis of the carbon footprint of food and materials
is a range of different research studies that have been done in different
conditions. The research studies may differ in terms of system
boundaries, the data in focus and the conversion factors being applied
to methane and nitrous oxide and other factors. This may affect
9Max – Carbon footprint, 2017 May 2018
comparability and transferability. For obvious reasons, published
studies have often been restricted to calculation methods which are
agreed by researchers. For this reason, significant factors may be partly
or entirely missing from studies which are only a few years old.
Examples of this include the carbon footprint of potential land-use
change (LUC), e.g. deforestation and carbon sequestration in soil.
The level of knowledge regarding greenhouse gas emissions from fossil
fuels is relatively good, whilst there is uncertainty regarding emissions
from biological systems (eg cultivation and rearing). There are also
uncertainties about the impact of air travel, which is currently though
to be somewhere between 1.6 and 4.2 times higher than its carbon
dioxide emissions since water vapour and nitrogen oxide at high
altitude have an additional impact on the climate. In this respect, a
Radiative Forcing Index (RFI) factor of two times emissions has been
selected.
Farming research is often based on studies of individual farms, where
the outcome is specific to the farms studied, even if the researchers
strive for results which can be applied more generally. There can be
large differences between individual farms, given that production
conditions and methods differ. So uncertainties exist in the studies,
particularly regarding biogenic emissions.
Starting from the research available, we have evaluated the potential
emission factors of each relevant raw material. Based on the specific
conditions which apply to Max (in terms of suppliers, farmland, raw
material composition etc.) we have then selected or calculated an
emission factor for each raw material. In those cases where transport
beyond the farm gate has been included in the relevant Life-Cycle
Assessments (LCAs), these have been deducted from the raw material
emission factors where possible, and included in calculations of Max’s
other transport operations. Otherwise, emissions arising from animal
products have been included up to and including the packaging facility
after the slaughterhouse.
The result of the emissions assessment is therefore dependent on the
current state of knowledge so corrections will be needed as knowledge
is extended and refined. Although the current state of knowledge is
uncertain in some areas, it is better to use what is currently available
and then update it regularly, rather than to wait for “reliable” data.
10Max – Carbon footprint, 2017 May 2018
Performance indicator
The overall result of the carbon footprint is set in relation to sales. The
intention of this is to make it possible to follow changes in the carbon
footprint in relation to a key figure which reflects the development of
the company’s market share over time. This key performance indicator
is expressed as g CO2e/SEK.
Scope of the assessment
The emissions assessment covers all of Max Burgers AB’s operations
where the organisation has operational control, as defined in the GHG
Protocol. The countries/markets included are Sweden, Denmark,
Norway, Poland, Egypt and the United Arab Emirates. The assessment
covers all Max’s restaurant businesses, both own operation and
franchises. However, Max brand products sold in supermarkets are not
included.
Data collection and quality
Almost all supplier activity data is based on actual data reported from
the suppliers themselves, in respect of their own operations and
transport, and transport by their sub-contractors. Estimates have been
done where reported input data was obviously incorrect. The emissions
from primary production have been calculated based on scientific
studies and available emission factors on the raw materials being used.
The quality of the data used in the analysis (input data) determines the
quality of the final calculation. Most suppliers have reported emissions-
related activity data to Max for the last ten years. During that time, the
quality has improved. The input data delivered by Max to U&We, upon
assessment is built, is as follows:
• Electricity use for all restaurants in Sweden except those at
Arlanda, Landvetter and Liseberg, reported by supplier and type
of electricity. If figures were not supplied, estimates based on
sales were used. For the office in Stockholm no data was
available for 2017 so an estimate was done based on figures for
2014. No input date was available for Denmark, Poland, Egypt
and the United Arab Emirates and estimates based on sales were
used.
11Max – Carbon footprint, 2017 May 2018
• Heating for all except 28 restaurants in Sweden, reported by
supplier and energy source. A few of the restaurants have also
used district cooling. Of those restaurants where information
was not available, many of them were “Instore” which generally
means that heating is included in the rent. In such cases,
estimates have been made based on the floor area of the Instore
restaurants and information from reporting restaurants. For
offices for which no information was available, estimates were
made based on size. No data was available for Norway or
Denmark. For Norway, it has been assumed that heating is
electrical. Figures for Denmark have been estimated, based on
sales and average heating use in Sweden. Input data for business
operations in Poland, Egypt and the United Arab Emirates has
been assumed to be electrically based air conditioning.
• Waste and recycling. Information has been reported on the
volume and treatment of waste by contractors in relation to 93%
of the Swedish restaurants’. For the remaining restaurants
estimates have been calculated on the basis of the average per
restaurant. No data was available from Norway, Denmark,
Poland, Egypt and the United Arab Emirates and data for these
countries has been estimated based on an average for restaurants
in Sweden. The emissions from transport and energy recovery
have been calculated. Handling of waste that is removed by the
guests themselves (take-away) has been estimated based on
interviews with guests at a sample of restaurants. This data has
been scaled up, based on Max’s own statistics relating to take-
away, home deliveries and drive-through. The guests have
stated whether or not they have recycled the waste.
• Company cars, taxis, hire cars and hotel nights have been
reported for Head Office, Sweden and Norway. The data for
Denmark, Poland, Egypt and the United Arab Emirates has been
estimated based on sales.
• Business-related travel, by different modes of travel, has been
reported for Head Office, Sweden, Norway and Egypt. Any
business-related travel for Denmark, Poland, Egypt and the
United Arab Emirates is included in the data reported for
Sweden.
• Transport of raw materials to the producers and transport from
suppliers to Max has been reported. The intermediate phase –
transport from producer to supplier – has been estimated based
on a standard distance.
12Max – Carbon footprint, 2017 May 2018
• Packaging and consumable supplies have been reported by
suppliers. Information about materials – volumes in kilos,
producer, energy use and transport of materials has been
collected using online and/or Excel-based questionnaires to
suppliers.
• Food inputs have been estimated based on a grouping of
ingredients into about 40 groups of ingredients/raw materials.
Information about the number of kilos of raw materials used has
been reported by suppliers. Information about primary
production, packaging, production sites, methods of transport
and routes, together with use of energy and other resources has
also been reported. The information has been collected using
online and/or Excel-based questionnaires to producers and
suppliers.
• The Head Office has reported business data for calculating key
performance indicators – i.e. sales, number of restaurants and
number of employees.
This year, the supporting documentation for the calculations has been
improved in relation to previous years in order to comply with the ISO
14021 standard relating to the communication of carbon neutrality. A
breakdown of input data between Sweden, Norway and Denmark has
been provided and the same applies to a certain extent for Poland, but it
has not been possible to use these breakdowns in this assessment. The
calculations regarding transport of packaging have needed to be
supplemented with standard values in many cases.
Where Max has expanded to other countries in recent years,
clarification has been necessary to determine whether all transport of
raw materials has been included in the supplier survey data, and how
the carbon footprint of these new countries is best calculated. A few
initial steps to distinguish the flows of raw materials in these countries
were taken in conjunction with the 2014 carbon footprint. For 2015, 2016
and 2017, suppliers and producers have largely been able to deliver
separate data for Sweden/Denmark, Norway and Poland. The carbon
footprint of the ingredients used in Norway has been calculated
separately, whilst that of Denmark has been included with Sweden. For
other countries - Poland, Egypt and the United Arab Emirates - the
footprint for 2017 has been based on sales for some activities and on
typical values per restaurant in Sweden for other activities (given that
some activities are clearly related to sales, whilst others are not).
13Max – Carbon footprint, 2017 May 2018
For Poland it’s been possible to assess supplies and transport where
products have been sent from Sweden, which is true for a large
proportion of the supply. In Norway there were four restaurants in
2017 and three in Denmark. In Poland and Egypt there was one
restaurant in the latter half of the year. In the United Arab Emirates
there are two restaurants.
All data provided by producers in online questionnaires has been
examined and checked for reasonableness against information from
previous years and against key figures e.g. energy per kg of product
and reported transport distances in relation to geographical distances.
In most cases, volumes of products delivered have been reported by
both producers and suppliers. These have been compared with each
other to identify potential errors. When necessary, questions have been
addressed to people at the companies that provided input data. A
separate record of this data and assessments of data quality has been
made.
Global warming potentials (GWP) for the conversion of methane,
nitrous oxide and other greenhouse gas emissions into carbon dioxide
equivalents were from IPCC AR4 (2007) in most of the sources. In some
cases, sources have only been used only as reference points for
assessing the reasonableness of other sources. In those cases where a
source has been used for calculations, any deviations from IPCC AR4
have been re-calculated to ensure consistent application of GWPs.
As explained above, greenhouse gas assessments include inherent
uncertainties because the scientific knowledge used to establish
emissions factors is incomplete, as is the knowledge about the
conversion factors for combining emissions of different gases.
Allocation of emissions
For Max, the most significant sources of emissions are the ingredients
and raw materials used in the restaurant meals. The greenhouse gas
calculations for these materials are based on emission factors in
published life-cycle studies, together with the specific allocations made
in each study – a financial allocation, a mass/volume allocation or a
system expansion. The producers of the ingredients and raw materials
purchased by Max have themselves either reported energy use
14Max – Carbon footprint, 2017 May 2018
specifically for each article or they have allocated their total energy
between the volume (or weight) of all articles.
Assessment Boundaries
The organisational boundaries for the assessment were based in
principle on operational control according to the GHG Protocol.
Criteria for life-cycle boundaries were based on ISO 14067 - Carbon
Footprint of Products - together with the boundaries suggested by the
PCR Basic Module for Accommodation, food and beverage services. The
GHG Protocol Corporate Standard has also been used as a reference.
Figure 1. System boundaries for calculating Max’s carbon footprint.
The main system boundaries used in the assessment are shown in the
figure above. The food and its journey from soil to table has been
assessed and emissions calculated. This includes everything from the
agricultural inputs used to produce the food via the cultivation of
fodder and vegetables, rearing and processing, preparation and serving
to handling of waste.
15Max – Carbon footprint, 2017 May 2018
Scope Definition Included emission sources/activities
Scope 1 Direct GHG Use of natural gas for heating and/or preparing food in restaurants.
emissions from
vehicles/premises Refrigerants
Leased cars
Scope 2 Indirect emissions Production of electricity, cooling and heating purchased for
from purchased restaurants and offices.
heating and
electricity from
premises
Scope 3 - 1. Purchased goods Purchased goods and services, such as agricultural products,
Upstream and services processed food for cooking for consumption by guests, purchased
packaging materials, other goods and consumables for restaurants
and offices, together with packaging materials for purchased goods.
2. Capital goods Not included
3. Other fuel- and Scope 3 emissions from the production and distribution of electricity
energy-related and heating.
activities
4. Upstream Transport of purchased goods/material, transport of waste etc.
transportation and
distribution
5. Waste generated Collection and handling of waste, sludge and frying oil from
in operations restaurants and offices.
6. Business travel Travel by air, rail, taxis, private cars and rental vehicles, together
with hotel nights.
7. Employee Employee journeys to and from work by bus, train and car etc.
commuting
8. Upstream leased Leased restaurants and offices.
assets
Scope 3 - 9. Downstream Guest journeys to and from restaurants, home deliveries.
Downstream transportation and
distribution
10. Processing of n/a
sold products
11. Use of sold n/a
products
12. End-of-life Waste from take-aways and home deliveries.
treatment of sold
products
13. Downstream n/a
leased assets
14. Franchises Franchise restaurants
16Max – Carbon footprint, 2017 May 2018
Scope Definition Included emission sources/activities
15. Investments n/a
The following activities have not been included in the calculation:
• Purchase of electronic goods for offices (computers, telephones
etc.)
• Marketing (printing and use of cloud-based services)
• Construction and capital goods (buildings and interiors)
• Retail products
• Consumption of fresh water
The table below provides the reasons for these exclusions.
Sources of emissions/activities excluded Explanation
Construction and refurbishment Data not available. Neither is construction and
buildings a mandatory category in the current
PCR basic module for Accommodation, food and
beverage services. A rough estimate of the
construction of the new restaurants showed
the carbon footprint to be less than 1% of the
total footprint (0.7%).
Printed material, TV advertisements and Data not available. This category of activity is
digital/cloud services for marketing not dealt with in the PCR Basic module for
Accommodation, food and beverage services.
Retail products Max has very limited control over the
production and no agreement has yet been
reached with producers about working
towards carbon neutrality.
Consumption of fresh water A rough estimate indicated that the
production of fresh water represents less than
1% of the total carbon footprint (about 0.03%).
Purchase of electronic goods for offices It is estimated that these purchases represent
(computers, telephones etc). less than 1% of the total footprint (about
0.02%).
17Max – Carbon footprint, 2017 May 2018
Time horizons
From a product perspective, most greenhouse gas emissions from
ingredients, raw materials and waste occur during a limited time
period. Most food is fresh or frozen and none of Max’s products has a
multi-year life ie a user phase. However, raising cattle takes place over
a long period and the meat consumed by Max’s restaurant guests
comes from animals which, in some cases, have been slaughtered when
they were over 3 years old (although generally the animals are younger
than this).
Significant sources of emissions
From the carbon footprint calculations it was found that the following
processes dominate the outcome for each scope of emissions. The share
of the total carbon footprint is shown in brackets.
Scope 1:
• Leakage of refrigerants (0.4%)
Scope 2:
• Production of district heating (0.7%)
Scope 3:
• Food production, primary production phase, where beef is
dominant (53%) followed by other animal products (just over
11%).
• Production of packaging and consumables (10%).
• Guests’ journeys to and from restaurants (just over 4%)
These five activities together account for almost 80% of Max’s entire
carbon footprint.
Waste
Used frying oil is collected from Max’s restaurants and used as a raw
material for the production of biogas and the treatment of the oil is
considered part of the life-cycle of biogas. The same applies for sludge
collected from grease separators in the restaurants. However, the
transport of the frying oil and sludge from the restaurants has been
included in the assessment.
18Max – Carbon footprint, 2017 May 2018
For general waste, transport is included for all fractions, together with
the energy recovered from the waste. Fractions which are re-used
belong to life-cycles outside Max’s operations so only transport is
included for these components. This information was reported for 93
restaurants. Data for other restaurants was estimated based on average
waste per restaurant. An average transport distance of 20 km was
assumed for this waste, with one collection per day and 220 collections
per year.
Waste left by guests has been assessed through interviews at ten
restaurants, chosen to be representative in terms of size and sales. The
interviews took place between 11am and 8pm during eight days in
February (16-24 February). The interview questions related to mode of
transport to and from the restaurants, length of journey and handling of
waste. 185 people were interviewed, many of whom were part of larger
groups. In total there were 444 people in the groups, of whom 425 ate
food or consumed drinks. From the total volume of packaging
supplied, and statistics for take-away, home deliveries and drive-
through, the proportion of packaging removed from restaurants has
been estimated. Information provided by guests about recycling forms
the basis of the calculations of energy recovery. For those guests who
have indicated that they “usually” recycle Max packaging, it was
assumed that 50% of the energy is recovered. For those guests who
have indicated that they “sometimes” recycle Max packaging, it was
assumed that 2/3 of the energy is recovered. For those guests who have
indicated that they “rarely” recycle Max packaging, it was assumed that
95% of the energy is recovered.
Staff journeys to and from work
Staff journeys to and from work have been investigated using an online
questionnaire at a selection of ten restaurants in Sweden. The selection
of restaurants was the same as that used for the interviews about guest
journeys and waste. Questions were asked about service received,
mode of transport, type of fuel used in any cars or other vehicles and
length of the journeys. The questionnaire was answered by a total of
138 people and the results were then scaled up, based on the number of
full-time employees in the organisation. It was assumed that five
working shifts per week comprise full-time work. Journeys to and from
work by car have been assumed to reflect the average Swedish vehicle
fleet.
19Max – Carbon footprint, 2017 May 2018
Guests’ journeys
Guests’ journeys to and from the restaurants have been investigated
through interviews at ten selected restaurants in Sweden (see also the
information about guests’ waste above). The interviews included
questions about modes of transport, sizes of groups of people, ages,
types of fuel used in cars and other private vehicles, distances and
purposes of the journeys (whether they were just to visit MAX or also
for other reasons). Journeys have then been allocated to Max according
to the following principles.
Main purpose was a visit to Max
- For journeys that were shorter than 15-50 km, it was assumed
that Max was not the main destination but a sub-destination. It
was then assumed that 25% of the distance was related to Max.
- Where a longer journey was involved – between 50 and 500 km –
only the exit distance was assumed to relate to Max.
The main purpose was other business
- For longer distances of 20 km or more only the exit distance
from Max was taken into consideration.
- For the remaining short journeys of between 0 and 19 km, 15% of
the journey was assumed to relate to Max.
A single journey away from a Max restaurant is assumed to be 0.5 km.
Return journeys were calculated. 9% of car journeys were found to have
been made in cars which used renewable fuel or electricity. These have
been calculated separately.
To scale up the results to reflect the total number of guest journeys,
calculations were based on the number of sales receipts where home
delivery was stated. According to calculations done by Max, there are
almost exactly 1.5 guests per receipt (Mattias Eriksson 2018-05-06). No
data exists for Denmark, Poland, Egypt and the United Arab Emirates
and estimates for these have been based on sales.
Land use change
The potential emissions from land use change (LUC) was estimated and
is included for beef, dairy products and paper articles. The calculations
20Max – Carbon footprint, 2017 May 2018
were based on Max’s beef being representative of all the beef produced
in Sweden, with a corresponding share of LUC emissions resulting
from fodder production, which, in this year’s calculations, increased the
estimated emissions from beef by 6%. For dairy products, a potential
LUC supplement of 8.8% has been estimated.
For paper articles and packaging, it has been assumed that for almost
half (47%) of the volume, there is a risk of contributing to LUC, mostly
because of uncertainty about the origin of raw materials. For this
volume, estimates have been made of the volume of pulpwood, area of
forest and potential LUC emissions for the corresponding area.
With regard to potential LUC emissions from the construction of new
restaurants, we have spoken to those responsible for buildings at MAX
and noted that during 2017 no restaurants have been established on
land that was previously unexploited (i.e. directly on soil or turf).
Sensitivity of results
In general the quality of the data has been very good, most of it coming
from invoices, suppliers and Max internal statistics. For the relatively
few areas in which actual data was lacking, estimates were made which
probably reflect or overestimate the actual carbon footprint. Where
there were uncertainties, a higher figure or estimate was chosen rather
than a lower one.
Overall the outcome of the assessment is likely to capture more than
95% of the actual carbon footprint. The activities that could not be
estimated because of the absence of data, are listed under the heading
Assessment Boundaries. They are estimated to amount to 0.75% of the
total carbon footprint. The largest proportion of this impact is from
capital goods (buildings and interiors) which, according to the PCR
basic module, do not have to be included.
Marketing and retail activities are not included in the 0.75%. Retail
activities were determined to fall outside the system boundaries and
marketing is very unlikely to give rise to 1% of the total emissions. This
means that more than 100% of the total emissions have been captured
by the assessment.
21Max – Carbon footprint, 2017 May 2018
A significant proportion of the total calculated footprint is the carbon
footprint of the primary production of beef for Max’s restaurants. If, for
example, the emissions factors from the LCAs on which the calculations
were based were 20% lower or higher, this would give a final result that
was +/- 10%.
The criteria for life cycle analysis of climate impact do not actually take
into account all climate impacts since researchers disagree on how to
handle certain biogenic processes such as carbon sequestration in soils
and release of greenhouse gases. The impacts of these processes are
hard to judge but based on current research, we consider the
calculations of the impacts of beef production to be reasonably accurate.
Guests’ journeys are a relatively small proportion of the total carbon
footprint. It is difficult to assess the proportion of these journeys which
should be allocated to Max since guests often have several objectives
with their journeys. Max’s business concept is to make consumption of
meals convenient for their guests so the restaurants are generally only
stops on journeys made for other purposes, rather than being the
primary destinations. Where a visit to Max is the main purpose of the
journey, 2/3 of the kilometres are allocated to Max. In other cases, 1/3 of
the kilometres are allocated. If the percentage of kilometres represented
by guests whose main purpose was to visit Max was 20% higher, and
that of those with another purpose were 20% lower, the total carbon
footprint would increase by just 0.2%. If the exist journeys were twice
as long for those with longer journeys (i.e. 2 km), the total result would
increase by 0.6%. The proportion of journeys for which Max restaurants
are the main destination is probably lower rather than higher than
assumed.
Interpretation of results and limitations
The results cover Max’s operations all the way from agricultural inputs,
cultivation and breeding, to the consumption of burgers in
restaurants/take-away, including waste and associated journeys. A life-
cycle calculation for a restaurant chain is significantly more complex
than for single products. The results are specific to Max and its
suppliers and guests and cannot be directly applied to other restaurant
operations.
22Max – Carbon footprint, 2017 May 2018
Critical examination
Max Burgers has hired auditors from Ernst & Young to conduct an
independent summary review of this assessment. For more information
see the auditors’ report on page XX.
23Max – Carbon footprint, 2017 May 2018
The carbon footprint – from soil to
table
140 000
Avfall, köldmedia
120 000
Resor
100 000
Transporter,
Tonnes CO2e
80 000 leverantörer
Värme, gas
60 000
El
40 000
Förpackningar,
20 000 förbrukningsmtrl
Mat, jord till bord
0
2007 2008 2009 2010 2011 2012 2013 2014 2015 2016 2017
Figure 2 Max’s carbon footprint from a life-cycle perspective from soil to table, i.e.
from the production of fodder and rearing of animals to cooking in
restaurants and on to guests’ travel and waste.
The total carbon footprint (tonnes CO2e) from soil to table increased
between 2007 and 2017, mainly due to a significant increase in the
number of restaurants. The number of restaurants almost doubled,
from 56 to 125. In 2017, the total carbon footprint amounted to about
135,000 tonnes CO2e for all countries (Sweden, Norway Denmark,
Poland, Egypt and United Arab Emirates).
An online questionnaire was used, with a database, to collect data for
the carbon footprint for 2017. Despite initial problems, this made data
collection easier than in previous years and a relatively complete and
substantial set of data was obtained from producers and suppliers
which improved the quality and reliability of the calculations.
24Max – Carbon footprint, 2017 May 2018
Analysis of the carbon footprint for 2017, from the farmer’s soil to the
guest’s table, shows that beef makes the greatest contribution with.
almost 53% of the carbon footprint coming from beef. This is less than
in previous years due to successful introduction of a wide range of
vegetarian alternatives. Transport and business travel accounts for only
9% of the total footprint.
55,0
Grammes of CO2e per Swedish krona of sales,
50,0
45,0
recalculated to 2017
40,0
35,0
30,0
25,0
20,0
2007 2008 2009 2010 2011 2012 2013 2014 2015 2016 2017
Figure 3 Max’s carbon footprint, from soil to table and back to the earth, expressed
as number of g CO2e per krona of sales, 2007 - 2017.2
2
To facilitate comparison, historical data for the years 2007 – 2016 has been re-calculated to
reflect conditions prevailing in 2017.
25Max – Carbon footprint, 2017 May 2018
Tjänsteresor, bil
Transporter, leverantörer t. Köldmedium Avfall, gäst
restaurang 0,2% Hemleveranser 0,4% 0,1%
0,2% 0,05% Avfall
Arbetsresor
Transporter, Tjänsteresor, flyg tåg 2%
2%
producenter 1%
Gästresor
3% 4%
Värme, gas
1% El
1%
Förpackningar,
förbrukningsmtrl
10%
Nötkött
53%
Grönsaker, läsk, övr
vegetabiliskt
10%
Pommes frites,
potatisprodukter
1%
Bröd, mjöl etc
Övrigt animaliskt
0,4%
11%
Figure 4 Max’s carbon footprint divided into different ingredients and business
activities for the year 2017
26Max – Carbon footprint, 2017 May 2018
Scope 1
0,5%
Scope 2
0,7%
Scope 3
98,8%
Figure 5 Max’s carbon footprint divided by scopes of emissions for 2017.
Scope of emissions Total
tonneCO e 2
2017
1 Direct GHG emissions from vehicles/premises
686
under the control of Max Burgers
2 GHG emissions arising from the consumption
of electricity and district heating on premises 831
under the control of Max Burgers
3 Other indirect GHG emissions 133,307
Total 134,824
The increase in emissions between 2016 and 2017, in absolute terms, is
partly due to increased sales, and partly to the improved reporting of
data from suppliers. However, per Swedish krona of sales, the carbon
footprint declined by 9% between 2015 and 2016 and declined by a
further 4% between 2016 and 2017. The reduced emissions were mainly
27Max – Carbon footprint, 2017 May 2018
due to successful efforts to introduce vegetarian alternatives on the
menu.
The carbon footprint of beef
No ingredient has a larger carbon footprint than beef. Production of
beef up to the farm gate accounts for as much as 95% of beef’s carbon
footprint (the remainder comes from transport, slaughter, transport,
packaging etc). Some of the most significant reasons for the large
carbon footprint of beef are the following:
• Slow growth of cattle (non-effective fodder converters).
• Anaerobic digestion of the food (methane from belching).
• Manufacture of nitrogen-bearing fertilisers and agricultural
production of crops for fodder.
Greenhouse gases
The greenhouse gases included in the assessment are carbon dioxide
(CO2), methane (CH4), nitrous oxide (N2O) and hydrofluorocarbons
(HFC). Methane (CH4) is by far the dominant greenhouse gas emitted
in the life-cycle of beef, accounting for about half of the total climate
impact contribution in conventional farming. The next largest
contribution to the carbon footprint is from nitrous oxide (N2O),
resulting mainly from high doses of nitrogen in the cultivation of
pasture. Emissions of CO2 come third place, arising in Sweden mainly
from fossil fuels used in the production of meat. The impact on global
warming of the different greenhouse gases varies. Carbon dioxide
(CO2), the most common greenhouse gas, is usually ascribed a global
warming factor of 1. For the other gases index values are applied in the
calculations (CH4 = 25; N2O = 298). For example, this means that
methane gas (CH4) is 25 times more potent than CO2 as a greenhouse
gas.
Carbon dioxide from non-fossil sources does not occur in the
calculations for Max of emission in Scopes 1 and 2, other than in
negligible quantities. Scope 3 emissions include some non-fossil carbon
dioxide as a subset of different emission factors for ingredients and raw
materials, as well as in the data reported to Max by producers in the
online surveys that feed into the database of producers’ operations and
transport. It is not currently feasible to separate out this non-fossil
28Max – Carbon footprint, 2017 May 2018
carbon dioxide given the amount of work involved, particularly since
Max does not intend to calculate carbon dioxide emissions with no
scope.
Other biogenic emissions, particularly of methane and nitrous oxide
from agricultural production, are included in all cases in the
calculations and are reported separately in the sources for some, but not
all, of the emission factors. It has therefore been assessed as difficult to
achieve a fair presentation of the split between fossil and biogenic-
related emissions.
Carbon footprint of Max’s business
operations
Generally speaking, responsibility for emissions is considered to be
associated with the ability to influence the activities that give rise to
those emissions. The easier it is to steer and control what happens, the
greater the level of responsibility.
El
24%
Avfall
36%
Värme, gas
14%
Köldmedium
8%
Tjänsteresor, flyg
Hemleveranser
Tjänsteresor, bil Tjänsteresor, tåg 14%
1%
3% 0%
29Max – Carbon footprint, 2017 May 2018
Figure 6 The carbon footprint of Max’s own business operations, such as electricity,
heating, cooling, refrigerants for restaurants and offices, together with
business-related travel for 2017 (tonnes CO2e).
In total, Max’s own operations amounted to almost 6,900 tonnes of
CO2e in 2017, which corresponds to about 5% the company’s total
carbon footprint. Figure 6 shows the split between different activities.
One activity which contributes to the carbon footprint is the heating of
restaurants. Heating comes mostly from district heating but electrical
heating is also used.
Max only uses electricity from wind power so electricity makes a small
contribution to the carbon footprint. The carbon footprint from
electricity use calculated with the market-based methodology amounts
to about 1,700 tonnes CO2e. The corresponding impact from the use of
electricity calculated with the location-based methodology amounts to
about 2,400 tonnes CO2e. In the final result, the market-based outcome
is used.
Business-related travel has a relatively high climate impact, making up
almost 1% of the total and 17% of the emissions from the company’s
own operations. Air travel is the main component, with 927 tonnes
CO2e.
Återvinning
21%
Deponi
0,1%
Energiutvinni
ng
79%
Figure 7 Handling of waste (in tonnes) at Max restaurants in Sweden during 2017.
30Max – Carbon footprint, 2017 May 2018
The handling of waste has a major impact on the climate, accounting for
1/3 of the greenhouse gas emissions from Max’s own operations. A
significant proportion (79%) of waste is used for energy recovery and
this has a negative effect on the environment. If the proportion of the
waste that consisted of renewable materials was increased, the carbon
footprint would be reduced. A reduction in the amount of resources
which end up as waste would reduce the carbon footprint, as would a
greater proportion of recyclable materials.
Home deliveries by Max have increased significantly and are made in
more and more countries. The 40 restaurants which deliver burgers
give rise to a relatively small volume of greenhouse gas emissions,
corresponding to 62 tonnes CO2e. Here, it is assumed that deliveries are
made by car, but emissions are probably lower than estimated since a
large proportion of deliveries are by bicycle and moped. However
information from the distributors is not available.
Carbon footprint in different countries
Supporting documentation from the Norwegian business was more
complete in 2017 than in previous years. The same applied to
information from the Swedish operations. The calculations for
Denmark for 2017 were based solely on a proportion of total sales.
During 2017 work started to ensure that input data is received from
operations in Poland and Egypt. However, the data received so far has
not provided the basis for a specific calculation for these counties, given
that they have been operational for less than six months. So emissions
from these operations in these countries, together with the United Arab
Emirates, have been estimated based on sales. The number of tonnes
CO2e per country is shown below.
31Max – Carbon footprint, 2017 May 2018
Norge Polen Egypten Förenade
4% 0,1%
Danmark 0,2% Arabemiratet
2% 1%
Sverige
93%
Figure 8 Distribution of greenhouse gas emissions (tonnes CO2e) during 2017 for
all of the countries in which Max operations.
The diagram below shows the carbon footprint per restaurant for the
period 2007-2017.
1 200
Tonnes of CO2e per restaurant,
1 000
recalculated 2017
800
600
400
200
0
Figure 9 Max’s carbon footprint expressed as tonnes CO2e from soil to table per
restaurant, between 2007 and 2017.
32Max – Carbon footprint, 2017 May 2018
Max Burger's carbon offsetting
Background
Since 2008 Max Burgers AB has offset through ZeroMission the
emissions from all its operations and menus, based on greenhouse gas
assessments by U&We. This section of the report covers Max’s carbon
offsetting for 2017, which includes the purchase of 105,000 tonnes of
carbon offset credits.
In 2017 100% of Max’s carbon offsetting was allocated to the Plan Vivo-
certified project Trees for Global Benefits in Uganda, run by the local
organization Ecotrust.
Actors and concepts
The process from Max ordering carbon offsets through ZeroMission,
through to the retirement of the credits issued by the Trees for Global
Benefits project, includes several actors and various key concepts.
Below is an overview and description of these.
Max: Carbon offset buyer.
ZeroMission: Swedish carbon offset reseller.
Plan Vivo: A carbon offset standard focusing on poverty reduction and
payments for ecosystem services, used to certify projects in which trees
are planted or preserved in cooperation with local people.
Plan Vivo Foundation: A registered non-profit foundation in
Edinburgh, which reviews, validates, verifies and monitors carbon
offset projects, and issues carbon offset certificates. The organisation
specializes in sustainable forestry and tree-planting projects carried out
in collaboration with smallholders and communities.
Ecotrust: Local well-established non-profit environmental organization
in Uganda, which runs the project "Trees for Global Benefits."
Trees for Global Benefits: The name of the Plan Vivo project in
33Max – Carbon footprint, 2017 May 2018
Uganda, through which Max did 100% of its carbon offsetting in 2017
and has historically done the bulk of its carbon offsetting.
Escrow: An account service by which payments made by Max for
carbon offsets are secured until the Plan Vivo Foundation has approved
the project's Annual Reports and subsequently issued credits. The
purpose is to minimize financial risks.
Markit: An international register in which all Plan Vivo certificates are
registered, transferred and retired.
Ex-ante credits: Max buys Plan Vivo-certified "ex-ante credits" which
means the credits are sold in advance, before the full emissions benefit
has been achieved.
Process description
Below is a description of the process from Max ordering carbon offsets
in accordance with agreed volumes and prices for 2017, through to the
money reaching the smallholders in the Trees for Global Benefits
project. Beforehand a contract is signed, and the volume and prices
agreed between ZeroMission and Ecotrust to ensure that the project is
able to recruit and retain enough smallholders to meet Max’s carbon
offsetting requirements.
34Max – Carbon footprint, 2017 May 2018
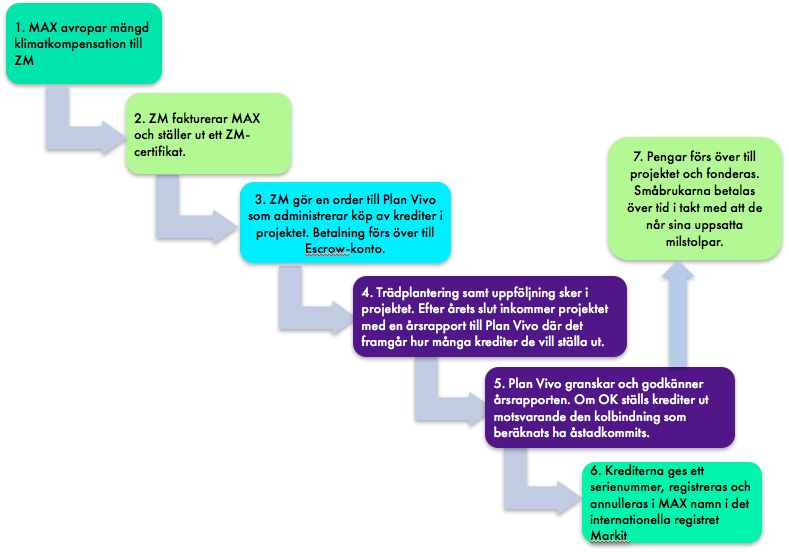
Figure 10. Process for Max’s carbon offsetting via ZeroMission.
1. Max places an order for carbon offsets with ZeroMission. The volume
of carbon offsets ordered is based on a forecast for the coming year
which in turn is based on the previous years' carbon footprint. For 2017
Max anticipated that it would need 105,000 tonnes of CO2e. After the
greenhouse gas assessment for 2017 is completed, the volume of carbon
offsetting is adjusted to take into account the results of the assessment.
If the carbon footprint exceeds the forecast, more credits are purchased
from the project. If the carbon footprint is lower than expected, the
“extra” credits are deducted from the next purchase.
2. ZeroMission issues a ZeroMission-specific certificate and invoice to
Max. The unique certificate number is recorded in ZeroMission's
internal tracking system. 50% of the estimated volume of offsets
required was invoiced in June 2017 to cover Max’s requirements for
Q1Q2. The remaining 50% was invoiced in October 2017 to cover
requirements for Q3Q4. Invoicing in 2017 was done separately for
Sweden, including franchise companies, and Norway. See Appendices
1-4.
3. ZeroMission sends an order to the project and payment is sent to an
Escrow account held by the Plan Vivo Foundation. See Appendices 5-6.
4. Ecotrust recruits enough smallholders to plant the total number of
trees required to sequester the required amount of carbon dioxide.
From year to year Ecotrust may accumulate a stock of unsold credits –
when results exceed forecasts - which they are likely to sell to their
existing customer base.
During the year activities are carried out in the project with the
smallholders. An important activity "monitoring", or follow-up, which
takes place according to a pre-determined plan and which forms the
basis for the issuance of credits and the payments to the smallholders.
The monitoring determines whether the farmers have reached their
milestones (eg number of trees of a certain size) and the carbon
sequestered is measured and quantified. Everything is reported in the
annual report that Ecotrust submits to the Plan Vivo
Foundation at the end of the year. The Annual Report also lists the
challenges faced by the project and how these are being addressed. The
35Max – Carbon footprint, 2017 May 2018
Annual Report is available on the Plan Vivo Foundation website for
anyone to read.
5. The Plan Vivo Foundation reviews the Annual Report. When the
Annual Report is approved, credits are issued from the project
corresponding to the carbon sequestration indicated by the monitoring.
3. The Plan Vivo Foundation issues the credits in Markit. ZeroMission
will retire the credits bought by Max in Max’s name, which means they
are traceable and cannot be resold.
4. The money from the Escrow account is transferred to Ecotrust to
fund payments to the smallholders over a 10-year period when they
meet their pre-determined milestones.
5. The process outlined above extends over a period of a year. At the
time of writing, the Annual Report by Trees for Global Benefit for 2017
is under review at the Plan Vivo Foundation and we have received
preliminary notification that the credits will be issued in Markit later
this summer.
Appendices
The following appendices were provided as evidence that Max’s carbon
offsetting is paid and ordered from the Trees for Global Benefits project.
Appendix 1. ZeroMission’s certificate to Max for Q1Q2, 50 012 tonnes
CO2e, certificate number: 161277
Appendix 2. ZeroMission’s certificate for MAX for Q3Q4, 50 012 tonnes
CO2e, certificate number: 171407
Appendix 3. ZeroMission invoice to MAX for Q1Q2, 50 012 tonnes
CO2e, invoice number: 60242
Appendix 4. ZeroMission invoice to Max for Q3Q4, 50 012 tonnes CO2e,
invoice number: 70028
Appendix 5. ZeroMission’s order to the Plan Vivo Foundation for
carbon offsetting Q1Q2, corresponding to 50,012 tonnes and 6,746
tonnes CO2e which represented the difference between the forecasted
emissions and the results of the emissions assessment for 2016. Order
36You can also read