Analysis of Nicotine and Impurities in Electronic Cigarette Solutions and Vapor
←
→
Page content transcription
If your browser does not render page correctly, please read the page content below

Foods, Flavors & Fragrances

           Analysis of Nicotine and Impurities in
         Electronic Cigarette Solutions and Vapor
                                              By Jason S. Herrington, Colton Myers, and Amanda Rigdon

Abstract
Electronic cigarettes (e-cigarettes) are growing in popularity exponentially. Despite their ever-growing acceptance, relatively little
work has been done to characterize their vapor. To date, the majority of e-cigarette research has focused on characterizing the so-
lutions, which are ultimately vaporized for the end user to inhale. The current study focused on developing a complete analytical
package for the quick and simple analysis of electronic cigarette solutions and vapor to determine nicotine content and impurity
profiles. Rapid (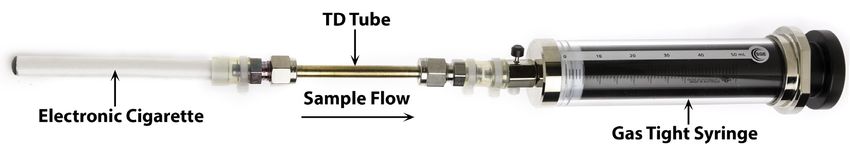
Experimental
Electronic Cigarettes and Liquids
Four commercially available electronic cigarettes (Table I) were chosen from the “Best E-Cigarettes of 2014,” which is a top 10 list of
e-cigarettes as viewed by “experts and users” [10]. It is important to note that these four chosen e-cigarettes also routinely appeared
on other web-based review sites as “top 10” performers. In addition, these four brands were readily obtained from local stores. All
four e-cigarettes were “1st generation” cigarettes (i.e., generally mimicking the size and look of regular cigarettes) [11] and, with
the exception of vendor D, were disposable. In addition to the e-cigarettes, their respective e-liquids (i.e., same brand, flavor, and
nicotine content) were obtained.

Vendors A, B, and C indicated their claimed nicotine percentage was based on wt/wt analysis. Vendor D indicated their labeled
value was based on vol/vol analysis; however, one side of the D refill solution bottle denoted 1,000 mg of nicotine, which is in keep-
ing with a wt/wt analysis (which appears to be the industry standard) or a wt/vol analysis. Therefore, it was not entirely clear how
vendor D determined their nicotine concentrations. Upon receipt, 1 mL of each e-cigarette solution was pipetted with a calibrated
syringe onto a calibrated scale to determine the density of each solution. Measured densities were later used to convert wt/wt label
claims to wt/vol values for direct comparison to the analytically determined wt/vol values using the following equation:
                                                                 mg                                    mg
              Nicotine Concentration (mg/mL) = Solution Density (—— ) x Vendor Claimed Concentration ( —— )
                                                                 mL                                    mg

 Table I: Characteristics of Electronic Cigarettes and Liquids

       Vendor                   Claimed Nicotine % (wt /wt)                                      Style                                     Measured Density (g/mL)
          A                         1.8 (18 mg/1,000 mg)                                     Classic Tobacco                                         1.1179
          B                         1.2 (12 mg/1,000 mg)                                     Classic Tobacco                                         1.1843
          C                         1.2 (12 mg/1,000 mg)                                        Menthol                                              1.2006
          D                        1.8 (18 mL/1,000 mL)*                                     Classic Tobacco                                         1.1271
     *One label on the solution refill bottle indicated the % nicotine was based on % vol /vol; however, the other side of the bottle denoted 1,000 mg, which is in keeping
      with wt/wt analysis.

                  www.restek.com                                                         2
Nicotine
The following system was used to analyze electronic cigarette e-liquid nicotine concentrations: an Agilent 7890A GC equipped
with an Agilent FID. An Rtx®-VMS column was chosen as the analytical column based on its unique ability to separate volatile
compounds. The GC-FID parameters for both helium and hydrogen carrier gases are presented in Table II. The nicotine levels of
the e-cigarette solutions were determined by calibrating the GC-FID with a National Institute of Standards and Technology (NIST)
traceable nicotine standard (cat.# 34085). The 1,000 µg/mL nicotine standard was serially diluted with methylene chloride to gener-
ate a 7-point external calibration curve (Table III). Although not shown, a United States (U.S.) Environmental Protection Agency
(EPA) Method 8260 internal standard (cat.# 30074) was found to be suitable for the current work.
All electronic cigarette solutions were diluted with methylene chloride by one hundred fold. This dilution was carried out for the
following reasons: 1) Initial work with the e-cigarette solutions indicated the liquids were relatively viscous in nature. This viscosity
resulted in the formation of air bubbles in the autosampler syringe. A 100:1 dilution remedied any viscosity issues. 2) The e-cigarette
solutions chosen for this study appeared to have nicotine concentrations of ~15–25 mg/mL, which was outside the concentration
range of the calibration curve (Table III). A 100:1 dilution resulted in nicotine levels that fell between the upper and lower limits
of the calibration curve. It is important to note that methylene chloride was chosen as the diluent instead of methanol because the
methanol solvent peak coeluted with the ethanol (one of the major constituents of e-cigarette solutions) peak.
Table II: Analytical system and parameters utilized for quantifying the nicotine content of electronic cigarette
liquids.
Agilent 7890A GC-FID
Column Rtx-VMS, 30 m, 0.25 mm ID, 1.40 µm (cat.# 19915)
Injection Diluted (100:1) electronic cigarette liquid
Inj. Vol. 1.0 µL split (200:1)
Liner Sky 4 mm Precision liner w/wool (cat.# 23305.5)
Inj. Temp. 250 °C
Septum Purge Flow 3 mL/min
Detector FID @ 250 °C
Carrier Gas He, constant flow H₂, constant flow* H₂, constant flow*
Flow Rate 2.0 mL/min 2.50 mL/min 2.50 mL/min
Linear Velocity 44.4 cm/sec 67.2 cm/sec 67.2 cm/sec
Oven 100 °C to 260 °C at 35 °C/min (hold 0.25 min) 100 °C to 260 °C at 54 °C/min (hold 0.15 min) 100 °C to 240 °C at 35 °C/min
*Requires a fast ramping oven
Table III: External nicotine calibration curve for quantifying the nicotine content of electronic cigarette liquids.
1.00 mg/mL Nicotine Standard (cat.# 34085)
Level µL of Previous Level µL of Methylene Chloride Total Volume (µL) Concentration (mg/mL)
1 NA NA NA 1.00
2 100 100 200 0.500
3 100 100 200 0.250
4 100 100 200 0.125
5 100 100 200 0.063
6 100 100 200 0.031
7 100 100 200 0.016
3 www.restek.comImpurities
The following analytical system was used for the qualitative determination of any impurities found in the electronic cigarette solu-
tions: an Agilent 7890B GC coupled with an Agilent 5977A MS detector. The GC-MS parameters are presented in Table IV. This
analysis also utilized the Rtx®-VMS column based on its proven performance for volatile compounds.
Table IV: Analytical system and parameters utilized for determination of electronic cigarette solution impurities.
Agilent 7890B/5977A GC-MS Parameters
Column Rtx-VMS, 30 m, 0.25 mm ID, 1.40 µm (cat.# 19915)
Injection Diluted (2:1) electronic cigarette liquid
Inj. Vol. 1.0 µL split (10:1)
Liner Sky 4 mm Precision liner w/wool (cat.# 23305.5)
Inj. Temp. 250 °C
Purge Flow 3 mL/min
Oven 35 °C (hold 1 min) to 250 °C at 11 °C/min (hold 4 min)
Carrier Gas He, constant flow
Flow Rate 2.0 mL/min
Linear Velocity 51.15 cm/sec
Detector MS
Mode Scan
Transfer Line Temp. 250 °C
Analyzer Type Single quadrupole
Source Temp. 230 °C
Quad Temp. 150 °C
Electron Energy 70 eV
Tune Type BFB
Ionization Mode EI
Acquisition Range 15 – 550 amu
Rate 5.2 scans/sec
Vapor
Electronic cigarette vapor was analyzed for nicotine and impurities by trapping the vapor on thermal desorption tubes. Goniewicz
et al. and other researchers have used smoking machines (e.g., Teague TE-2, Borgwaldt RM20S) to generate and collect e-cigarette
aerosols; however, access to such an apparatus was not available for this study [7]. Therefore, in order to provide reproducible and
quantitative results, a simple sampling device (Figure 1) was adapted from a 50 mL gas-tight syringe (cat.# 24761). The syringe was
used to draw 40 mL of vapor in ~4 seconds from the e-cigarettes across a stainless steel thermal desorption tube packed with Tenax
TA, Carbograph TD, and Carboxen 1003 (unconditioned [cat.# 26469] or conditioned [cat.# 26470]). This tube was chosen based
on the optimized combination of three sorbents to screen for VOCs in the C2-3 range up to SVOCs in the C30-32 range. Although
this method was manual, a ~4-second puff was utilized, as suggested based on Farsalinos et al.’s observations on e-cigarette topog-
raphy [12]. In addition to the single puff sample, a 10-puff sample was also taken in order to mimic a smoking regime. This sample
was taken by manually drawing ten 4-second puffs separated by 10-second intervals between puffs. The desorption tube was then
transferred to the following analytical system for determining the VOCs and SVOCs directly emitted from an e-cigarette: a Markes
UNITY™ thermal desorption system paired with an Agilent 7890B GC coupled to an Agilent 5977A MS detector. The UNITY™
system and GC-MS parameters are presented in Table V and Table IV, respectively.
The vapor concentrations of selected VOCs were calculated from a 5-point calibration curve generated by analyzing a series of
volumes of a 10.0 ppbv primary standard (Table VI). The 10.0 ppbv primary standard was generated by injecting 180 mL of a 1.00
ppmv 75 component TO-15 + NJ mix (cat.# 34396) and 180 mL of a 1.00 ppmv ozone precursor mixture/PAMS (cat.# 34420) into an
evacuated 6-liter SilcoCan® air monitoring canister (cat.# 24142-650) and pressurizing the canister to 30 psig with 50% RH nitrogen.
Ochiai et al. [13] determined 50% RH to be optimal for stability. The standard was allowed to age for 7 days.
www.restek.com 4Figure 1: Gas-tight syringe sampling apparatus for quantitatively drawing electronic cigarette vapor into a thermal
desorption tube.
Table V: Markes UNITY™ thermal desorption system and parameters utilized for thermally extracting electronic
cigarette aerosols for the qualitative and quantitative determination of VOCs and SVOCs emitted from electronic
cigarettes.
Markes UNITY Parameters
General Settings Trap Settings
Operating Mode Standard two stage Pre-Trap Fire Purge 1.0 min
Standby Split True Flow 20.0 mL/min
Standby Flow 5 mL/min Trap Low 0 °C
Flow Path Temperature 210 °C Heating Rate Max
Minimum Carrier Pressure 5.0 psi Trap High 320 °C
GC Cycle Time 0.0 Trap Hold 5 min
Split On True
Pre-Desorption Split On 20 mL/min
Prepurge Time 1.0 min
Trap in Line False
Split On True
Flow 20 mL/min
Tube/Sample Desorption
Time 1 10.0 min
Temperature 1 320 °C
Trap in Line True
Split On False
Table VI: Calibration curve for calculating vapor concentrations determined on a Markes UNITY™ thermal
desorption system.
Standard (ppbv) Injection Volume (mL) Calibration Concentration (ppbv)
10.0 720 180
10.0 360 90
10.0 120 30
10.0 40 10
10.0 4 1.00
5 www.restek.comBlanks
The Markes UNITY™ system was operated with helium carrier gas for desorbing the thermal desorption tubes and the cryogenic
trap during ballistic heating for analyte focusing on the head of the analytical column. The combination of helium gas (devoid of
oxygen) and elevated temperatures may have established conditions that were ideal for pyrolysis of propylene glycol and/or glyc-
erin. The pyrolysis of propylene glycol and glycerin has been demonstrated to produce formaldehyde, acetaldehyde, and acrolein.
Therefore, the following experiments were conducted to evaluate any compound contributions from the TD-GC-MS process itself:
empty stainless steel tubes (i.e., no sorbents) and packed thermal desorption tubes (i.e., multi-bed sorbents) were injected with 1
µL aliquots of the electronic cigarette solutions and run through the TD-GC-MS analysis. In addition, the air drawn through the
electronic cigarettes during sampling came from the laboratory. Due to the ubiquitous nature of VOCs such as formaldehyde and
benzene, it was imperative to determine the background contributions of VOCs to the vapor analysis. Therefore, 40 mL samples
of the laboratory air were periodically collected with thermal desorption tubes and analyzed with the same TD-GC-MS method.
Results and Discussion
Nicotine
Analyses of electronic cigarette solutions, as shown in Figure 2 (helium), Figure 3 (hydrogen, fast ramp), and Figure 4 (hydrogen,
standard ramp), using the GC-FID conditions in Table II afforded the rapid (i.e., 0.995).
As shown in Table VII, the vendor claimed nicotine concentrations were lower than the actual measured nicotine concentrations by
4 to 28%. Recall the wt/wt label claims were converted to wt/vol values using the measured density of each solution in order to allow
direct comparison to the actual values determined analytically using the calibration curve. The observation of increased nicotine
content was consistent with what Schober et al. [8] and others have observed as well.
Figure 2: Analysis of major electronic cigarette solution components via GC-FID (helium).
Column Rtx®-VMS, 30 m, 0.25 mm ID, 1.40 µm Peaks tR (min)
(cat.# 19915) 3 4
1. Methanol 1.285
Sample 2. Ethanol 1.355
Diluent: Methylene chloride 3. Methylene chloride 1.430
Conc.: Electronic cigarette liquid diluted 100:1 4. Propylene glycol 2.174
Injection
Inj. Vol.: 1.0 µL split (split ratio 200:1) 5. Unknown 3.371
Liner: Sky® 4 mm Precision® liner w/wool 6. Glycerin 3.446
(cat.# 23305.5) 7. Nicotine 4.632
Inj. Temp.: 250 °C
Oven
Oven Temp.: 100 °C to 260 °C at 35 °C/min
(hold 0.25 min)
Carrier Gas He, constant flow
Flow Rate: 2.0 mL/min
Linear Velocity: 44.4 cm/sec @ 100 °C 7
Detector FID @ 250 °C
Make-up Gas
Flow Rate: 50 mL/min
Make-up Gas
Type: H₂
Hydrogen flow: 40 mL/min
Air flow: 400 mL/min
Instrument Agilent 7890A GC
4.5 4.525 4.55 4.575 4.6 4.625 4.65 4.675 4.7 4.725
6
1 2 5
0.5 1 1.5 2 2.5 3 3.5 4 4.5
Time (min) GC_FF1256
www.restek.com 6Figure 3: Analysis of major electronic cigarette solution components via GC-FID (hydrogen, fast ramp).
3 4
Peaks tR (min) Column Rtx®-VMS, 30 m, 0.25 mm ID, 1.40 µm (cat.# 19915)
1. Methanol 0.861 Sample
2. Ethanol 0.905 Diluent: Methylene chloride
3. Methylene chloride 0.957 Conc.: Electronic cigarette liquid diluted 100:1
Injection
4. Propylene glycol 1.433 Inj. Vol.: 1.0 µL split (split ratio 200:1)
5. Glycerin 2.256 Liner: Sky® 4 mm Precision® liner w/wool (cat.# 23305.5)
6. Nicotine 3.030 Inj. Temp.: 250 °C
Oven
Oven Temp.: 100 °C to 260 °C at 54 °C/min (hold 0.15 min)
Carrier Gas H₂, constant flow
Flow Rate: 2.5 mL/min
Linear Velocity: 67.2 cm/sec @ 100 °C
Detector FID @ 250 °C
Make-up Gas
Flow Rate: 50 mL/min
Make-up Gas
Type: H₂
Hydrogen flow: 40 mL/min
Air flow: 400 mL/min
Instrument Agilent 7890A GC
1 5 6
2
0.5 1 1.5 2 2.5 3
Time (min) GC_FF1257
Figure 4: Analysis of major electronic cigarette solution components via GC-FID (hydrogen, standard ramp).
3
4
Peaks tR (min) Column Rtx®-VMS, 30 m, 0.25 mm ID, 1.40 µm (cat.# 19915)
1. Methanol 0.875 Sample
2. Ethanol 0.926 Diluent: Methylene chloride
3. Methylene chloride 0.987 Conc.: Electronic cigarette liquid diluted 100:1
Injection
4. Propylene glycol 1.619 Inj. Vol.: 1.0 µL split (split ratio 200:1)
5. Glycerin 2.805 Liner: Sky® 4 mm Precision liner w/wool (cat.# 23305.5)
6. Nicotine 3.927 Inj. Temp.: 250 °C
Oven
Oven Temp.: 100 °C to 240 °C at 35 °C/min
Carrier Gas H₂, constant flow
Flow Rate: 2.5 mL/min
Linear Velocity: 67.2 cm/sec @ 100 °C
Detector FID @ 250 °C
Make-up Gas
Flow Rate: 50 mL/min
Make-up Gas
Type: H₂
Hydrogen flow: 40 mL/min
Air flow: 400 mL/min
Instrument Agilent 7890A GC
5 6
1
2
0.5 1 1.5 2 2.5 3 3.5
Time (min) GC_FF1258
7 www.restek.comFigure 5: A linear response was obtained for nicotine over a concentration range of 0.06–1.00 mg/mL using the
GC-FID method as demonstrated by the external calibration curve (r > 0.995).
80
1
70
60
50
Area
2
40
30
3
20
4
10
5
76
0
0 0.2 0.4 0.6 0.8 1
Amount (mg/mL)
Table VII: Vendor nicotine concentrations as claimed and as determined in the current study by direct comparison
with pure nicotine standards via GC-FID.
Vendor Vendor Claimed Nicotine (mg/mL)^ Nicotine (mg/mL) Determined* % Difference
A 20.1 23.4 17%
B 14.2 14.8 4%
C 14.4 17.4 21%
D 20.3 26.0 28%
^ Calculated based on determined density.
* Average of 3 analyses.
Impurities in E-Cigarette Solutions
As shown in Figure 6, the analysis of electronic cigarette solutions revealed that they contained numerous compounds besides the
vendor-listed propylene glycol, glycerin, and nicotine. For the solution shown in Figure 6 (vendor A) there were 64 unidentified
and identified (some only tentatively) compounds found in the e-cigarette solution. Compounds were deemed “identified” when
verified with a subsequent run of an external standard with matching retention times and mass spectral data. Compounds were
deemed “tentatively identified” when the mass spectral quality was 80% or greater according to the NIST 2011 database [14]. Several
pyrazines were tentatively identified, which is consistent with manufacturer-added flavorings. For example, acetylpyrazine, which
was tentatively identified, is a flavorant well known for producing “nutty” flavors/aromas. In addition, several pyridines were iden-
tified, which is consistent with tobacco-derived nicotine. For example, 3-(3,4-dihydro-2H-pyrrol-5-yl)- pyridine(myosmine) was
also tentatively identified and this compound is an alkaloid found in tobacco [15]. It is important to note that almost half (36) of the
compounds were unidentified; future work should focus on identifying these compounds.
www.restek.com 8Figure 6: Analysis of electronic cigarette solution (e-juice) by GC-MS revealed the presence of numerous compo-
nents in addition to the compounds listed on the product labels.
Peaks tR (min) Match EC Blank Region Peaks tR (min) Match EC Blank Region
Quality Liquid Quality Liquid
1. Nitrogen/oxygen/carbon dioxide 1.051 100 x x Red 33. Unidentified 13.229 x Green
2. Water 1.441 100 x x Red 34. 1-(3-Pyridinyl)ethanone 13.321 94 x Green
3. Methanol 1.709 100 x x Red 35. Unidentified 13.412 x Green
4. Unidentified 1.934 x x Red 36. Unidentified 13.463 x Green
5. cis-1,2-Dimethylcyclopropane 2.117 94 x x Red 37. Unidentified 14.479 x Green
6. Ethanol 2.239 100 x Red 38. Unidentified 14.534 x Green
7. 1,1-Dichloroethene 2.282 94 x x Red 39. Unidentified 14.643 x Green
8. Methylene chloride 2.757 100 x x Red 40. Unidentified 14.863 x Green
9. 1,2-Dichloroethene 2.891 94 x x Red 41. Unidentified 15.003 x Green
10. Ethyl acetate 4.037 91 x Red 42. Nicotine 15.800 100 x Green
11. Unidentified 6.000 x Red 43. Unidentified 16.161 x Blue
12. Unidentified 6.085 x Red 44. Unidentified 16.222 x Blue
13. Toluene 6.207 100 x Red 45. α-Damascone 16.289 95 x Blue
14. Propylene glycol 7.853 100 x Orange 46. Unidentified 16.374 x Blue
15. 2,3-Dimethylpyrazine 9.243 91 x Orange 47. Unidentified 16.417 x Blue
16. Unidentified 9.615 x Orange 48. Unidentified 16.478 x Blue
17. Unidentified 9.713 x Orange 49. Unidentified 16.643 x Blue
18. Unidentified 9.889 x Orange 50. Unidentified 16.984 x Blue
19. Unidentified 10.017 x Orange 51. Unidentified 17.033 x Blue
20. Unidentified 10.060 x Orange 52. Myosmine 17.155 95 x Blue
21. Trimethylpyrazine 10.383 94 x Orange 53. Unidentified 17.276 x Blue
22. Unidentified 10.828 x Orange 54. Unidentified 17.380 x Blue
23. Unidentified 10.907 x Orange 55. Unidentified 17.441 x Blue
24. Unidentified 11.047 x Orange 56. Nicotine 1-N-oxide 17.533 93 x Blue
25. Unidentified 11.114 x Orange 57. Anabasine 17.697 98 x Blue
26. Acetylpyrazine 11.394 95 x Orange 58. Nicotyrine 17.752 91 x Blue
27. N-(1-Methylethyl)benzenamine 11.864 80 x Orange 59. Unidentified 18.105 x Blue
28. Dipropylene glycol 12.071 91 x Orange 60. 2,3-Dipyridyl 18.550 97 x Blue
29. Glycerin 12.473 100 x Orange 61. Unidentified 19.788 x Blue
30. Dipropylene glycol methyl ether 13.040 80 x Green 62. Unidentified 21.025 x Blue
31. Unidentified 13.107 x Green 63. Unidentified 21.092 x Blue
32. Unidentified 13.168 x Green 64. Cotinine 21.635 91 x Blue
1 2 3 6,7 8 9 14 26 29 42
52
60
5
64
56 57
15
30
58
13 34
10
27
2.00 4.00 6.00 8.00 10.00 12.00 14.00 16.00 18.00 20.00 22.00
Time (min) GC_FF1260
Column Rtx®-VMS, 30 m, 0.25 mm ID, 1.40 µm Oven Transfer Line
(cat.# 19915) Oven Temp.: 35 °C (hold 1 min) to 250 °C at 11 °C/min (hold 4 min) Temp.: 250 °C
Sample Carrier Gas He, constant flow Analyzer Type: Quadrupole
Diluent: Methylene chloride Flow Rate: 2.0 mL/min Source Type: Extractor
Conc.: Electronic cigarette liquid diluted 2:1 Linear Velocity: 51.15 cm/sec @ 35 °C Extractor Lens: 6mm ID
Injection Detector MS Source Temp.: 230 °C
Inj. Vol.: 1 µL split (split ratio 10:1) Mode: Scan Quad Temp.: 150 °C
Liner: Sky® 4 mm Precision® liner w/wool Scan Program: Start Time Scan Range Scan Rate Electron Energy: 70 eV
(cat.# 23305.5) Group (min) (amu) (scans/sec) Tune Type: BFB
Inj. Temp.: 250 °C 1 0 15-550 5.2 Ionization Mode: EI
Instrument Agilent 7890B GC & 5977A MSD
9 www.restek.comVapor
As shown in Figure 7, the simple sampling device (Figure 1) was able to successfully draw electronic cigarette vapor into a thermal
desorption tube and provide detectable levels of VOCs and SVOCs from a single 40 mL puff. As observed in the impurities study,
there clearly were numerous compounds (i.e., 82 unidentified and identified [some only tentatively]) in the e-cigarette vapor beyond
propylene glycol, glycerin, and nicotine. However, the analysis of the vapor revealed the presence of 18 more compounds in addition
to those found in the liquid analysis. Of particular interest was the presence of formaldehyde, acetaldehyde, acrolein, and xylenes, as
well as several siloxanes. The current observation of these three carbonyls (formaldehyde, acetaldehyde, and acrolein) was consistent
with Goniewicz et al.’s [7] and Kosmider et al.’s [9] observations.
These observations are significant for the two following reasons: 1. All three of these carbonyls are acutely toxic; in addition, form-
aldehyde is a known human carcinogen [16] and acetaldehyde is a probable human carcinogen [17]. 2. These compounds were not
present in the e-juice, which indicates they were generated during the vaporization process and/or from the e-cigarette materials.
This is consistent with the fact that pyrolysis of glycerin results in the formation of formaldehyde, acetaldehyde, and acrolein [18].
This is also consistent with the fact that polysiloxanes are often used as plastic additives and the majority of the first generation e-
cigarettes, like those evaluated in this study, are made with plastic bodies. All of the aforementioned have profound implications
for how e-cigarettes should be evaluated, especially when considering that end users are ultimately exposed to the e-cigarette vapor
rather than the liquid.
To expound upon this further, acrolein was not found in the electronic cigarette solutions. However, acrolein was found in the
vapor from all four of the e-cigarettes evaluated in the current study. The acrolein concentrations ranged from 1.5 to 6.7 ppmv per
40 mL puff (0.003–0.015 µg/mL), which is comparable to the 0.004 µg/mL Goniewicz et al. reported [7]. To put these concentra-
tions into perspective, these levels exceeded the National Institute of Occupational Safety and Health (NIOSH) short-term exposure
limit (STEL) of 350 ppbv. Furthermore, assuming 40 mL per puff and 400 to 500 puffs per e-cigarette (values suggested by several
e-cigarette manufacturers), each e-cigarette would generate ~20 to 230 µg of acrolein. From a human health perspective, the acro-
lein emissions observed in the current study appear to be on par with what has previously been reported for conventional tobacco
cigarettes (3 to 220 µg of acrolein/cigarette) [19]. Formaldehyde and acetaldehyde standards were not available at the time of pub-
lishing this application note. However, their peak areas were on the same order of magnitude as acrolein, thereby suggesting their
concentrations were comparable, which is also consistent with what Goniewicz et al. reported [7].
Currently, the U.S. Food and Drug Administration (FDA) does not have any regulatory authority over electronic cigarettes. How-
ever, the FDA does acknowledge that e-cigarettes, their associated risks, nicotine levels, and any potentially harmful chemicals
inhaled are “not fully studied.” Therefore, the FDA has issued a proposed rule to extend their authority to include e-cigarettes [20].
Regardless of the status of the FDA’s authority over e-cigarettes, it is clear from the current research and the research of others that
the e-cigarette landscape is not fully understood. However, it appears that e-cigarettes are not without human health risks. Most im-
portant, and as demonstrated by the current work, when designing future e-cigarette studies investigators should strongly consider
the difference between analyzing electronic cigarette solutions and analyzing electronic cigarette vapor, as it very clear that their
chemical profiles are different.
www.restek.com 10Figure 7: A single 40 mL puff of electronic cigarette vapor collected on a thermal desorption tube and analyzed via
GC-MS.
67
A. Full Scale
67
A. Full Scale
A. Full Scale
41
41
72
72
9 64
9 64
2.00 4.00 6.00 8.00 10.00 12.00 14.00 16.00 18.00 20.00 22.00
2.00 4.00 6.00 8.00 10.00 12.00 14.00 16.00 18.00 20.00 22.00
B. Baseline Magnification
B. Baseline Magnification
B. Baseline
5,6
Magnification
7
3,4 5,6 7 67 72
9 71
3,4 41-45 64,66 67 72
9 71
41-45 64,66
60
60
74
8 74
68
8
6870
14,15 63
2 70
14,15 63
2
47
16,17 28 47
16,17 28
48
38 48
19 38 55
19
20 30 54
5559 61
20 30 54
1 11 59 61
1 34 37
11 23
34 37
23
2.00 4.00 6.00 8.00 10.00 12.00 14.00 16.00 18.00 20.00 22.00
2.00 4.00 6.00 8.00 10.00 12.00 14.00 16.00 18.00 20.00 22.00
Time (min)
Time (min) GC_AR1161
11 www.restek.comFigure 7: Peak List
Peaks tR (min) Match Vapor Blank* Region Peaks tR (min) Match Vapor Blank* Region
Quality Quality
1. Nitrogen/oxygen 0.685 100 x x Red 43. p-Xylene 8.048 100 x Green
2. Carbon dioxide 1.063 100 x x Red 44. o-Xylene 8.530 100 x Green
3. Propene 1.200 100 x Red 45. Styrene 8.597 100 x Green
4. Formaldehyde 1.227 100 x Red 46. Unidentified 9.158 x Green
5. Sulfur dioxide 1.313 90 x Red 47. Octamethylcyclotetrasiloxane 9.218 91 x Green
6. Chloromethane 1.380 100 x Red 48. 4-Methyl-1-
7. Water 1.453 100 x x Red (1-methylethyl)cyclohexene 9.371 95 x Green
8. Acetaldehyde 1.672 100 x Red 49. Unidentified 9.639 x Green
9. Methanol 1.715 100 x x Red 50. Unidentified 9.852 x Green
10. Unidentified 1.885 x Red 51. Unidentified 9.932 x Green
11. Ethanol 2.270 100 x Red 52. Unidentified 10.121 x Green
12. Unidentified 2.331 x Red 53. Unidentified 10.219 x Green
13. Unidentified 2.410 x Red 54. Trimethylpyrazine 10.468 80 x Green
14. Acrolein 2.581 100 x Red 55. Benzaldehyde 10.657 100 x Green
15. Propanal 2.629 100 x Red 56. Unidentified 10.858 x Green
16. Methylene chloride 2.770 100 x x Red 57. Unidentified 11.120 x Green
17. Acetone 2.843 100 x Red 58. Unidentified 11.187 x Green
18. Unidentified 2.892 x Red 59. Acetylpyrazine 11.541 93 x Green
19. Hexane 2.928 100 x Red 60. Decamethylcyclopentasiloxane 11.620 91 x Green
20. Acetonitrile 3.160 100 x x Red 61. Phenol 11.870 94 x Green
21. Unidentified 3.544 x Orange 62. Unidentified 12.272 x Green
22. Unidentified 3.842 x Orange 63. 1,1'-Oxybis-2-propanol 12.333 90 x Green
23. Trimethylsilanol 3.928 100 x Orange 64. Glycerin 12.748 100 x Blue
24. Unidentified 4.092 x Orange 65. Unidentified 13.327 x Blue
25. Unidentified 4.159 x Orange 66. Dodecamethylcyclohexasiloxane 13.979 94 x Blue
26. Unidentified 4.245 x Orange 67. Nicotine 15.862 100 x Blue
27. Unidentified 4.354 x Orange 68. Tetradecamethylhexasiloxane 16.082 91 x Blue
28. Benzene 4.452 100 x x Orange 69. Unidentified 16.326 x Blue
29. Unidentified 4.519 x Orange 70. Unidentified 16.460 x Blue
30. Acetic acid 5.055 86 x Orange 71. Myosmine 17.216 94 x Blue
31. Unidentified 5.141 x Orange 72. Nicotyrine 17.807 90 x Blue
32. Unidentified 5.647 x Orange 73. Unidentified 18.002 x Blue
33. Unidentified 5.756 x Orange 74. 2,3'-Dipyridyl 18.618 94 x Blue
34. 1-Hydroxy-2-propanone 6.073 80 x Orange 75. Unidentified 18.721 x Blue
35. Unidentified 6.165 x Orange 76. Unidentified 19.294 x Blue
36. Unidentified 6.220 x Orange 77. Unidentified 19.611 x Blue
37. Toluene 6.280 100 x x Orange 78. Unidentified 20.093 x Blue
38. Hexamethylcyclotrisiloxane 6.506 91 x Orange 79. Unidentified 20.190 x Blue
39. Unidentified 7.231 x Orange 80. Unidentified 20.269 x Blue
40. Unidentified 7.530 x Orange 81. Unidentified 20.501 x Blue
41. Propylene glycol 7.737 100 x Green 82. Unidentified 20.855 x Blue
42. m-Xylene 8.048 100 x Green
*The concentrations of these compounds in e-cigarette vapor were too close to blank and/or laboratory air concentrations to definitively state they were emitted from the e-cigarettes.
Column Rtx®-VMS, 30 m, 0.25 mm ID, 1.40 µm (cat.# 19915)
Sample
Conc.: One 40 mL puff of electronic cigarette vapor drawn via a gas-tight syringe to replicate vaping
Injection Direct
Oven
Oven Temp.: 35 °C (hold 1 min) to 250 °C at 11 °C/min (hold 4 min)
Carrier Gas He, constant flow
Flow Rate: 2.0 mL/min @ 35 °C
Detector MS
Mode: Scan
Scan Program: Start Time Scan Range Scan Rate
Group (min) (amu) (scans/sec)
1 0 15-550 5.2
Transfer Line
Temp.: 250 °C
Analyzer Type: Quadrupole
Source Type: Extractor
Extractor Lens: 6mm ID
Source Temp.: 230 °C
Quad Temp.: 150 °C
Electron Energy: 70 eV
Tune Type: BFB
Ionization Mode: EI
Preconcentrator Markes UNITY™
Instrument Agilent 7890B GC &
5977A MSD
Acknowledgement Markes
www.restek.com 12Blanks
The 1 µL aliquots of electronic cigarette solutions injected into empty stainless steel tubes (i.e., no sorbents) and analyzed via the
TD-GC-MS method resulted in the formation of formaldehyde, acetaldehyde, and acrolein. However, the concentrations of these
three compounds did not increase when 1 µL aliquots of the e-cigarette solutions were injected into packed thermal desorption
tubes (i.e., multi-bed sorbents) and analyzed via the TD-GC-MS method. The two aforementioned observations are consistent with
the hypothesis that pyrolysis of propylene glycol and/or glycerin was taking place within the TD-GC-MS system itself and not in
the thermal desorption tube media (i.e., the multi-sorbent bed). However, it was unclear as to where the pyrolysis was taking place
(i.e., on the cryogenic trap during ballistic heating versus in the heated transfer lines) within the TD-GC-MS system. Regardless,
the pyrolysis was responsible for 14 to 23% of the vapor concentrations of formaldehyde, acetaldehyde, and acrolein observed in
the current study. The aforesaid percent contributions were approximated by comparing the carbonyl/nicotine ratios obtained from
the empty stainless steel tubes and packed thermal desorption tubes to the 40 mL puff samples. In addition, the laboratory air was
sometimes a source for certain VOCs; however, these levels (i.e., low ppbv) were often well below the e-cigarette levels (i.e., low to
mid ppmv). Future investigators should be aware of their laboratory air concentrations and the potential pyrolysis within the TD-
GC-MS system and make necessary adjustments in their reporting limits and/or background corrections. It was outside the scope
of the current work; however, future work should focus on reducing pyrolysis contribution by adjusting line temperatures, heating
rates, flow rates, etc.
Advantages/Limitations/Future Research
Researchers like Goniewicz et al. had access to specialized smoking machines, which enabled “realistic” smoking regimes (e.g., a
1.8 second puff with 10 second intervals between puffs). These smoking regimes may reveal more about e-cigarette vapor and/or be
more accurate than the simple sampling device (Figure 1) utilized in the current study. However, the current work is significant in
that multiple puffs were not needed because the present analytical techniques demonstrated detectability from a single 40 mL puff.
In fact, it is important to note that a smoking regime of a 4-second puff with 10-second intervals between 10 puffs was executed
manually with the simple sampling device (Figure 1). The results of this 10-puff sample are shown in Figure 8. The 10-puff sample
did reveal some early eluting compounds (i.e., identified, tentatively identified, and unidentified), which were not identified in the
single-puff (Figure 7). However, the propylene glycol and glycerin peaks, which were already overloaded in the single-puff sample,
became so large in the 10-puff sample that most of the peaks previously identified in the single-puff sample were lost due to interfer-
ence with propylene glycol and glycerin. In addition, this overloading of propylene glycol and glycerin contaminated the Markes
UNITY™ thermal desorption system, thereby requiring a time-consuming cleaning to avoid carryover.
As previously mentioned in the discussion of the blanks results, future researchers should be aware of the potential pyrolysis condi-
tions within the TD-GC-MS system and how that may affect their formaldehyde, acetaldehyde, and acrolein vapor concentrations.
Alternative sampling/analytical approaches (e.g., DNPH-coated solid sorbents) are available for these carbonyls, which would cir-
cumvent the pyrolysis issues; however, they come at the significant disadvantage of time-consuming solvent extractions and the
inability to scan for a large number of compounds (e.g., the 82 VOCs/SVOCs observed in the current study) in a single 40 mL puff.
Future TD-GC-MS work on e-cigarette vapor should focus on optimizing the thermal desorption parameters in order to reduce
pyrolysis contributions by adjusting line temperatures, heating rates, flow rates, etc. Overall, the current method may be well suited
for the easy and rapid screening of e-cigarette vapor for a large number of VOCs and SVOCs.
13 www.restek.comFigure 8: Ten 40 mL puffs of electronic cigarette vapor collected on a thermal desorption tube and analyzed via
GC-MS.
2.00 4.00 6.00 8.00 10.00 12.00 14.00 16.00 18.00 20.00 22.00
Time (min) GC_AR1162
Column Rtx®-VMS, 30 m, 0.25 mm ID, 1.40 µm (cat.# 19915)
Sample
Conc.: Ten 40 mL puffs of electronic cigarette vapor drawn via a gas-tight syringe to replicate vaping
Injection Direct
Oven
Oven Temp.: 35 °C (hold 1 min) to 250 °C at 11 °C/min (hold 4 min)
Carrier Gas He, constant flow
Flow Rate: 2.0 mL/min @ 35 °C
Detector MS
Mode: Scan
Scan Program: Start Time Scan Range Scan Rate
Group (min) (amu) (scans/sec)
1 0 15-550 5.2
Transfer Line Temp.: 250 °C
Analyzer Type: Quadrupole
Source Type: Extractor
Extractor Lens: 6mm ID
Source Temp.: 230 °C
Quad Temp.: 150 °C
Electron Energy: 70 eV
Tune Type: BFB
Ionization Mode: EI
Preconcentrator Markes UNITY™
Instrument Agilent 7890B GC &
5977A MSD
Acknowledgement Markes
www.restek.com 14Conclusions
As electronic cigarettes explode in popularity, public attention is rapidly turning toward consumer safety. While research to date has
focused primarily on the components of e-cigarette solutions, data presented here indicate a need for substantially more research
into the chemical profile of vapor samples. To that end, this study included development of analytical methods for both solution
and vapor samples. All three methods developed in the current study used an Rtx®-VMS column—a proprietary phase to Restek—
which was chosen to reduce required resources and afford easy comparison of results.
For e-cigarette solutions, rapid GC-FID methods using helium or hydrogen carrier gas were established for the determination of
nicotine content. These methods would be suitable for fast quality control testing of electronic cigarette solutions. In addition, a
straightforward GC-MS method was developed for the determination of impurities in e-cigarette solutions. Results showed that
electronic cigarette solutions contained numerous compounds in addition to the compounds listed on the label by the vendor (pro-
pylene glycol, glycerin, and nicotine). In this study, e-cigarette solution profiles revealed 64 identified (some only tentatively) and
unidentified compounds, far more than the three that were listed on the product label.
In order to analyze vapor samples, a simple yet novel sampling device was developed to draw electronic cigarette vapor into a ther-
mal desorption tube, which was then thermally extracted and analyzed via a GC-MS method. This approach provided detectable
levels of 82 VOCs and SVOCs from a single 40 mL puff and can be easily implemented by labs that do not have access to a smoking
machine. Notably, some of compounds found are known to be detrimental to human health. These compounds were detected in the
vapor, but not in the e-cigarette solution, which indicates they were produced during the vaporization process.
It is unequivocal that electronic cigarette solutions, and more important—vapor—have numerous compounds beyond the ingredi-
ents listed on the product label. As these compounds have potential implications for human health, the scientific community needs
to place more emphasis on vapor testing in order to definitively identify the chemicals present and to determine how typical usage
patterns relate to human health exposure limits.
Acknowledgements
Markes International Inc., 11126-D Kenwood Road, Cincinnati, OH 45242
15 www.restek.comReferences
[1] A. Trtchounian, M. Williams, P. Talbot, Conventional and electronic cigarettes (e-cigarettes) have different smoking characteristics, Nicotine Tob Res 12 (2010) 905.
[2] C.J. Brown, J.M. Cheng, Electronic cigarettes: product characterisation and design considerations, Tob Control 23 Suppl 2 (2014) ii4.
[3] J.K. Pepper, T. Eissenberg, Waterpipes and Electronic Cigarettes: Increasing Prevalence and Expanding Science, Chemical Research in Toxicology 27 (2014) 1336.
[4] K.E. Farsalinos, G. Romagna, D. Tsiapras, S. Kyrzopoulos, V. Voudris, Evaluating nicotine levels selection and patterns of electronic cigarette use in a group of "vapers" who had
achieved complete substitution of smoking, Subst Abuse 7 (2013) 139.
[5] C. Bullen, C. Howe, M. Laugesen, H. McRobbie, V. Parag, J. Williman, N. Walker, Electronic cigarettes for smoking cessation: a randomised controlled trial, Lancet 382 (2013) 1629.
[6] P. Caponnetto, D. Campagna, F. Cibella, J.B. Morjaria, M. Caruso, C. Russo, R. Polosa, EffiCiency and Safety of an eLectronic cigAreTte (ECLAT) as tobacco cigarettes substitute: a
prospective 12-month randomized control design study, PLoS One 8 (2013) e66317.
[7] M.L. Goniewicz, J. Knysak, M. Gawron, L. Kosmider, A. Sobczak, J. Kurek, A. Prokopowicz, M. Jablonska-Czapla, C. Rosik-Dulewska, C. Havel, P. Jacob III, N. Benowitz, Levels of selected
carcinogens and toxicants in vapour from electronic cigarettes, Tob Control 23 (2014) 133.
[8] W. Schober, K. Szendrei, W. Matzen, H. Osiander-Fuchs, D. Heitmann, T. Schettgen, R.A. Jorres, H. Fromme, Use of electronic cigarettes (e-cigarettes) impairs indoor air quality and
increases FeNO levels of e-cigarette consumers, Int J Hyg Environ Health 217 (2014) 628.
[9] L. Kosmider, A. Sobczak, M. Fik, J. Knysak, M. Zaciera, J. Kurek, M.L., Goniewicz, Carbonyl compounds in electronic cigarette vapors: effects of nicotine solvent and battery output
voltage, Nicotine Tob Res 16 (2014) 1319.
[10] E-Cig Reviews on the Best E-Cigarettes of 2014, Ecigarette Reviewed (2014). http://ecigarettereviewed.com (Accessed January 12, 2015).
[11] K.E. Farsalinos, R. Polosa, Safety evaluation and risk assessment of electronic cigarettes as tobacco cigarette substitutes: a systematic review, Ther Adv Drug Saf 5 (2014) 67.
[12] K.E. Farsalinos, G. Romagna, D. Tsiapras, S. Kyrzopoulos, V. Voudris, Evaluation of electronic cigarette use (vaping) topography and estimation of liquid consumption: implications for
research protocol standards definition and for public health authorities' regulation, Int J Environ Res Public Health 10 (2013) 2500.
[13] N. Ochiai, A. Tsuji, N. Nakamura, S. Daishima, D.B., Cardin, Stabilities of 58 volatile organic compounds in fused-silica-lined and SUMMA polished canisters under various humidified
conditions, J Environ Monit 4 (2002) 879.
[14] NIST Mass Spectrometry Data Center, U.S. Department of Commerce, 2014.
[15] A. Rodgman, T.A. Perfetti, The Chemical Components of Tobacco and Tobacco Smoke, CRC Press, 2nd ed., 2013.
[16] V.J. Cogliano, Y. Grosse, R.A. Baan, K. Straif, M.B. Secretan, F. El Ghissassi, Meeting report: summary of IARC monographs on formaldehyde, 2-butoxyethanol, and 1-tert-butoxy-
2-propanol., Environ Health Perspect 113 (2005) 1205.
[17] IARC Working Group Lyon, 13-20 October 1987, Alcohol drinking, IARC Monogr Eval Carcinog Risks Hum 44 (1988) 1.
[18] Y.S. Stein, M.J. Antal, M. Jones, A study of the gas-phase pyrolysis of glycerol, Appl Pyrolysis, 4 (1983) 283.
[19] Toxicological Profile for Acrolein, Agency for Toxic Substances and Disease Registry, U.S. Department of Health and Human Services, Atlanta, 2007.
[20] Electronic Cigarettes (e-Cigarettes), U.S. Food and Drug Administration (2014).
Questions about this or any other Restek® product?
Contact us or your local Restek® representative (www.restek.com/contact-us).
Restek® patents and trademarks are the property of Restek Corporation. (See www.restek.com/Patents-Trademarks for full list.) Other trademarks in Restek® literature or
on its website are the property of their respective owners. Restek® registered trademarks are registered in the U.S. and may also be registered in other countries.
© 2015 Restek Corporation. All rights reserved. Printed in the U.S.A.
www.restek.com Lit. Cat.# FFAN2127-UNVYou can also read