Analysis of Red Colorants and Heavy Metals in Lipstick at Traditional Market in Surabaya
←
→
Page content transcription
If your browser does not render page correctly, please read the page content below

IOP Conference Series: Materials Science and Engineering

PAPER • OPEN ACCESS

Analysis of Red Colorants and Heavy Metals in Lipstick at Traditional
Market in Surabaya
To cite this article: R Sumiyani et al 2021 IOP Conf. Ser.: Mater. Sci. Eng. 1053 012083

View the article online for updates and enhancements.

                               This content was downloaded from IP address 46.4.80.155 on 21/09/2021 at 23:42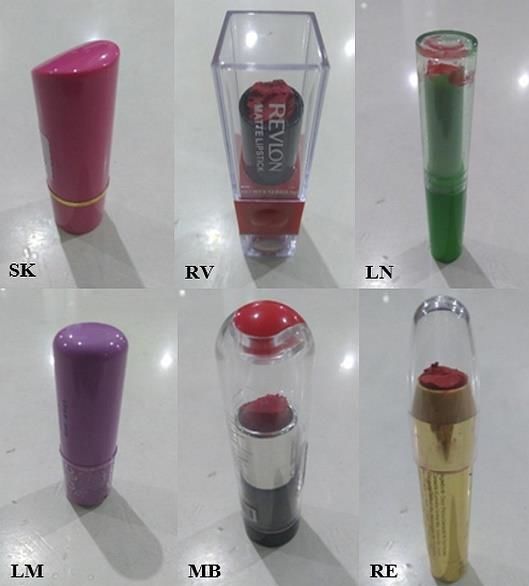
International Conference on Chemical and Material Engineering (ICCME 2020)                                               IOP Publishing
IOP Conf. Series: Materials Science and Engineering              1053 (2021) 012083           doi:10.1088/1757-899X/1053/1/012083

Analysis of Red Colorants and Heavy Metals in Lipstick at
Traditional Market in Surabaya

                     R Sumiyani1, I K C Diatmika1, N H Muslimah1 and O Rachmaniah2,*
                     1
                      Faculty of Pharmacy, Universitas Surabaya, JL Tenggilis Mejoyo, Kalirungkut,
                     Surabaya, 60294, Indonesia
                     2
                      Chemical Engineering Department, Institut Teknologi Sepuluh Nopember, Sukolilo,
                     Surabaya, 602111, Indonesia

                     E-mail: ririn_sum@staff.ubaya.ac.id; *orchidea@chem-eng.its.ac.id

                     Abstract. Lipstick is classified as decorative cosmetics, generally, with many colours’
                     variance attracting the consumers. However, red is the favourites amongst them. Protecting the
                     consumer’s health, lipstick should meet certain requirements which is registered by (National
                     Agency of Drug and Food Control (Badan Pengawas Obat dan Makanan/BPOM). Regulation
                     of BPOM No.HK.03.1.23.08.11.07517 of 2011 regulates prohibited red colorants such
                     Rhodamine B. While at regulation of BPOM No.HK.03.1.23.07.11.6662 regulates a maximum
                     level of heavy metals concentration. This study was conducted to determine the presence of
                     Rhodamine B, Red Allure, and Amaranth as well as Pb and Cd in illegal brands of red lipstick
                     at PXXX Market in Surabaya. The red colorants were identified with Thin Layer
                     Chromatography (TLC)-densitometry while the metals, lead (Pb) and cadmium (Cd), were
                     analysed with Inductively Coupled Plasma Spectrometer (ICPS). A validation method both for
                     TLC-densitometry and ICPS were performed previously prior the analysis; meet the
                     requirements for linearity, accuracy, precision as well as limit of detection (LOD) and limit of
                     quantification (LOQ). Six illegal brands of lipsticks were identified at PXXX Market in
                     Surabaya. One of them was qualitatively detected contains only Rhodamine B, 2 samples
                     contain both Rhodamine B and Red Allure while the rest of 3 brands were contain Red Allure.
                     None of them contain Amaranth. Hence, a quantitative analysis of Red Allure was further
                     conducted. The Red Allure content in the identified red lipsticks was 34.19-187.88 mg/kg,
                     below the maximum allowable content. In case of heavy metals, Pb and Cd. None of the
                     lipstick’s samples contain both Pb and Cd.

1. Introduction
   Lipstick is a decorative cosmetic contains oils, waxes, fats, aceto-glycerides, surfactants,
antioxidants, and colorants. Some artificial colorants which approved to be used in lipsticks are such
green-red no.17, DC red, red allure, and amaranth. The artificial is more preferred compare to natural
colorants due to its attractive, long-lasting, strong intensity and cheap such rhodamine B. Rhodamine
B is a favourite red colorant either in food or cosmetics as well as in cosmetics. Though it is prohibited
due its potential to be carcinogenic and damage the liver [1], it is still be found in wide variety of
products. Clean and guarantee safe of cosmetics is crucial for the health especially for part of the body
which directly contacted with such skin, lips, hair, etc [2]. This coincide to the increase of consumer

              Content from this work may be used under the terms of the Creative Commons Attribution 3.0 licence. Any further distribution
              of this work must maintain attribution to the author(s) and the title of the work, journal citation and DOI.
Published under licence by IOP Publishing Ltd                          1
International Conference on Chemical and Material Engineering (ICCME 2020) IOP Publishing
IOP Conf. Series: Materials Science and Engineering 1053 (2021) 012083 doi:10.1088/1757-899X/1053/1/012083
awareness i.e. using healthy and quality of cosmetics. Commonly safety of the products follows by the
quality. They do not affect the consumer health. Unfortunately, many cosmetics manufacturer
designed break the consumer regulations. Using low-quality of materials for gaining more benefit,
minimizing cost of the production process. Therefore, some hazardous contaminants found in low-
quality or even unregistered cosmetic products. Textile colorants as well as heavy metals such lead
(Pb) and cadmium (Cd) are the commonly found hazardous contaminants.
Rhodamine B was found in lipstick at market of Manado [3,4] as well as at market of North Jakarta
[5]. Twenty-five samples of lipsticks were identified containing rhodamine B [5]. Red colorants in
cosmetics widely used in lipsticks for giving red shades colour. Red allure, ponceau SX and
carmoisine, the azo-red dyes, are the dominant red colorants founded in lipsticks [6]. Carmoisine 144
µg/g detected presence in lip gloss though it is prohibited considering the Food and Drug
Administration (FDA) of US regulation [6]. Moreover, Guerra et al [6] also found high content of
paraben, ca. > 1000 µg/g beyond the permitted level in 24 of toothpaste in Spain. Quinoline was also
detected in children toothpaste [6]. It is not allowed as food additive since toothpaste is easily
swallowed by accident for children during brushing their teeth. Liquid chromatography tandem mass
spectrometry (LC-MS/MS) was applied for identifying preservatives and synthetic dyes in cosmetics
[6].
Imported lipstick in Iran also reported contains lead beyond the allowable level, ca. 20 mg/kg [7].
Heavy metals are identified present in lipstick for such giving a dark brown colour from Cd [8]. Lead
(Pb) and Cd are heavy metals which is common presents in lipsticks.
It is reported that 38.2 µg/g of cadmium and 124.2 µg/g of lead are detected respectively in pink
and blue lipstick [9]. Lead and Cd were also reported found in low-quality cosmetics brought from an
e-commerce platform in Pinduoduo, China [2]. Ultrasound assisted extraction (UAE) was applied for
extracting the heavy metals from lipstick samples. While laser induced breakdown spectroscopy
(LIBS) was for Pb and Cd analysis. The accuracy of LIBS analysis to the Pb and Cd content then
compared to inductively coupled plasma-mass spectrometry ICP-MS [2]. High sensitivity of both Pb
and Cd were shown by the limit of detection (LOD). The LOD for Pb and Cd by LIBS were 0.028
mg/kg and 0.016 mg/kg, respectively [2]. Though, the content both of Pb and Cd is low; both heavy
metals is not allowed in presence in exported cosmetics product into Germany. Lead make the skin
smoother, lighter even shinier while Cd give tanner shade colour. Other similar results were found in
Jordan [10]. Contect of several heavy metals, i.e. Cd, chromium (Cr), copper (Cu), nickel (Ni), and Pb,
were analysed from mascara, eyeliner, eye pencils, kohl, face cream, powder, body cream, and
lipstick. The highest concentration of Pb was found in face cream, powder, body cream [10]. While Cr
was highest at mascara, lipstick. In case of lipstick and eye pencil contained Cu. Cosmetics products
from Sudan have higher heavy metals concentration than those produced by both of Jordan and Syria
[10]. It is seen that manufacturer also take a responsibility for producing clean and guarantee safe of
cosmetics by applying a good manufacturing practice in flow of the production process. In case of
local market, Arifiyana [11] identified the Pb content in both registered and unregistered brands of
lipstick at DXX market in Surabaya. Surprisingly, two from six samples of registered brands of
lipstick and four from six sample of unregistered brands did contain lead.
The consumer National Agency of Drug and Food Control (Badan Pengawas Obat dan
Makanan/BPOM) of Indonesia through BPOM regulation No. 12 of 2019 regulates the contaminations
in cosmetics including microbial and heavy metals contamination. The allowable level of lead (Pb)
and cadmium (Cd) in cosmetics are, respectively, ≤ 20 mg/kg or mg/L and ≤ 5 mg/kg or mg/L. Prior
the distribution, cosmetic products must fulfil the requirements by BPOM. A distribution permission
should be issued. Without a legal permission, meaning that the product did not meet the requirements;
it unregistered or illegally distributed.
Hence, study for identifying the safety product of unregistered products of lipstick especially focus
on red colorants and Pb and Cd content in Surabaya need to be conducted. Safety assessment of
cosmetic products need to be conducted regularly; provide assurance of safety and security of
consumers. The PXXX market is chosen as a studied area due it remarkable crowded market in East
2International Conference on Chemical and Material Engineering (ICCME 2020) IOP Publishing
IOP Conf. Series: Materials Science and Engineering 1053 (2021) 012083 doi:10.1088/1757-899X/1053/1/012083
area of Surabaya. Thin Layer Chromatography (TLC) coupled with densitometry method and
Inductively Coupled Plasma Spectrometer (ICPS), respectively, applied for both identification and
quantification of the red colorants of the lipstick and for Pb and Cd content for fulfilling the required
accuracy by BPOM,. Moreover, the validation methods of ICPS covering selectivity, linearity,
accuracy, prediction, limit of detection (LOD) and limit of quantification (LOQ) parameters were
previously conducted prior the quantitative analysis of heavy metals.
2. Experimental Section
2.1. Materials
Standard compound of allure red, rhodamine B, and amaranth in high purity grade were purchase from
Sigma Aldrich (India) while standard solutions of Cd(NO3)2 and Pb(NO3)2 of 1000.0 ppm from Merck
(Darmstadt, Germany). All solvent such methanol, ammonia, n-hexane, and ethyl acetate in p.a. grade
from Fulltime Chemical (China). Concentrated HNO3 and concentrated H2O2 in p.a. grade Merck
(Darmstadt, Germany). Whereas Silica Gel 60 F254 for qualitative analysis of colorants by thin layer
chromatography form Merck (Darmstadt, Germany). In case for filtration, quantitative filter paper ash
less grade 41 and nylon filter membrane (in 0.45 and 0.2 µm porosity) both purchased from Whatman
(Germany). Inductively Coupled Plasma Spectrometer (ICPS)-OES ICAP 6200 (Thermo scientific)
was used for analysing the heavy metals content.
Figure 1. Six lipsticks sample were studied.
2.2. Lipsticks Sample
Lipsticks sample which meet the requirements criteria were sampled and analysed. The criteria’s are
(1) it doesn’t have a distribution permission from BPOM or illegally distributed; (2) red colour of
lipstick; (3) sell in range of price of 10,000-35,000 IDR; and (4) at least sell at two different shop at
PXXX market in Surabaya. Hence, 6 illegal lipsticks with different brand (SK, RV, LN, LM, MB, and
RE) are collected from 4 cosmetic shops (Fig. 1).
2.3. Red Colorant Analysis
2.3.1. Sample preparation. The lipstick samples were separated from the package, accurately weighed
0.2 grams, and added subsequently with 2 mL of methanol in ultra-sonication bath (Sonica Ultrasonic
Cleaners 1200 S3, Soltec) until it well dissolved, ca. approximately 2-3 mins. Furthermore, a 5.0 mL
of n-hexane was added for fat extraction and vortexed. Two phases are formed, i.e. upper-hexane
phase and lower-methanol phase. The hexane phase which rich in fat is separated by pipetting the
3International Conference on Chemical and Material Engineering (ICCME 2020) IOP Publishing
IOP Conf. Series: Materials Science and Engineering 1053 (2021) 012083 doi:10.1088/1757-899X/1053/1/012083
upper phase and leaving the methanol phase. Hexane addition was repeated three times, resulting a fat-
free of methanol phase. The obtained methanol phase was filtered using a 0.45 µm membrane filter,
resulting a clear colorant extract. The filtrate was collected in 5.0 mL of volumetric flask, added
methanol up to mark level of the flask, and finally kept in a vial for further used of analysis.
2.3.2. Qualitative analysis. Qualitative analysis of red colorant was conducted by Thin Layer
Chromatography (TLC). Prior the analysis, mobile phase optimization of TLC separation was carried
out for best separating of rhodamine B (CI. No. 45170), amaranth/acid red 27 (CI. No. 16185), and red
allure/red allure AC (CI. No. 16035). Referring BPOM No. HK.03.1.23.08.11.07331 of 2011 about
analysis methods of cosmetics, six different mobile phase systems are recommended. They are:
dichloromethane as system A; a mixture of ethyl acetate-methanol–(ammonia 25%-water (3:7, v/v) =
15: 3 : 3 (w/w/w) as system B; a mixture of ethanol-water-iso-butanol-ammonia 25% = 31: 32: 40: 1
(w/w/w/w) as system C; a mixture of isopropanol-ammonia 25% = 100: 25 (w/w) as system D; a
mixture of n-butanol-ethanol-water-glacial of acetic acid = 600: 10: 20: 0.5 (w/w/w/w) as system E,
and a mixture of ethyl acetate-n-butanol-ammonia 25 % = 20: 55:25 (w/w/w) as system F. Therefore,
only six combinations of mobile phase referred by BPOM were studied as it is suggested on
HK.03.1.23.08.11.07331 of 2011. Qualitative analysis of red colorant was subsequently conducted
after the optimum mobile phase was obtained by spotting 5.0 L the sample (obtained from
subsection 2.3.1) into silica gel of TLC plate.
Quantification analysis was further conducted only for red colorants which qualitatively identified
by TLC. A calibration curve of red colorant standard should be established prior the quantification. A
wide range concentration of red colorant standard, ca. 20-80 ppm, was made by serial dilution from
1000 ppm of standard compound solution stock of red colorants.
2.4. Heavy Metals Analysis
Heavy metals analysis was conducted using Inductively Coupled Plasma Spectrometer (ICPS)-OES
ICAP 6200 (Thermo scientific).
2.4.1. Sample preparation. Lipstick sample should be destructed prior analysed into ICPS. Lipstick
samples were accurately weighed 1.5 grams, digested with 5 mL of concentrated HNO3 in beaker
glass at 80 oC during 15-30 mins. This destruction process was repeated twice. The final solution of
destruction then allowed to cool to room temperature. A 10 mL of 30% H2O2 was gradually added
until it became a clear solution at 80 oC, cooled till reached a room temperature. Afterward, a
filtration step was conducted using Whatman filter paper No. 41 and directly transferred to a 50.0 mL
of volumetric flask. A 2% HNO3 was added, reaching the marked level of volumetric flask,
homogenized, and filtered with 0.2 µm Whatman filter paper. The obtained sample solution was ready
to measure with ICPS-OES ICAP 6200.
2.4.2. Validation method of analysis.
a) Selectivity. Selectivity is expressed by selecting a wavelength of the heavy metals which give
smallest interference and best sensitivity. The wavelengths selection was based on the
interference and sensitivity data in the online library of ICPS for vendor.
b) Linearity. Linearity is shown as a linear regression curve (y = a + bx) between response (y) from
the analysis instrument and analyte concentrations (x) with linear correlation value (r) = 0.9999
[9-10].
Calibration curve both of Pb and Cd was conducted with in concentration range of 0-800 ppb.
Standard compound of Pb were 0, 30, 60, 100, 200, 400, 500, and 800 ppb; while 0, 30, 60, 100,
400, 500, 600, and 800 ppb for Cd. Standard stock solution both for Pb and Cd was made at 1000
4International Conference on Chemical and Material Engineering (ICCME 2020) IOP Publishing
IOP Conf. Series: Materials Science and Engineering 1053 (2021) 012083 doi:10.1088/1757-899X/1053/1/012083
ppm. Hence, a serial dilution using this standard stock solution is conducted to have the desired
concentration.
c) Limit of Detection (LOD) and Limit of Quantification (LOQ). The lowest concentration of
analyte which give a significant response compared to blank is accepted as limit of detection
(LOD). While limit of quantification (LOQ) is expressed as the lowest concentration of analyte
that can be determined with certain precision and accuracy of the applied analysis method. Both
LOD and LOQ were calculated as follow [12]:
⁄
(1)
⁄
(2)
While s is a standard deviation of blank and sy/x is standard deviation residual.
d) Accuracy. How close is the analysis results with the actual value, is the definition of accuracy
[13,14]. Accuracy can be determining with % recovery of analyte. Spiked method with internal
standard addition was applied in this study. Spiked sample was prepared as follows: lipstick
samples were accurately weighed 1.5 grams and placed in beaker glass of 100.0 mL. Each of
lipstick matrices, i.e. lipstick samples, was added a stock solution of standard compound in
different volume. Having, a varieties of spiked lipstick samples with different concentration of
standard compound. A digestion step was conducted by adding 10 mL of concentrated HNO3 (80
o
C) for 15-30 mins. This was repeated twice.
The final solution of allowed to cool to room temperature and gradually added 5 mL of 30%
H2O2 while it boiled, cooled till reached a room temperature. Subsequently, a filtration step was
conducted using Whatman filter paper No. 41 and directly transferred to a 100.0 mL of
volumetric flask. Add distillate water up to the marked level of volumetric flask, homogenized,
and filtered using 0.2 µm Whatman filter paper. The filtrate of sample solution was ready to
measure with ICPS-OES ICAP 6200.
The resulted intensity from ICPS then determined as total intensity. Using a linear calibration
curve from linearity, a total concentration of heavy metal either for Pb or Cd was measured.
However, it is included the heavy metal concentration which was spiked previously in the lipstick
matrices. Therefore, to know the real value of heavy metal concentration of sample; a blank
sample with similar weight of lipstick sample should be treated similarly as above and measured
it intensity. Finally, the acceptable range of % recovery value was referred to AOAC [15].
% recovery = (3)
CF = concentration of analyte resulted from analysis.
CA = real concentration of analyte.
= spiked concentration of analyte.
e) Precision. Method analysis precision indicates the degree of conformity between individual test
results when the procedure is repeatedly applied to a homogeneous sample, meaning a
repeatability or reproducibility. Precision is expressed by coefficient of variation (KV) or relative
standard deviation, where KV = SD/ẋ x100 (SD = Standard Deviation and ẋ = average level).
5International Conference on Chemical and Material Engineering (ICCME 2020) IOP Publishing
IOP Conf. Series: Materials Science and Engineering 1053 (2021) 012083 doi:10.1088/1757-899X/1053/1/012083
3. Results and Discussion
3.1. Mobile Phase Optimization for Thin Layer Chromatography (TLC) Analysis
Six different combinations of mobile phase were studied, as it is referred to
HK.03.1.23.08.11.07331 of 2011 by BPOM, for colorants identification in cosmetics by TLC
(subsection 2.3.1). The mobile phase mixture may well separate three of different red colorants, i.e.
rhodamine B, amaranth, and allure red. Combination mixture of ethyl acetate-methanol-(ammonia
25%-water (3: 7, w/w) = 15: 3: 3 (w/w/w) gave the best separation of the red colorants (Fig. 2).
Figure 2. Spot visualization for successfully
separation of rhodamine B, amaranth, and red allure
using a mixture of ethyl acetate-methanol-(ammonia
25%-water (3: 7, w/w) = 15: 3: 3 (w/w/w) as mobile
phase by Thin Layer Chromatography (TLC).
Spot of rhodamine B standard = 1, red allure standard = 2,
amaranth standard = 3, and a mixture of rhodamine B, red
allure, and amaranth standard = 4.
3.2. Qualitative Analysis of Red Colorants
A qualitative test of red colorants was carried out by thin layer chromatography (TLC) using a
mixture of ethyl acetate-methanol-(ammonia 25%-water (3: 7, w/w) = 15: 3: 3 (w/w/w) as mobile
phase; comparing the retardation value (Rf) value between standard compounds of red colorants and
sample (Fig. 2).
It is shown from TLC plate that three of lipsticks sample, i.e. SK, RV, and RE, contain rhodamine
B, a prohibited red colorant (Fig. 3 and Table 1). Hence, it should not be distributed and sell. None of
the lipsticks sample contain amaranth and five samples, i.e. SK, LN, LM, MB, and RE, contain red
allure as its red colorant. Both amaranth and red allure are permitted to use in all types of cosmetic
[16].
Furthermore, quantification of red allure contained in the lipsticks sample was conducted using
TLC-densitometer at = 474 nm. A calibration curve should be established prior the quantification. A
serial concentrations of red allure standard, i.e. 20, 30, 40, 50, 60, and 80 ppm, was applied giving a
linier calibration curve of y = 1570.79 + 75.22x (r = 0.98). Considering the correlation value (r) <
0.999, the relative process standard deviation value (Vxo) should be calculated [12]. Assuring that the
6International Conference on Chemical and Material Engineering (ICCME 2020) IOP Publishing
IOP Conf. Series: Materials Science and Engineering 1053 (2021) 012083 doi:10.1088/1757-899X/1053/1/012083
linear correlation between response area (y) and red allure concentration (x) is truly achieved [9].
Those, giving Vxo = 4.51% below 5%, the acceptable accuracy test. Lipsticks sample of SK, LN, LM,
MB, and RE contain 187.88, 132.85, 75.52, 34.19, and 104.71 mg/kg of red allure, respectively.
Figure 3. Spot visualization of lipsticks sample by
TLC separation (right).
Spot of rhodamine B standard = 1, amaranth standard =
2, red allure standard = 3, lipstick sample SK = 4,
lipstick sample RV = 5, lipstick sample LN = 6, lipstick
sample LM = 7, lipstick sample MB = 8, and lipstick
sample RE = 9.
Table 1. Qualitative analysis of red colorants in red lipstick samples.
Sample code Red Colorants
(Fig.3 code) Rhodamine B Red Allure Amaranth
SK (4) + + -
RV (5) + - -
LN (6) - + -
LM (7) - + -
MB (8) - + -
RE (9) + + -
3.3. Validation of Heavy Metals Analysis
A validation method of heavy metals analysis of lead (Pb) and cadmium (Cd) in lipsticks matrices
sample using Inductively Coupled Plasma Spectrometer (ICPS) was previously conducted.
3.3.1. Selectivity. Considering the highest sensitivity and smallest interference, Pb metal was analysed
at 220.353 nm while CD at 228.802 nm.
3.3.2. Linearity. Calibration curve both of Pb and Cd was conducted with in concentration range of 0-
800 ppb (Fig. 4). Standard compound of Pb were 0, 30, 60, 100, 200, 400, 500, and 800 ppb; while 0,
30, 60, 100, 400, 500, 600, and 800 ppb for Cd. Giving y = 0.19x – 0.96 (r = 0.9995) and y = 2.47x –
38.72 (r = 0.9996), respectively, for Pb and Cd. Both heavy metals have linear correlation between its
response of intensity (y) and concentration (x).
7International Conference on Chemical and Material Engineering (ICCME 2020) IOP Publishing
IOP Conf. Series: Materials Science and Engineering 1053 (2021) 012083 doi:10.1088/1757-899X/1053/1/012083
Figure 4. Calibration curve both of Pb (A) and Cd (B) using Inductively Coupled Plasma
Spectrometer (ICPS).
3.3.3. Limit of Detection (LOD) and Limit of Quantification (LOQ). Following the calculation of
Yuwono and Indrayato [9], the LOD and LOQ both of Pb and Cd are shown at Table 2.
Table 2. LOD and LOQ of both Pb and Cd (range concentration of 0-800 ppb) analysed by
Inductively Coupled Plasma Spectrometer (ICPS)-OES ICAP 6200.
Heavy metals LOD (ppb) LOQ (ppb)
Lead (Pb) 39.88 109.99
Cadmium (Cd) 59.44 125.11
3.3.4. Accuracy. Accuracy of both heavy metals are expressed as % recovery (Table 4) and calculated
using equation (3). Spiked method with internal standard addition was applied in this study. Lipsticks
sample was used as matrices in this study due to a difficulty finding an artificial matrix for mimicking
the real matrices. Therefore, a correlation between weight of lipstick sample/matrices concentration
and ICPS intensity should be initially performed (Table 3 and 4). Furthermore, the intensity of heavy
metals in blank matrices was calculated using the correlation shown at Table 3 and 4.
Table 3. Correlation between weight of lipstick (g) and intensity of Cd.
Weight of lipstick Matrices concentration
Intensity*
(g) (ppb)
1.5067 1.1068 16.09
1.5071 1.4426 16.23
1.5076 1.1849 16.38
*intensity was read from ICPS analysis result
Table 4. Correlation between weight of lipstick (g) and intensity of Pb.
Weight of lipstick Matrices concentration
Intensity*
(g) (ppb)
1.5067 1.6016 13.11
1.5071 1.6367 13.29
8International Conference on Chemical and Material Engineering (ICCME 2020) IOP Publishing
IOP Conf. Series: Materials Science and Engineering 1053 (2021) 012083 doi:10.1088/1757-899X/1053/1/012083
1.5076 1.6408 13.33
*intensity was read from ICPS analysis result
Table 5. Percentage recovery of lead (Pb).
Added
Weight of
concentration of Total Total Matrices
lipstick %
standard intensity* concentration concentration
matrices recovery
compound (ppb) (ppb)
(g)
(ppb)
1.5073 79.37 411.04 13.29 99.44%
400 1.5071 79.51 411.14 13.29 99.46%
1.5073 79.56 411.75 13.29 99.62%
1.5072 97.56 504.11 13.29 98.16%
500 1.5070 98.25 504.11 13.29 98.89%
1.5073 92.72 504.11 13.29 98.33%
1.5071 156.30 804.67 13.29 98.92%
800 1.5073 157.16 809.07 13.29 99.47%
1.5070 156.83 807.38 13.29 99.26%
*Total intensity = concentration of standard in matrices + added concentration of standard compound
The % recovery required is in range of 80-110% due the analyte levels of 0.0001% [15]. Hence, the
accuracy of lead meets the requirements. A similar protocol for having cadmium accuracy was
conducted; gave a 97.12-98.84 % recovery of cadmium. An accuracy requirements level of cadmium
is also fulfilled.
3.3.5. Precision. Using the % recovery obtained in the accuracy for each concentration of spiked
heavy metals, a variance coefficient (KV) was calculated (Table 6). Giving the overall variance
coefficient (KV) is 0.44% of lead; meet the requirement KV level is 11%. While the overall variance
coefficient (KV) is 0.50% of cadmium. Hence, the developed method analysis both for Pb and Cd by
ICPS is precise.
Consequently, a quantitative analysis of Pb and Cd by ICPS was conducted on six lipsticks sample,
i.e. SK, RV, LN, LM, MB, and RE. Fortunately, none of them contain either Pb or Cd.
4. Conclusion
Three different red colorants, i.e. rhodamine B, red allure, and amaranth, in lipstick was
successfully well separated by Thin Layer Chromatography (TLC) using a mixture of ethyl acetate-
methanol-(ammonia 25%-water (3: 7, w/w) = 15: 3: 3 (w/w/w) as mobile phase. Moreover, a
development method to analyse lead (Pb) and cadmium (Cd) with spiked method of internal standard
addition using Inductively Coupled Plasma Spectrometer (ICPS) was meet all the required
requirements of validation. Pb was selectively analysed at 220.353 nm 228.802 nm for Cd. It gave a
great linear correlation (r = 0.9995-0.9996), a good range of accuracy ca. 98.92-99.44% and 97.12-
98.84% recovery respectively for Pb and Cd as well as it precision. Which shown by variance
coefficient (KV) is 0.44% and 0.50%, respectively, for Pb and Cd.
Quantitative analysis of six lipsticks (SK, RV, LN, LM, MB, and RE) sampled in PXXX market in
Surabaya shown that none of illegal brand of lipsticks contains amaranths, five lipsticks (SK, LN, LM,
MB, and RE) contain red allure, and three lipsticks (SK, RV, and RE) contain a prohibited red
9International Conference on Chemical and Material Engineering (ICCME 2020) IOP Publishing
IOP Conf. Series: Materials Science and Engineering 1053 (2021) 012083 doi:10.1088/1757-899X/1053/1/012083
colorant, rhodamine B. Hence, should be attracted from market and not distributed. Moreover, none of
them contain Pb and Cd.
References
[1] BPOM. 2015. Regulation of the Head of the Food and Drug Administration of the Republic
Indonesia No. 18/201, No. HK.031.1.23.08.11.07517 concerning Technical Requirements
for Cosmetics Materials. Jakarta: BPOM
[2] Liu Y, Chu Y, hu Z, Zhang S, Ma S, Khan M S, Chen F, Zhang D, Guo L and Lau C 2020 J.
Microc 158 105322
[3] Tangka J, Pojoh J A and Hasan H A M 2012 JIF 3 70
[4] Mamoto L V, Fatimawali and Citraningtyas G 2013 Pharmacon JIF 2 61
[5] Jusnita N 2016 Ind. Nat. Res. Pharmaceutical J. 1 1
[6] Guerra E, Alvarez-Rivera G, Llompart M and Garcia-Jares C 2018 Talanta 188 251
[7] Ziarati P, Moghimi S, Arbabi-Bidgoli S and Qomi M 2012 Int. J. Chem. Eng. App. 3 6
[8] Khalid A, Bukhari I H, Riaz M, Rehman G, Munir S, Bokhari T H, Rasool N, Zubair M and Qu
A 2013 IJBPAS 2 5
[9] Ayodele O E, and Auremi O I 2014 Int. J. Pharma. Res. Allied Sci. 3 45
[10] Massadeh A M, El-khateeb M Y and Ibrahim S M 2017 J. Puhe 149 130
[11] Arifiyana D 2018 J. Pharma. Sci. 3 1
[12] Yuwono M and Indrayanto G 2005 Excipients Rel. Method. 32 243
[13] UNDOC 2009
[14] USP 40 2017
[15] AOAC, 2016, Official Methods of Analysis 2016, Guidelines for Standard Method Performance
Recruitment, Appendix F, 9.
[16] BPOM. 2014. Regulation of the Head of the Food and Drug Administration of the Republic
Indonesia No. 17/ 2014 on Amendments to the Regulation of the Head of the Food and Drug
Administration No. HK.03.1.23.07.11.6662, 2011 concerning Requirements for Microbial and
Heavy Metal Contamination in Cosmetics. Jakarta: BPOM.
10You can also read