Analysis of scientists work directions based on natural language processing and clustering - CEUR-WS.org
←
→
Page content transcription
If your browser does not render page correctly, please read the page content below
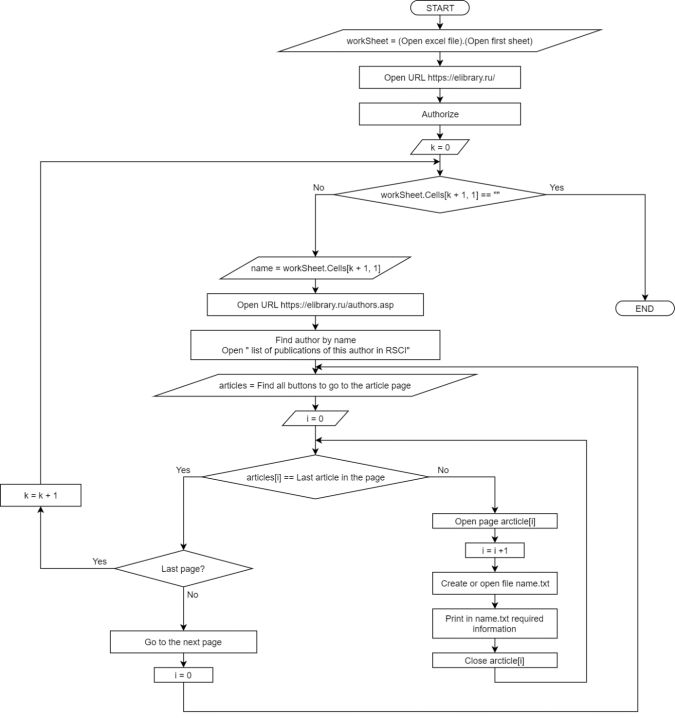
Analysis of scientists work directions based on
 natural language processing and clustering
 Vadim Zinnatullin Sergey Koledin
 Ufa State Petroleum Technological University Ufa State Petroleum Technological University
 Ufa, Russia Ufa, Russia
 zinnatullin.vadim2001@yandex.ru koledinsrg@gmail.com

 Abstract—The paper analyzes scientific activities of cloud [8], but instead of counting words it displays data such
 university professors based on open sources. Two directions as population or stock market prices.
 are proposed: a visual analysis of the processing of natural
 language texts (wordcloud) and codification of scientific work A text cloud or word cloud is a visualization of the
 in directions (UDC). The task of classifying big data allows frequency of words in a given text as a form of a weighted
 expanding the capabilities of visual analysis. list [9]. This method has recently been widely used to
 visualize the thematic content of political speeches [10]. The
 Keywords—word cloud, analysis of scientific articles, parser, word cloud has also found its application in pedagogy for
 clustering task visualization and consolidation of material [11].
 I. INTRODUCTION This work is devoted to the analysis of the scientific work
 of the staff of the Department of Mathematics and History of
 The paradigm of the modern education system is the
 a Technical University (Ufa State Petroleum Technical
 transition from the “Soviet” to the “Bologna” structure of the
 University). As the data, open sources presented in the e-
 educational process organization. The importance is given to library [12] will be used. Based on the received textual data,
 the scientific activity of scientific and pedagogical workers visualization (wordcloud) and a comparative analysis of
 of universities. Over the past few years, increased scientific interests take place.
 requirements for the quality of writing articles by teachers of
 the university. As a result, a large array of articles appeared, The analysis was taken four teachers of the same faculty.
 which is difficult to structure, analyze, and organize a joint For each of them, a word cloud is constructed for all of their
 scientific activity. In departments where there are many articles (article title, keywords, abstract). These data are
 employees, often scientific and pedagogical workers do not taken from the open-source elibrary.ru. Manually collecting
 know what kind of scientific activity their colleagues all the data takes considerable time. To reduce the time spent,
 conduct. a program has been created that automates the routine work
 of collecting and presenting the information.
 In this paper, it is proposed to develop an algorithm for
 representing the general direction of the scientific and
 pedagogical worker based on visual analysis. Next, to carry
 out the task of classifying the scientific interests of workers
 in selected directions for the organization of joint scientific
 activity.
 II. VISUAL ANALYSIS OF SCIENTIFIC WORKS BASED ON
 "WORDCLOUD"
 In the language of visual design, a tag cloud (or word
 cloud) is a type of “weighted list”; it is usually used on
 geographical maps to display the relative size of cities using
 font size [1, 2]. One of the first examples of a weighted list
 of English keywords is the list of “subconscious computer Fig. 1. User interface eLibraryparser.
 files” in Douglas Copeland's novel «Microsoft Slaves»
 (1995). A list of German words appeared in 1992 [3]. A word The ELibraryparser user interface is shown in figure 1.
 cloud (tag cloud, or a weighted list presented visually) is a The figure following the interface are indicated:
 visual representation of a list of categories (or tags, also
 1. File selection button (Excel files|*.xlsx*). –
 called tags, labels, keywords, etc.). “Tags” are usually
 Program input data. Table with full name on which
 separate words, and the importance of each tag is shown in
 employees need to collect data;
 font size or color [4].
 2. Directory selection button. - The program output
 The first tag clouds on well-known websites appeared on
 (files *.txt);
 the website of the Flickr digital photo storage and
 distribution service [5]. Around the same time, the 3. Button "Start" - when pressed, the program starts
 distribution of the tag cloud was facilitated by the sites work;
 Delicious and Technorati [6]. The oversaturation of the tag
 cloud method and the ambivalence of its usefulness as a web 4. Dialog box - used as a console.
 navigation tool have led to a marked decrease in usage The eLibraryparser program is developed in C # [13].
 among these early followers. The following libraries were used:
 A data cloud is a data display that uses font size and/or - A set of libraries Selenium WebDriver. Selenium
 color to indicate numerical values [7], it looks like a tag WebDriver - a tool for automating the actions of a web

Copyright © 2020 for this paper by its authors.
Use permitted under Creative Commons License Attribution 4.0 International (CC BY 4.0)
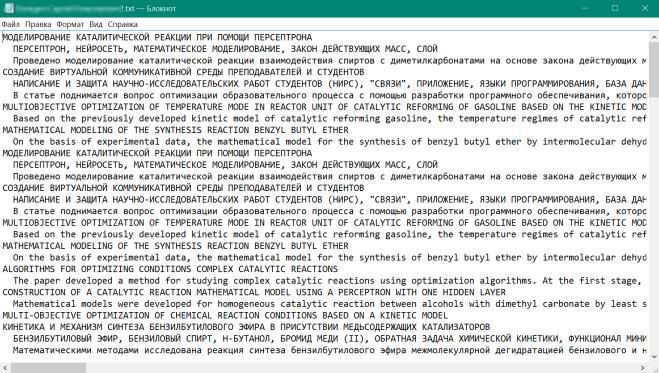
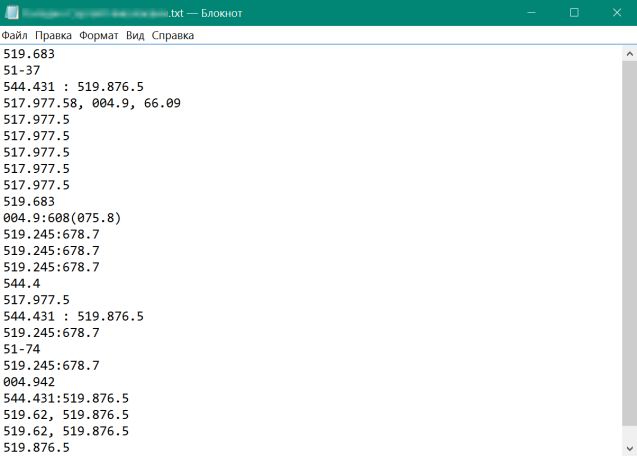
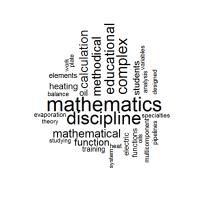
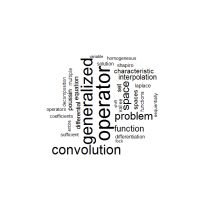
Data Science

browser. It was used to administer the site and obtain data programming language for statistical data processing and
from the investigated source. graphics. [14, 15]. To create a word cloud, use the wordcloud
 library. Word clouds by employees are shown in figure 4.
 - Microsoft excel object library – used to work with excel
tables.
 The block diagram of the eLibraryparser algorithm is
shown in figure 2. The algorithm step by step processes each
name that came from INPUT. For each author, the algorithm
finds and opens pages with the description of the article and
copies the information (UDC / title, keywords, abstract) to
OUTPUT (a separate .txt file for each name).

 a) b)

 c) d)
 Fig. 4. "Wordcloud" by employees: a) employee 1 (department of
 mathematics); b) employee 2 (department of mathematics); c) employee 3
 (department of mathematics); d) employee 4 (department of history).

 Results of visual presentation (wordcloud) can analyze
 the research and teaching staff. The font-size determines the
 frequency of use of a particular word (tag). For employees 1,
 for example, it can be concluded that he is engaged in
 mathematical modeling of chemical reactions and conditions
 for carrying out a chemical experiment. The employee works
 at the department of mathematics, not chemistry. But with an
 additional study of other sources, it becomes known that the
Fig. 2. ELibraryparser algorithm block diagram. teacher is a candidate of physical and mathematical sciences
 in the specialty 02.00.04 - Physical chemistry. The big
 As a result of the program’s work, a .txt format file is advantage of analysis based on "wordcloud" is that there is
created containing an array of annotation words, titles, and no need to research the specialty (often there is no
article tags of this author (figure 3). Further, the possibility), sciences, departments. Visual analysis reveals
normalization of words occurs: nouns are translated into the these patterns. With similar scientific activities employees
nominative case, verbs into the infinitive. The necessary can collaborate, to participate in joint grants, writing articles,
encoding is selected for the correct operation in RStudio. and more.
 Employee 3 also works in the department of
 mathematics. The visual analysis says that the sphere of
 interest of a scientific and pedagogical worker is an
 electronic distance format in education. The organization of
 joint scientific activity between the first, second and
 employee number 3 is unlikely. But if necessary, you can
 contact this employee for the necessary advice on organizing
 a remote format for providing data (creating MOOC,
 conducting webinars, etc.). Employee 4 is a history teacher,
 as confirmed by his wordcloud. His direction of interest is
 history. At first identified the employeу with similar
 interests. If it is necessary conducted additional research on
 the place of work, thesis and other merits of the object.
Fig. 3. Example of the received file for the teacher from department of
mathematics (employee 1). With all the advantages of visual analysis of the sphere
 of interests based on the wordcloud, it is not necessary to
 Based on data from eLibraryparser, a word cloud is study all the scientific works of the object of study (most
formed. To create a word cloud, the RStudio program was have limited access to reading), the absence of informal
used [14]. RStudio is a free open source software connections, etc. With a significant increase in the number
development environment for the R programming language, of research objects, for example, a university, where
which is designed for statistical data processing and employees are located geographically far from each other
graphics. In this environment, the R code was written. R is a

VI International Conference on "Information Technology and Nanotechnology" (ITNT-2020) 58
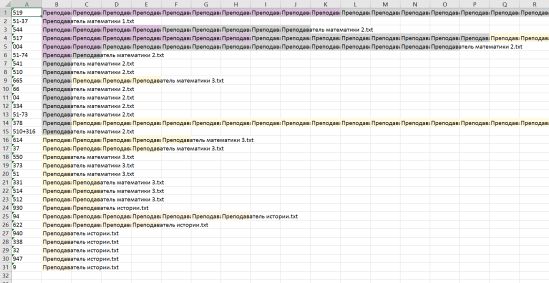
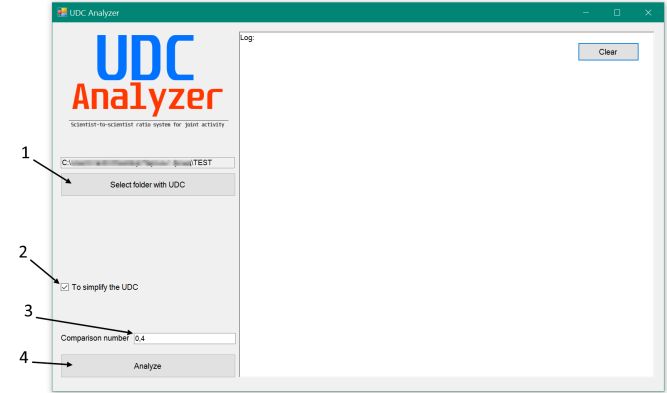
Data Science

(branches in different cities), where there are a significant As a result of the program, tables are formed showing the
number of scientific and pedagogical workers, it is not relationship between UDC (up to the first character) and
possible to conduct this analysis. You need to analyze teachers (figure 7).
hundreds and thousands of wordclouds to find the right
employee. Here it is necessary to connect the "bigdata"
toolkit [16]. Classification and data clustering operations are
required [17, 18].
 III. THE TASK OF CLASSIFYING SCIENTIFIC INTERESTS
 The classification problem [19] of scientific interests is
implemented on the basis of the universal decimal
classification (UDC) [20]. UDC data was also obtained from
the open-source eLibrary after some refinement of the
eLibraryparser program. Teachers will be compared based
on the UDC of their scientific work. Fig. 7. Grouping UDC-teacher.
 In figure 5 shows an example of the data obtained. The
data are presented in the form of a .txt file with all the UDC The further diagram was constructed for the comparative
of this scientist. analysis based on the tables. The diagram is shown in figure
 8.

 Fig. 8. Conformity diagram of UDC and teachers: Black line –
 mathematics teacher 1, grey line – mathematics teacher 2, line with dashes
 – mathematics teacher 3, White line – history teacher.

Fig. 5. Presentation of the research activities of an employee 1 by UDC. The figure shows that "Teacher of Mathematics 1",
 "Teacher of Mathematics 2", "Teacher of Mathematics 3"
 To solve the classification problem, a program was have common UDC. A hypothesis is put forward about the
written. The program interface is shown in figure 6. possible joint activities of these three teachers. Next, you
 The following sections of the interface are presented: need to analyze wordcloud (figure 4). The combination of
 analysis based on UDC and visual wordcloud suggests that
 1. Button to select a directory in which all files from the the joint work of “Teacher of Mathematics 1” and “Teacher
UDC of scientists that need to be classified are stored. of Mathematics 2” is highly probable, and involving
 2. When this button is pressed, the program will create a “Teacher of Mathematics 3” in this work is impractical.
table of the first form: First row of the full name column, the Also, the “Teacher of History” is isolated from the rest and
next lines of its UDC. visual analysis is not required.
 3. When this button is pressed, the program will create a IV. CLASTER TASK
table of the second type. To fully automate the process of finding teachers with
 4. The first column is all the UDC of all scientists. common interests, it was decided to develop special
Further in the corresponding line of the corresponding UDC. software. The program code is written in C #, the interface is
 made using Windows Forms. Third-party libraries were not
 used. The user interface is shown in Figure 9.

Fig. 6. UDCA program interface (UDC Analyzer). Fig. 9. User interface.

VI International Conference on "Information Technology and Nanotechnology" (ITNT-2020) 59
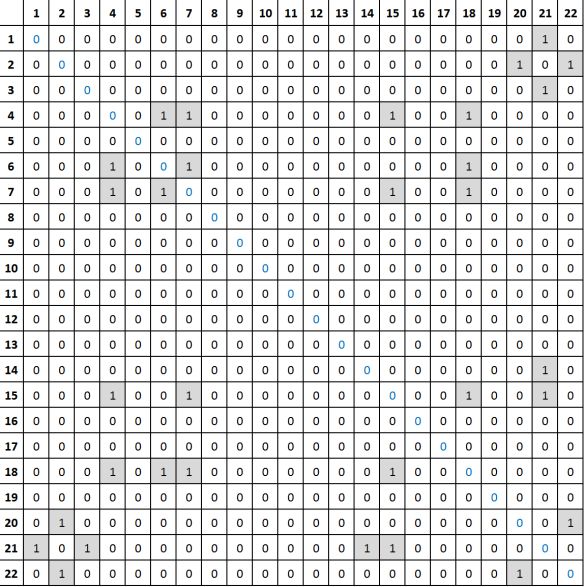
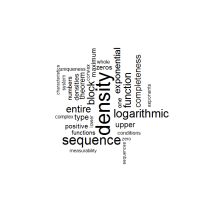
Data Science

 The main elements of the program: 1) Button for A total of 241 people were analyzed. The analyzer
selecting a folder with all UDC. 2) A switch to simplify the generated 18 clusters. For example, cluster 12 (Scientist1,
UDC. 3) Threshold value. The larger it is, the stricter the Scientist2, Scientist3, Scientist4, Scientist5.) shows:
program will select teachers. 4) Run the start button. After
execution, the program displays the result in this format
(Figure 10).

Fig. 10. Cluster Distribution.

 The program gives out several groups. Each group has
several scientists who, in theory, can organize joint scientific
activities.
 Program Algorithm:
 Step 1. The algorithm creates a table (Figure 11), based
on the data received using the parser. The numbers in the
cells can take a value from 0 to 1. These numbers mean the
percentage of the number of articles by the author for this
UDC. Numbers are found by the formula (1): Fig. 12. Matrix Research interests.

 ℎ
 = (1) The names of scientists are replaced by numbers. To
 verify the correctness of the data, the word clouds of these
 Scientist 1 Scientist 2 … Scientist n teachers were built (Figure 13).
 UDC 1 0 0.1 … 0
 UDC 2 0.1 0 … 0
 UDC 3 0 0 … 0
 UDC 4 0.4 0.2 … 0
 UDC 5 0 0 … 0
 UDC 6 0.2 0 … 0.4
 UDC 7 0.3 0.5 … 0.3
 UDC 8 0 0.2 … 0.3
 … … … … …
 UDC m 0 0 … 0
Fig. 11. Distribution of teachers by UDC.

 Step 2. Couples of teachers with common interests are
identified. For this, each pair of teachers determines the
indicator a by the formula (2): Fig. 13. Cluster word cloud 12.

 = ∑
 =1 ̇ ∗ ̈ (2) When analyzing these word clouds, it is clear that each
 of these teachers is associated with mathematics. The results
 Points above the letters indicate a variable belonging to a of the analyzer are correct because these people have
particular scientist. Next, the obtained value is compared common interests.
with a threshold value, if the value obtained is more, teachers
have common interests. V. CONCLUSION
 Step 3. Create a table in which the width and height are The paper analyzes the scientific activities of university
equal to the number of all scientists considered. A smaller professors based on open sources. Two directions for
version of such a table is shown in Figure 12. analysis are proposed: based on visual analysis of the
 processing of natural language texts (wordcloud) and based
 Numbers arranged in row and column headers mean
 on the codification of scientific work in directions (UDC).
number teacher. Table cells can take only two values: 0 and
 With the further accumulation of the database of teachers,
1. The unit means that there is a common interest between
 visual analysis is insufficient. It is necessary to solve the
the pair of scientists. Zero means that there is no interest.
 problem of classifying big data. This methodology and
 Step 4. The work of the last step is best demonstrated software products will allow the grouping of scientific and
with a specific example. We will consider the table in Figure pedagogical workers to perform various tasks: joint grants,
4. The scientist at number 4 has common interests with articles, scientific research, solving practical problems,
scientists 6 and 7. In turn, teachers 6 and 7 also have common identifying experts in specific areas. In the case of the
interests. These three scientists can be combined into one addition of foreign scientists (with the appropriate
cluster. Similarly, the algorithm processes the entire table. codification of works, for example Lonclass), international
And gives out several clusters. cooperation is possible.

VI International Conference on "Information Technology and Nanotechnology" (ITNT-2020) 60
Data Science

 ACKNOWLEDGMENT [10] C. Felix, S. Franconeri and E. Bertini, “Taking word clouds apart:
 An empirical investigation of the design space for keyword
 This research was performed RFBR according to the summaries,” IEEE Transactions on Visualization and Computer
research project № 18-07-00341. Graphics, vol. 24, no. 1, pp. 657-666, 2018.
 [11] D. Helic, C. Trattner, M. Strohmaier and K. Andrews, “Are tag
 REFERENCES clouds useful for navigation? A network-theoretic analysis,”
[1] M. Halvey and M. Keane, “Exploring social dynamics in online International Journal of Social Computing and Cyber-Physical
 media sharing,” Proceedings of the WWW Conference, Alberta, Systems, vol. 1, no. 1, pp. 33-55, 2011.
 Canada, 2007, 988 p. [12] [Online]. URL: https://elibrary.ru/.
[2] [Online]. URL: https://www.google.ru/maps. [13] J. Skeet, “C # for professionals: the intricacies of programming,”
[3] M. Galyavieva, “Use of the word cloud for visualizing bibliometric M.: Williams, 2014.
 data,” Scientific notes of HMIS, vol. 15, no. 1, pp. 150-154, 2017. [14] P. Mark and J. Edwin, “Learning RStudio for R Statistical
[4] M. Dubinko, R. Kumar, J. Magnani, J. Novak, P. Raghavan and A. Computing,” Packt Publishing, 2012.
 Tomkins, “Visualizing tags over time,” Proceedings of the WWW [15] J. Verzani, “Getting Started with Rstudio,” O'Reilly Media, 2011.
 Conference, Edinburgh, Scotland, 2006, 576 p.
 [16] M. Chen, Sh. Mao, Y. Zhang and V.C.M. Leung, “Big Data. Related
[5] [Online]. URL: https://www.flickr.com. Technologies,” Challenges, and Future Prospects, Spinger, 2014.
[6] [Online]. URL: http://technorati.com. [17] I.A. Ricarev, D.V. Cirsh and A.V. Cupriyaniv, “Clustering media
[7] M. Burch, S. Lohmann, D. Pompe and D. Weiskopf, “Prefix tag content from social networks using bigdata technology,” Computer
 clouds,” Proceedings of the 17th International Conference on Optics, vol. 42, no. 5, pp. 921-927, 2018. DOI: 10.18287/2412-
 Information Visualisation, IEEE, pp. 45-50, 2013. 6179-2018-42-5-921-927.
[8] B. Lee, N. Riche, A. Karlson and S. Carpendale, “Sparkclouds: [18] C.S. Sarin and I.A. Hodashinscii, “Bugging method and feature
 Visualizing trends in tag clouds,” IEEE Transactions on selection in the construction of fuzzy classifiers for handwritten
 Visualization and Computer Graphics, vol. 16, no. 6, pp. 1182-1189, signature recognition,” Computer Optics, vol. 43, no. 5, pp. 833-
 2010. 845, 2019. DOI: 10.18287/2412-6179-2019-43-5-833-845.
[9] J. Marszałkowski, D. Mokwa, M. Drozdowski, L. Rusiecki and H. [19] B. Lantz, “Machine Learning,” R. Pack Publishing: Birmongham-
 Narożny, “Fast algorithms for online construction of web tag Mumbai, 2013.
 clouds,” Engineering Applications of Artificial Intelligence, vol. 64, [20] [Online]. URL: https://www.teacode.com/online/udc.
 pp. 378-390, 2017.

VI International Conference on "Information Technology and Nanotechnology" (ITNT-2020) 61

You can also read