Analysis of Trends in Drought with the Non-Parametric Approach in Vietnam: A Case Study in Ninh Thuan Province
←
→
Page content transcription
If your browser does not render page correctly, please read the page content below
American Journal of Climate Change, 2021, 10, 51-84
                                                                                               https://www.scirp.org/journal/ajcc
                                                                                                           ISSN Online: 2167-9509
                                                                                                             ISSN Print: 2167-9495

Analysis of Trends in Drought with the
Non-Parametric Approach in Vietnam:
A Case Study in Ninh Thuan Province

Nguyen Hoang Tuan*, Truong Thanh Canh

University of Science, VNU.HCM, Ho Chi Minh City, Vietnam

How to cite this paper: Tuan, N. H., &        Abstract
Canh, T. T. (2021). Analysis of Trends in
Drought with the Non-Parametric Ap-           A quantitative study was used in the study of the tendency to change drought
proach in Vietnam: A Case Study in Ninh       indicators in Vietnam through the Ninh Thuan province case study. The re-
Thuan Province. American Journal of Cli-
                                              search data are temperature and precipitation data of 11 stations from 1986 to
mate Change, 10, 51-84.
https://doi.org/10.4236/ajcc.2021.101004
                                              2016 inside and outside Ninh Thuan province. To do the research, the author
                                              uses a non-parametric analysis method and the drought index calculation
Received: November 9, 2020                    method. Specifically, with the non-parametric method, the author uses the
Accepted: March 22, 2021
                                              analysis, Mann-Kendall (MK) and Theil-Sen (Sen’s slope), and to analyze
Published: March 25, 2021
                                              drought, the author uses the Standardized Precipitation Index (SPI) and the
Copyright © 2021 by author(s) and             Moisture Index (MI). Two Softwares calculated in this study are ProUCL 5.1
Scientific Research Publishing Inc.           and MAKENSEN 1.0 by the US Environmental Protection Agency and Fin-
This work is licensed under the Creative
                                              nish Meteorological Institute. The calculation results show that meteorologi-
Commons Attribution International
License (CC BY 4.0).
                                              cal drought will decrease in the future with areas such as Phan Rang, Song
http://creativecommons.org/licenses/by/4.0/   Pha, Quan The, Ba Thap tend to increase very clearly, while Tam My and Nhi
               Open Access                    Ha tend to increase very clearly short. With the agricultural drought, the av-
                                              erage MI results increased 0.013 per year, of which Song Pha station tended
                                              to increase the highest with 0.03 per year and lower with Nhi Ha with 0.001
                                              per year. The forecast results also show that by the end of the 21st century,
                                              the SPI tends to decrease with SPI 1 being −0.68, SPI 3 being −0.40, SPI 6 be-
                                              ing −0.25, SPI 12 is 0.42. Along with that is the forecast that the MI index will
                                              increase 0.013 per year to 2035, the MI index is 0.93, in 2050 it is 1.13, in 2075
                                              it will be 1.46, and by 2100 it is 1.79. Research results will be used in policy-
                                              making, environmental resources management agencies, and researchers to
                                              develop and study solutions to adapt and mitigate drought in the context of
                                              variable climate change.

                                              Keywords
                                              Drought, Mann-Kendall, Sen’s Slope, Non-Parametric

DOI: 10.4236/ajcc.2021.101004       Mar. 25, 2021                51                           American Journal of Climate Change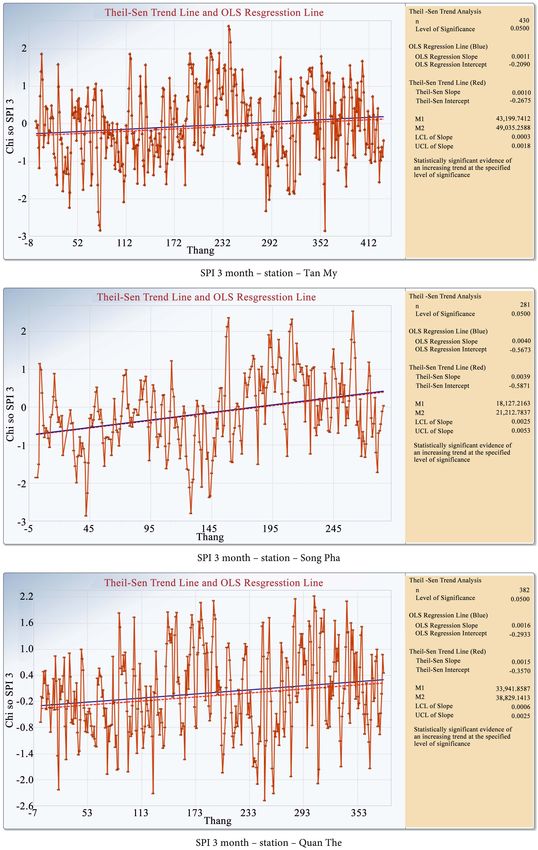
N. H. Tuan, T. T. Canh

                                1. Introduction
                                Drought can be considered an expensive natural disaster in the world (Esfaha-
                                nian et al., 2017); this is an uncontrollable extreme phenomenon (Correia, 2007),
                                it affects regions and the Earth (Blain, 2012; Ding et al., 2010; Svoboda et al.,
                                2015). Studies also show that drought impacts politics, as it can affect and spread
                                over a region of countries in the world (UN Water, 2015b). During the current
                                period, in the face of climate change, drought is one of the dangerous natural
                                disasters appearing more and more in the world (Lake, 2011), without a fixed
                                boundary (UN Water, 2015a), and an escalating phenomenon to the dangerous
                                level of nature (Gillette, 1950; Govorushko, 2012; Prud’Homme, 2011; UN
                                Water, 2015a; WMO, 2014), and varies with each other region (Bordi & Sutera,
                                2007; Brewer & Heim Jr., 2011).
                                   Droughts have a significant impact on economic, social, and environmental
                                activities around the world (Ding et al., 2010; Lake, 2011; Wilhite & Glantz,
                                1987), whose direct and indirect impacts continued (Jenkins, 2011; Jeyaseelan,
                                2003), drought affects livelihoods, food security, and environmental quality
                                (Bordi & Sutera, 2007; GSA, 2006; Jenkins, 2011; Tadesse et al., 2008; Tannehill,
                                1947; UN Water, 2015b; UNDP, 2012; UNESCO, 2014; UNISDR, 2009; WMO,
                                2014). In fact, between 1970 and 2000, the rate of drought increased to 30% glo-
                                bally (Dai et al., 2004), causing significant damage to the world economy on
                                1960, drought caused up to $40 billion; in the 1980s, it reached $120 billion
                                (Domeisen, 1995). According to statistics, today on Earth, 40% - 45% of the area
                                is drought, where one-third of the population lives globally (Govorushko, 2012),
                                African countries, India, North America, China, Russia (former the Soviet Un-
                                ion), Australia, and Western Europe are strongly affected by drought and are
                                continually affected (Wilhite & Glantz, 1987). In Australia, the rate of drought
                                increased by 20% annually during 1993-2006 and severely affected the country
                                (Henry et al., 2007). Research history shows that the losses amounted to $3 bil-
                                lion (Abares, 2012). In Africa, drought directly affects food security and com-
                                modity prices of countries (AghaKouchak, 2014); it accounts for 20% of
                                all-natural disasters (CRED, 2006); for example, drought killed one million
                                people among $8 million, affected and caused the loss of 90% livestock (Allaby et
                                al., 2003). In European countries, the total economic loss over 30 years for the
                                EU countries is at least €100 billion (Correia, 2007). In agricultural production,
                                drought has made productivity, food output decreased and affected livelihoods;
                                in Spain, grain production decreased by 42%, losing nearly €8 billion (Correia,
                                2007). The United States caused a loss of over 12 billion USD (AghaKouchak,
                                2014); in California, the agricultural value fell to $50.3 billion in 2013 (Cooley et
                                al., 2015), with more than 17,000 unemployed people (Koba, 2014), estimated
                                average annual damage is $6 - $8 billion (Wilhite, 2000). In the United States,
                                drought is considered a recurring natural disaster (Herweijer et al., 2007).

                                2. The Study Area
                                Ninh Thuan (11˚33'56''N & 108˚59'25''E) is a coastal province in the South Cen-

DOI: 10.4236/ajcc.2021.101004                         52                          American Journal of Climate Change
N. H. Tuan, T. T. Canh

                                tral Coast of Vietnam. The North borders Khanh Hoa province, the South bor-
                                ders Binh Thuan province, the Western borders Lam Dong, and the eastern
                                border with the East Sea (Figure 1).
                                   Ninh Thuan a province in a tropical monsoon climate area; there is a tropical
                                savanna climate in Phan Rang with the features of drought, hot weather, much
                                wind, and rapid evaporation (Thao et al., 2018). Ninh Thuan is one of the prov-
                                inces most affected by drought in Vietnam (Ngo Dinh Tuan & Ngo Le An, 2016;
                                Nguyễn Đinh Tuấn et al., 2012) and this is also a region at risk of desertification
                                and severe land resource degradation in Viet Nam (Ngo Dinh Tuan & Ngo Le
                                An, 2016; Nguyễn Hồng Trường, 2008). Ninh Thuan is a province with quite
                                severe hydro-meteorological conditions, the average rainfall for many years in
                                Ninh Thuan is all achieved about 750 mm per year, with very high hours of
                                sunshine of about 2700 - 2800 hours per year, the results of the Gausen index in
                                Phan Rang Kx = 250 show that this is a heavy dry area (Nguyễn Đình Vượng &
                                Huỳnh Ngọc Tuyên, 2012). The density of rivers in Ninh Thuan is relatively low,
                                from 0.1 to 0.2 km per km2; rivers are often short and steep (Nguyễn Hồng
                                Trường, 2008). There were many severe droughts in 1988, 1993, 1998, 2001,
                                2002, 2004, 2005, causing significant damage to the agricultural sector and so-
                                cio-economic activities. The study selected Ninh Thuan as a trend research
                                model because this is the drought center of Vietnam, where droughts frequently
                                occur, and this is also a sample of drought research that is representative of
                                Vietnam and regions of drought in the world.

                                Figure 1. Study area.

DOI: 10.4236/ajcc.2021.101004                           53                       American Journal of Climate Change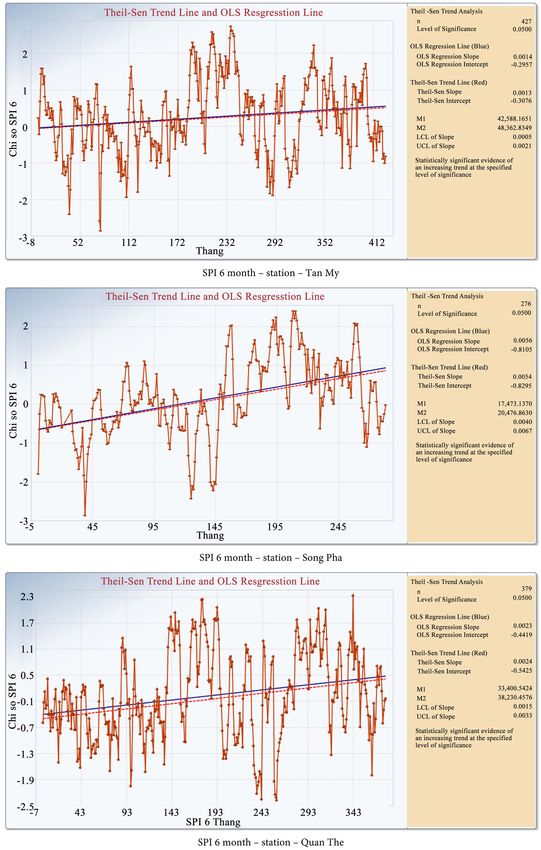
N. H. Tuan, T. T. Canh

                                3. Data and Methods
                                3.1. Data
                                Research using the data of temperature and precipitation in the 1986-2016 pe-
                                riod of the National Center for Meteorology and Hydrology, Scientific research
                                about Hydrology of Ninh Thuan province done by the Southern Branch of the
                                Institute of Meteorology, and the study on hydro-climatic characteristics of
                                Ninh Thuan province by the Hydrometeorology Station of the South Central.
                                The study data also use data from the Statistical yearbook of Ninh Thuan, Binh
                                Thuan, Lam Dong, and Khanh Hoa provinces (Table 1).

                                3.2. Methods
                                According to research by Wilhite and Glantz and the American Meteorological
                                Association, drought has been divided into four main categories: 1) meteorolog-
                                ical drought; 2) hydrological drought; 3) agricultural drought; 4) socio-economic
                                drought (AMS, 1997; Weltbank, 2006; Wilhite & Glantz, 1985). Based on the re-
                                search objectives of meteorological drought, agricultural drought and analysis of
                                the trend of changes in the indicators of meteorological drought and agricultural
                                drought, the research method of the topic is: 1) Method of calculating the index
                                meteorological drought and agricultural drought; 2) Non-parametric methods
                                include: Mann-Kendall and Theil-Sen.

                                3.2.1. Standardized Precipitation Index (SPI)
                                SPI was developed in 1993 by American scientists, including McKee, Doesken,
                                and Kleist at Colorado State University, United States of America. This index is
                                used to study drought caused by meteorology in the US (McKee et al., 1993;

                                Table 1. List of main stations used for research.

                                                                             Geographic coordinate
                                       Stations               Local                                            Data
                                                                          Longitude          Latitude

                                      Cam Ranh             Khanh Hoa      109˚09'00''        11˚55'00''         T0

                                     Phan Thiet            Binh Thuan     108˚06'00''        10˚56'00''         T0

                                        Da Lat             Lam Dong       108˚26'00''        11˚57'00''         T0

                                       Ba Thap            Ninh Thuan      109˚03'00''        11˚42'00''          P

                                        Ca Na             Ninh Thuan      108˚52'00''        11˚21'00''          P

                                       Nha Ho             Ninh Thuan      108˚54'00''        11˚42'00''          P

                                       Nhi Ha             Ninh Thuan      108˚40'00''        11˚28'00''          P

                                      Phan Rang           Ninh Thuan      108˚59'00''        11˚34'00''        P, T0

                                      Quan The            Ninh Thuan      108˚54'00''        11˚26'00''          P

                                      Song Pha            Ninh Thuận      108˚42'00''        11˚50'00''          P

                                       Tan My             Ninh Thuận      108˚49'29''        11˚42'00''          P

                                Note: T: temperature; P: precipitation.

DOI: 10.4236/ajcc.2021.101004                               54                          American Journal of Climate Change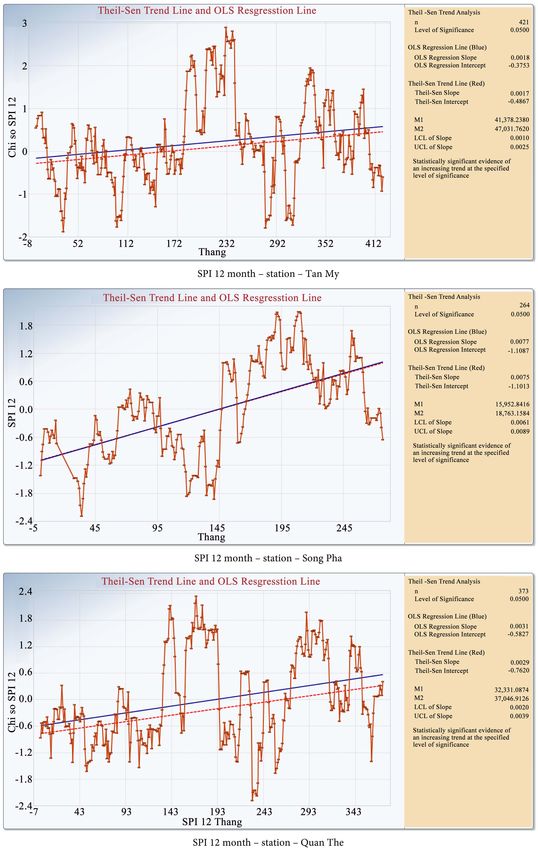
N. H. Tuan, T. T. Canh

                                WMO, 2012). According to the World Meteorological Organization (WMO)
                                and the Global Water Partnership (GWP), the SPI is recommended for use
                                worldwide, with more than 70 countries already using it for drought research
                                (WMO, 2012, 2014). Equation (1) calculates the SPI:
                                                                                   X −X
                                                                           SPI =                                           (1)
                                                                                     δ
                                where: X rainfall in time i (month, season, season); X is average rainfall i over
                                many years; δ is the standard deviation of precipitation over time i. The wet and
                                dry weather conditions are the category of drought shown by the SPI index cal-
                                culation (Table 2).

                                3.2.2. Moisture Index (MI)
                                The MI index is proposed in report no 1/48 in 1978-81 of FAO (FAO, 1978) and
                                Vietnam. This method is also widely used in the study of agricultural drought
                                (Doan Van Diem & Tran Danh Thin, 2007; Le Thi Thu Hien, 2013; Pham
                                Quang Vinh & Pham Thi Thanh Huong, 2013).
                                  Equation (2) calculates the MI:
                                                                             MI = R PET                                    (2)

                                where: R: Average annual precipitation; PET: the annual average amount of
                                evaporation capacity.
                                   PET is calculated using the Thornthwaite method and has been used in many
                                studies around the world (Adhikari et al., 2019; Hashemi & Habibian, 1979;
                                Moeletsi et al., 2013; Ogunrinde et al., 2020; Pereira & Paes De Camargo, 1989;
                                Pereira & Pruitt, 2004; Thornthwaite, 1948; Zhou et al., 2020). DrinC 1.7 soft-
                                ware (DrinC, 2019) was used to calculate PET. The results of the MI calculation
                                are that the agricultural drought level is shown in Table 3. This software is the
                                research result of the Centre for the Assessment of Natural Hazards and Proac-
                                tive Planning & Laboratory of Reclamation Works and Water Resources Man-
                                agement, National Technical University of Athens, Greece. DrinC software is
                                considered a useful tool in international publications to analyze drought in arid
                                and semi-arid regions (Tigkas et al., 2015, 2017, 2020).

                                Table 2. Drought classification based on SPI.

                                                        SPI                                        Category

                                                     SPI > 2.0                                   Extremely wet

                                                    1.5 SPI 1.99                                  Severely wet

                                                    1.0 SPI 1.49                                Moderately wet

                                                   −0.99 SPI 0.99                                Near normal

                                                  −1.0 SPI −1.49                              Moderately drought

                                                  −1.5 SPI −1.99                                Severely drought

                                                     SPI < −2                                  Extremely drought

                                Source: (McKee et al., 1993; WMO, 2012).

DOI: 10.4236/ajcc.2021.101004                             55                              American Journal of Climate Change
N. H. Tuan, T. T. Canh
Table 3. Drought classification based on MI.
Level of moisture MI Level of drought
Much moisture >1.2 Lessly drought
No shortage of moisture 0.8 - 1.2 Significantly drought
Mild moisture deficiency 0.4 - 0.79 Severely drought
Severe moisture deficiency 0
sgn ( x=
j − xi ) 0 if ( x= j − xi ) 0 (4)
−1 if ( x j − xi ) < 0
As a result, S > 0 is the uptrend and S < 0 is the downturn. Also, to have a
more accurate result and assessment, it is necessary to calculate the variance
(VAR) (Helsel & Hirsch, 1992). VAR is calculated by Equation (5):
n ( n − 1)( 2n + 5 ) − ∑ p =1 t p ( t p − 1)( 2t p + 5 )
1
(S )
VAR=
g
(5)
18
where tp is considered the number of relationships with the sample p, g is the
number of groups with the same data values. If the value of VAR(S) > 0, then the
trend is positive, and the VAR(S) < 0, then the trend is negative (Azad et al.,
2014), the Equation (6) calculates the MK (Z) index:
S −1
=Z ,S > 0
VAR ( S )
12
=
Z 0,= S 0 (6)
S +1
=Z ,S < 0
VAR ( S )
12
If Z > 0, the trend is up; Z < 0, downtrend.
Analysis Sen’s slop was developed in 1950 by Theil and developed by Sen in
1968 (Sen, 1968; Theil, 1950). Equation (7) calculates the estimated slope of Sen:
DOI: 10.4236/ajcc.2021.101004 56 American Journal of Climate Change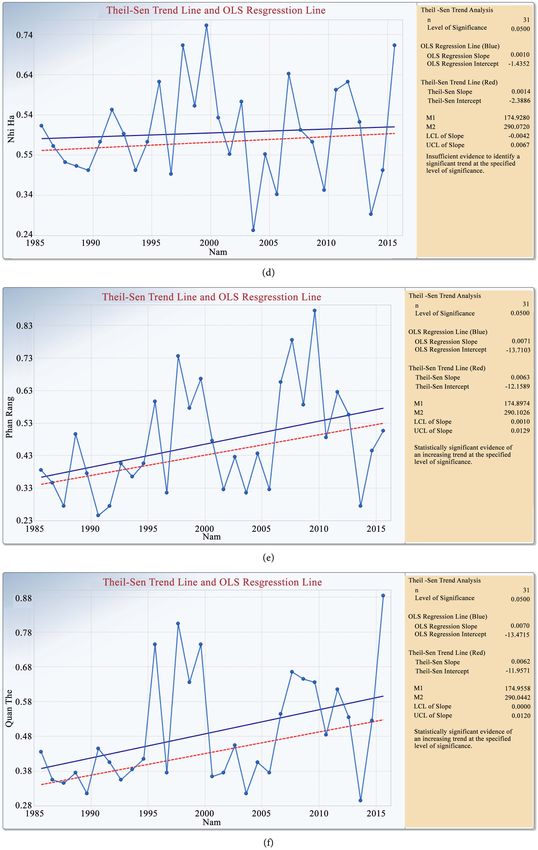
N. H. Tuan, T. T. Canh
xi′ − xi
Q= for i = 1, 2,3, , n (7)
i′ − i
where, Q: The slope between data two points xi and xi′ ; xi′ data measure-
ment at the time i ′ ; xi data measurement at time i; i ′ time after time i
Sen’s slope estimate is the mean slope (Q), calculated using the Equation (8):
N + 1
Q 2 if N old
Q′ = (8)
Q [ N + 1] + Q [ N + 2]
if N even
2
N is the number of calculator slope.
A two-sided test calculates Q with a confidence of 100(1 − α)%, and then an
actual slope can be obtained by the non-parametric test. If Q > 0.0, then increase
and Q < 0.0 value tends to decrease (Azad et al., 2014).
The software selected for the Mann-Kendall and Theil-Sen calculations is
ProUCL 5.1 and Makesens 1.0. ProUCL is a comprehensive statistical software
with statistical methods and graphical tools to solve many environmental sam-
pling and statistics problems, software developed by the US Environmental Pro-
tection Agency (EPA, 2016). Makesens 1.0 was developed on the Excel platform
of the Finnish Meteorological Institute. This program is used to study trends in
atmospheric concentration change, precipitation and has been widely applied in
coin research meteorological change (Salmi et al., 2002).
4. Result and Discussion
4.1. Result of Drought
4.1.1. Standardized Precipitation Index Result
The calculation results of SPI 1, SPI 3, SPI 6, and SPI 12 showed that drought
occurred in the study period with different types of drought. Synthesized results
of the months of 1986-2016 show that the whole Ninh Thuan province appeared
16 times (months) with Extreme drought, 85 times of severe drought, 199 times
of moderate drought, and 1157 times of near normal. The whole province had
215 times of moderately wet, severely wet, 121 times, and extremely wet 22 times
(Table 4, Figure 2).
Table 4. SPI calculation result and drought levels.
Drought levels
SPI Extremely Severely Moderately Near Moderately Severely Extremely
wet wet wet normal drought drought drought
SPI 1 8 21 33 258 31 14 4
SPI 3 7 22 40 232 45 15 6
SPI 6 1 32 38 234 30 23 4
SPI 12 3 22 55 210 52 15 1
Total 22 121 215 1157 199 85 16
DOI: 10.4236/ajcc.2021.101004 57 American Journal of Climate Change
N. H. Tuan, T. T. Canh

                                Figure 2. Drought characteristics according to the SPI 1, SPI 3, SPI 6, SPI 12. (a) SPI
                                1-month; (b) SPI 3-month; (c) SPI 6-month; (d) SPI 12-month.

                                   On the other hand, the calculation results of SPI 1, SPI 3, SPI 6, and SPI 12
                                showed that drought occurred in the study period with different forms. SPI 1
                                month, the number of droughts occurred the most with 258 times, while the num-
                                ber of droughts (moderately drought, severely drought, and extremely drought)
                                was 49 times, the number of times was wet (extremely wet, severely wet, and
                                moderately wet) was 62 times. (Table 4, Figure 2(a)). SPI 3 month, the number
                                of droughts occurring less than the number of droughts occurred 66 times with
                                droughts and 69 times with humidity (Table 4, Figure 2(b)). SPI 6 month, the
                                number of wet occurrences is 71 times higher than that of drought is 59 times
                                (Table 3, Figure 2(c)). Finally, in SPI 12 month, the drought is 68 times while
                                the humidity occurs 80 times (Table 4, Figure 2(d)).

DOI: 10.4236/ajcc.2021.101004                         58                           American Journal of Climate Change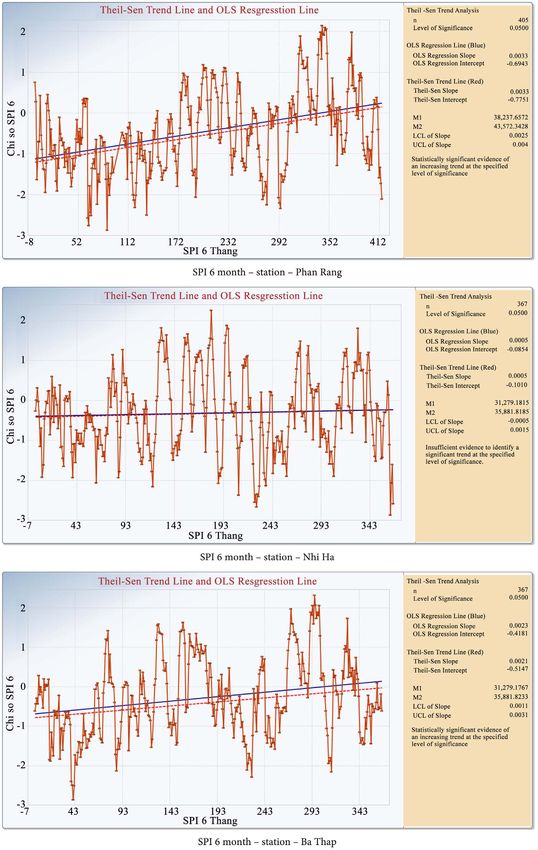
N. H. Tuan, T. T. Canh

                                4.1.2. Moisture Index Result
                                Analyzing the results of calculating the MI index to assess agricultural drought
                                in Ninh Thuan province, the results showed that agricultural drought is hap-
                                pening at different levels of drought, but mainly severe and significant drought
                                (Figure 3). Analysis of Figure 3 and Table 5 shows that in 1986-2016, the whole
                                Ninh Thuan province suffered from severe drought with an average of MI 0.66
                                (0.4 < MI < 0.79). Significant drought appeared 7 times with a frequency of 23%;
                                severe drought occurred 23 times with a frequency of 74% and only one extreme
                                drought in 1988 with a frequency of 3%. However, it is necessary to pay atten-
                                tion to the time when severe droughts appeared in 1986-2016. Severely droughts
                                appeared continuously in many years, such as 1986 to 1995 (except 1988 because
                                of extreme droughts), 2001 to 2006, and 2011 to 2015.
                                   The MI index by month shows that MI is the lowest from December to April
                                with MI below 0.4, which corresponds to extreme drought since this is a time of
                                very little rainfall and sometimes no rain; from May to August, Ninh Thuan
                                province experienced severe drought, September has drought significantly; Less-
                                ly drought in October and November with the MI index of 1.43 and 1.30, respec-
                                tively (Figure 4).

                                Figure 3. Drought events in Ninh Thuan from 1986 to 2016 according to the MI index.

                                Figure 4. Agricultural drought event appeared in the period 1986-2016 by month in Ninh
                                Thuan.

DOI: 10.4236/ajcc.2021.101004                         59                           American Journal of Climate Change
N. H. Tuan, T. T. Canh

                                Table 5. The result of Agricultural drought classification according to MI index.

                                                                            Drought levels
                                   Year                        Lessly     Significantly         Severely       Extremely
                                                  MI
                                                              drought       drought             drought         drought

                                   1986           0.50           0              0                  1                0

                                   1987           0.41           0              0                  1                0

                                   1988           0.38           0              0                  0                1

                                   1989           0.45           0              0                  1                0

                                   1990           0.42           0              0                  1                0

                                   1991           0.43           0              0                  1                0

                                   1992           0.52           0              0                  1                0

                                   1993           0.64           0              0                  1                0

                                   1994           0.48           0              0                  1                0

                                   1995           0.54           0              0                  1                0

                                   1996           0.83           0              1                  0                0

                                   1997           0.51           0              0                  1                0

                                   1998           1.10           0              1                  0                0

                                   1999           0.78           0              0                  1                0

                                   2000           1.02           0              1                  0                0

                                   2001           0.56           0              0                  1                0

                                   2002           0.53           0              0                  1                0

                                   2003           0.64           0              0                  1                0

                                   2004           0.43           0              0                  1                0

                                   2005           0.74           0              0                  1                0

                                   2006           0.52           0              0                  1                0

                                   2007           0.83           0              1                  0                0

                                   2008           1.09           0              1                  0                0

                                   2009           0.80           0              0                  1                0

                                   2010           0.96           0              1                  0                0

                                   2011           0.71           0              0                  1                0

                                   2012           0.78           0              0                  1                0

                                   2013           0.80           0              0                  1                0

                                   2014           0.47           0              0                  1                0

                                   2015           0.55           0              0                  1                0

                                   2016           1.00           0              1                  0                0

                                          Total                  0              7                  23               1

                                       Frequency                 0             23                  74               3

                                                                        Average: 0.66

DOI: 10.4236/ajcc.2021.101004                            60                               American Journal of Climate Change
N. H. Tuan, T. T. Canh
4.2. Evaluate the Trend of Change of SPI and MI
4.2.1. The Trend of Meteorological Drought
Based on the results of MK (Table 5), that the (Z) value is always positive from
SPI 1, SPI 3, SPI 6, and SPI 12, which shows that the meteorological term index
is tending to increase with the indices specific and corresponding to Theil-Sen
slope.
Considering the SPI 1 index, it has a different increase or decreases during the
research period, with the standard value (Z) equal to 6.056 and the slope of
Thiel-Sen equal to 0.0028; this proves that the term index is trending increas-
ing with an increase corresponding to the Theil-Sen index and that the
drought tends to decrease (Table 6, Figure 5(a)). SPI 3 months study shows a
positive standard value of 8.451, the standard deviation is 2377, and the slope of
Theil-Sen is 0.000138. It shows that the 3-month SPI has an increase of 0.000138
in the meteorological term, which means that the term tends to decrease, but
with the Theil-Sen index is too small, the meaning is not high (Table 6, Figure
5(b)). The SPI 6 month index also tended to increase with the Thiel-Sen slope of
0.000174 along with the standard value Z > 0 with SPI 6 of 10.69 (Table 6, Fig-
ure 5(c)). SPI 12 months, a positive Z value means an uptrend with the Z index
equal to 12.21 and the slope Theil-Sen equal to 0.00582; the results show that
drought in Ninh Thuan has a downward trend due to the number of SPI in-
creased (Table 6, Figure 5(d)).
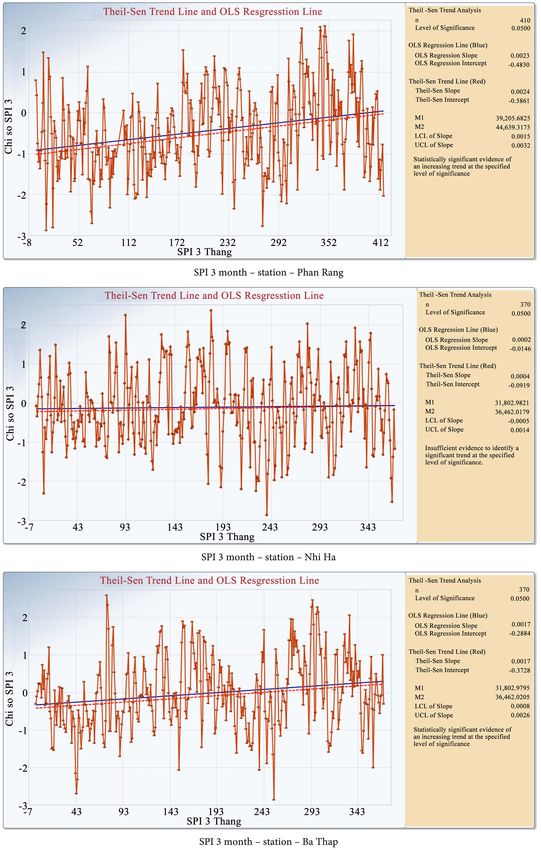
There is a clear differentiation of each region’s characteristics in terms of the
SPI index level for Ninh Thuan stations. The trend calculation results of indexes
SPI 1, SPI 3, SPI 6, and SPI 12 (Figure 6).
At Tan My station, the SPI has a trend increasing, but the slow increase means
that the drought tends to decrease, but not much because the coefficient of
standard Z is low, ranging from 0.9 to 4.8, with the Thiel-Sen coefficient in the
range from 0.001 to 0.016.
The Song Pha station shows that the area tends to increase and increase more
than the Tan My area. The analytical results showed that the standard Z value is
relatively high with a range of 2.5 to 9.2, and the Thiel-Sen increases in the range
0.002 to 0.080.
At Quan The station, trend test results show an uptrend in most of the index-
es. The test results from Table 7 show that Z’s expected value is positive for the
indices, and the slope Theil-Sen is also always positive. Theil-Sen coefficient as
Table 6. Analysis of trends in the change of meteorological drought index by SPI index (1,
3, 6, and 12) in Ninh Thuan.
Result (MK and Sen’s slope) SPI 1 SPI 3 SPI 6 SPI 12
Var (S) 2396 2377 2348 2291
Z (MK) 6.056 8.451 10.690 12.210
p-value 6.994E−10 0.000 0.000 0.000
Sen’s slope 0.0028 0.000138 1.74E−04 0.00582
DOI: 10.4236/ajcc.2021.101004 61 American Journal of Climate ChangeN. H. Tuan, T. T. Canh
Figure 5. Results of SPI 1, 3, 6, and 12 analysis by Mann-Kendall. (a) MK-SPI 1 month;
(b) MK-SPI 3 month; (c) MK-SPI 6 month; (d) MK-SPI 12 month.
DOI: 10.4236/ajcc.2021.101004 62 American Journal of Climate ChangeN. H. Tuan, T. T. Canh DOI: 10.4236/ajcc.2021.101004 63 American Journal of Climate Change
N. H. Tuan, T. T. Canh

DOI: 10.4236/ajcc.2021.101004   64   American Journal of Climate Change
N. H. Tuan, T. T. Canh

DOI: 10.4236/ajcc.2021.101004   65   American Journal of Climate Change
N. H. Tuan, T. T. Canh

DOI: 10.4236/ajcc.2021.101004   66   American Journal of Climate Change
N. H. Tuan, T. T. Canh

DOI: 10.4236/ajcc.2021.101004   67   American Journal of Climate Change
N. H. Tuan, T. T. Canh

DOI: 10.4236/ajcc.2021.101004   68   American Journal of Climate Change
N. H. Tuan, T. T. Canh

DOI: 10.4236/ajcc.2021.101004   69   American Journal of Climate Change
N. H. Tuan, T. T. Canh

           Figure 6. Chart showing the changing trend of the SPI index.

DOI: 10.4236/ajcc.2021.101004                                  70         American Journal of Climate Change
N. H. Tuan, T. T. Canh
Table 7. Results of trend analysis at hydro-meteorological stations.
Analysis results SPI
Stations
(MK and Sen’s slope) SPI 1 SPI 3 SPI 6 SPI 12
Var (S) 2997 2977 2946 2885
Z (MK) 1.437 2.6 3.208 4.756
Tan My
p-value 0.0753 0.00466 0.000668 9.8683E−07
Sen’s slope 0.00045 0.00104 0.00132 0.00174
Var (S) 1616 1574 1533 1434
Z (MK) 3.596 5.397 7.425 9.155
Song Pha
p-value 1.62E−04 3.39E−08 5.64E−14 0.00E+00
Sen’s slope 2.11E−03 0.00394 0.00541 0.00755
Var (S) 2513 2494 2464 2406
Z (MK) 2.275 3.241 4.878 6.408
Quan The
p-value 1.15E−02 5.95E−04 5.36E−07 7.40E−11
Sen’s slope 8.24E−04 0.00153 0.00242 0.00293
Var (S) 2823 2772 2722 2602
Z (MK) 3.638 5.549 7.777 9.748
Phan Rang
p-value 1.37E−04 1.44E−08 3.66E−15 0.00E+00
Sen’s slope 1.33E−03 0.00239 0.00326 0.00379
Var (S) 2396 2377 2348 2291
Z (MK) 0.294 0.854 0.991 1.302
Nhi Ha
p-value 3.84E−01 1.97E−01 1.61E−01 9.65E−02
Sen’s slope 0.00E+00 4.25E−04 5.15E−04 6.46E−04
Var (S) 2396 2377 2348 2291
Z (MK) 2.319 3.699 4.255 3.938
Ba Thap
p-value 1.02E−02 1.08E−04 1.05E−05 4.11E−05
Sen’s slope 9.03E−04 1.72E−03 2.09E−03 2.06E−03
SPI 1 increased by 0.0008, SPI 3 increased by 0.00153, SPI 6 increased by
0.000242, and SPI 12 increased by 0.000293.
At Phan Rang station, calculating the trend results showed that the cashew
indexes have statistical significance with p-value < 0.05 and the coefficient of
standard Z is relatively high from 2.5 to 9.7, and the coefficient Theil-Sen in-
creases in the frame from 0.0013 to 0.05 (Table 7). SPI 1, SPI 3, SPI 6, and SPI 12
show a nearly equal increase trend, especially SPI 6 and SPI 12 with standard
deviations of 2722, 2662, 2602, respectively. That is, the Theil-Sen slope is
equally increasing with the increase of 0.0033, 0.0036, and 0.0038, respectively.
At Nhi Ha station generally tended to increase, but the indicators were too
low with the standard Z value from 0.19 to 1.3, and the meager Theil-Sen ratio
increased by 0.002, and in which the SPI 1 index does not increase.
DOI: 10.4236/ajcc.2021.101004 71 American Journal of Climate ChangeN. H. Tuan, T. T. Canh
In Ba Thap, the upward trend of the SPI indexes is clear, the Theil-Sen index
from SPI 1 to SPI 12 is shallow, but the positive Z value means that the SPI 1 to
SPI 12 increases and increased from 0.00017 to 0.00197 corresponding. SPI 1 in-
creased 0.000903, SPI 3 increased 0.00172, SPI 6 increased 0.00209, and SPI 12
increased 0.00206.
4.2.2. The Trend of Agricultural Drought
The analysis results of the trend of changes in MI year show that the whole Ninh
Thuan province tends to increase the MI index and means that the term will de-
crease in the future. The analysis results showed that the annual MI increased by
0.0133 per year, corresponding to the Sen’s slope index of 0.0133. The results of
increasing MI in Ninh Thuan show very clearly and have very high statistical
significance with Z is 3164 and p-value is 0.008.
The changing trend at Ba Thap, Ca Na, Nha Ho, Nhi Ha, Phan Rang, Quan
The, Song Pha, and Tan My stations generally increases with different statistical
significance. Comparing the increase in MI of different regions compared to MI
year, the only Song Pha region is higher than the MI year (0.030 with 0.0133),
while the rest areas are lower than MI. The analysis results also showed that
many stations have statistically significant (p ≤ 0.05) such as Phan Rang, Quan
The, Song Pha, and the remaining stations are not statistically significant. In
Phan Rang, the results showed that the p-value was 0.016, with the coefficient
Z > 0, Z equal to 2.144 and the Sen’s slope index of 0.0063, with the Sen’s slope
index showed in the Phan Rang area, the MI index would increase adding 0.0063
per year (Table 7, Figure 7(e)). In Quan The, trend analysis shows that every
year the MI index increases by 0.0062, this corresponds to the Sen’s slope is
0.0062, and the result of the MK calculation shows a positive Z index, with Z is
2.061, it illustrates drought reduction trends in Quan The area (Table 8, Figure
7(f)). Song Pha is the region with the highest increase in MI in the regions and
higher than the annual MI index, with annual increases of 0.03 per year; this
value corresponds to the Theil-Sen analysis is 0.0300. The results of calculating
the Z index of Song Pha also reflect the increasing trend of the MI index (Z > 0)
with Z is 2.874 (Table 8, Figure 7(g)).
As for the remaining stations, although the p-value index is not in the statis-
tical significance (p ≥ 0.05), it still looks to assess trends and is also considered as
Table 8. Analysis results of MK index of MI (year).
Result of MK Stations
and MI Ba Ca Nha Nhi Phan Quan Song Tan
Theil–Sen test year Thap Na Ho Ha Rang The Pha My
Var (S) 58.78 58.76 58.79 58.81 58.75 58.78 58.72 42.79 58.73
Z (MK) 3.164 1.566 1.616 0.697 0.426 2.144 2.061 2.874 0.817
p-value 0.0008 0.0587 0.0531 0.243 0.335 0.016 0.0197 0.00203 0.207
Sen’s slope 0.0133 0.0063 0.005 0.0022 0.0014 0.0063 0.0062 0.0300 0.0032
DOI: 10.4236/ajcc.2021.101004 72 American Journal of Climate ChangeN. H. Tuan, T. T. Canh DOI: 10.4236/ajcc.2021.101004 73 American Journal of Climate Change
N. H. Tuan, T. T. Canh

DOI: 10.4236/ajcc.2021.101004   74   American Journal of Climate Change
N. H. Tuan, T. T. Canh

Figure 7. The trend of MI index changes at the stations. (a) Ba Thap Station; (b) Ca Na Station; (c) Nha Ho Station; (d) Nhi Ha
Station; (e) Phan Rang Station; (f) Quan The Station; (g) Song Pha Station; (h) Tan My Station.

                                       a basis for analyzing and forecasting in the future. At Ba Thap, Ca Na, Nha Ho,
                                       Nhi Ha, and Tan My stations, the p-value ranged from 0.06 to 0.20, the Z index
                                       was positive 1.566, 1.616, 0.697, 0.426, and 0.817, respectively; The increase in
                                       MI index of the stations ranged from 0.001 to 0.006 corresponding to the analy-
                                       sis index Theil-Sen of the station’s Ba Thap, Ca Na, Nha Ho, Nhi Ha, and Tan
                                       My were 0.006, 0.005, 0.002, 0.001, and 0.003 (Table 8, Figures 7(a)-(d) and
                                       Figure 7(h)).
                                          The study also showed that the MI index by month tends to increase, reducing
                                       the risk of drought in Ninh Thuan province. Analyzing the trend of changes in
                                       the MI index by month, the results showed eleven months of increasing and one

DOI: 10.4236/ajcc.2021.101004                                 75                           American Journal of Climate Change
N. H. Tuan, T. T. Canh
month of decreasing. Table 9 showed that during the year from January to Au-
gust, the MI index increased, September tended to decrease, and October to De-
cember increases (Table 9). Based on the significance level, in 12 months, only
January, February, May, and July are statistically significant. The remaining
months are not statistically significant but are still used to evaluate trends. Spe-
cifically, according to Table 8, the MI index in September decreased by the
standard value Z < 0 equal to −0.221 with the Sen slope of −0.003, corresponding
to an increase in September with an increase of 0.003 per year. The standard Z
value is always optimistic in the remaining months, meaning that the drought
will decrease in the months from October to August of the following year. The
month with the most robust increasing trend in November with a high standard
deviation of 58.8, a standard Z value of 1037, and a Sen slope of 0.021, indicating
that each year in November, the MI index increases by 0.02 and the drought
agriculture tends to decrease (Table 9).
4.3. Forecasting the Trend of Changing the SPI and MI Index
4.3.1. Trend of Change SPI to 2100
Analysis and compared the values of SPI 1, SPI 3, SPI 6, and SPI 12 tenses, SPI
12 increased more with an average increase of 0.006 per year, while the lowest is
SPI 3 with 0.0001 per year. Specifically, SPI 1 month with an increase of 0.003
per year, by 2035, it will increase by 0.063, and by the end of 2100, it will increase
by 0.3; SPI in 3 months with meager growth rate increases by 0.002 by 2035 and
by 2100 by 0.008. The average increase of SPI 6 is 0.0002; in 2035, it will increase
to 0.004 and about 0.02 in 2100. SPI 12 has an increase of 0.006 will increase to
0.12 by 2035, and by the end of the 21st century, it will increase more than 0.5.
Considering the SPI index taking the 2016 standard year, the forecast results
based on the changing trend of Theil-Sen coefficient, the results of calculating
the indexes from 2016 to 2100 are as follows: SPI index in 1 month of 2016 is
−0.32 to 2035 decreases to −0.26 in 2035, −0.22 in 2050, −0.14 in 2075 and −0.68
in 2100. SPI 3, SPI 6 tends to decrease, but not significantly; SPI 3 in 2016 is
−0.38 to the end of the decade of -0.40, SPI 6 of 2016 was −0.27 to the end of
2100 is −0.25. The SPI 12 shows that the drought index is increasing the SPI 12,
tends to decrease from −0.08 in 2016 to 2100, increasing to 0.42 (Table 10).
Table 9. Analysis results of MK index of MI (Month).
Test Month
results 1 2 3 4 5 6 7 8 9 10 11 12
Var (S) 55.8 52.4 58.2 58.7 58.8 58.8 58.8 58.8 58.8 58.8 58.8 58.7
Z (MK) 2.006 1.718 0.928 1.278 2.092 1.004 3.299 1.395 –0.221 1.428 1.037 0.766
p-value 0.022 0.043 0.177 0.101 0.018 0.158 0.000 0.082 0.413 0.077 0.150 0.222
Sen’s
0.001 0.000 0.001 0.003 0.013 0.004 0.012 0.006 –0.003 0.020 0.021 0.008
slope
DOI: 10.4236/ajcc.2021.101004 76 American Journal of Climate ChangeN. H. Tuan, T. T. Canh
4.3.2. The Trend of Change MI to 2100
The results estimate the trend of changing agricultural drought in Ninh Thuan
province through increased MI in each year based on the Sen’s slope trend cal-
culation results. The trend estimation results showed that the period’s MI index
increased to the end of 2100 from severe drought to a limited amount of
drought. The MI index in the calculated period was 0.66, with an increase ac-
cording to Theil-Sen’s calculation. 0.013 per year to 2035 the MI index is 0.93,
2050 is 1.13, 2075 is 1.46, and by 2100 it is 1.79.
Based on the results of calculating MK and Sen’s slope index, we can predict
the trend of changes in MI indicators in the future (Table 11). The forecast re-
sults show that the MI index increases over the months, meaning that the agri-
cultural drought tends to decrease. Forecasts are based on 2016 to forecast for
2035, 2050, 2075, and 2100. The forecast results show that there are only a few
months with a downward trend of April, May, July, August, and December. The
remaining months, droughts are almost unchanged until the end of the 21st
century. Compared to 2016, January and February, and March are at severe
droughts until 2035 and 2050, 2075 and 2100 unchanged drought remained at
severe drought. April and May’s droughts tended to decrease from severe
drought to severe drought in April and severe drought in May (Table 11).
Table 10. Forecasts of SPI indicators is bases on the results of Sen’s slope analysis.
2016 2035 2050 2075 2100
SPI/Year Sen’s Sen’s Sen’s Sen’s Sen’s
SPI SPI SPI SPI SPI
slope slope slope slope slope
SPI 1 0.0030 −0.320 0.063 −0.257 0.105 −0.215 0.18 −0.140 0.252 −0.068
SPI 3 0.0001 −0.380 0.002 −0.378 0.004 −0.377 0.006 −0.374 0.008 −0.372
SPI 6 0.0002 −0.270 0.004 −0.266 0.007 −0.263 0.012 −0.258 0.017 −0.253
SPI 12 0.0060 −0.080 0.120 0.040 0.210 0.130 0.360 0.280 0.504 0.424
Table 11. Predict the MI variable to the end of the 21st century through the Sen’s slope
index.
Year: 2016 Trend of drought
Content
MI Level 2035 Level 2050 Level 2075 Level 2100 Level
Year
0.66 1 0.93 2 1.13 3 1.46 3 1.79 3
Month
1 0.08 1 0.1 1 0.11 1 0.13 1 0.15 1
2 0.02 1 0.02 1 0.02 1 0.02 1 0.02 1
3 0.11 1 0.12 1 0.13 1 0.14 1 0.15 1
4 0.18 1 0.24 1 0.28 1 0.35 1 0.42 2
5 0.5 2 0.75 3 0.94 3 1.25 4 1.56 4
6 0.44 2 0.51 2 0.56 2 0.65 2 0.74 2
7 0.44 2 0.67 2 0.85 3 1.14 3 1.43 4
8 0.43 2 0.55 2 0.64 2 0.78 2 0.93 3
9 1.18 3 1.13 4 1.09 3 1.03 3 0.97 3
10 1.42 4 1.82 4 2.12 4 2.62 4 3.12 4
11 1.29 4 1.72 4 2.04 4 2.57 4 3.1 4
12 0.76 2 0.92 3 1.05 3 1.25 4 1.46 4
Note: 1: Extremely drought; 2: Severely drought; 3: Significantly drought; 4: Lessly drought.
DOI: 10.4236/ajcc.2021.101004 77 American Journal of Climate ChangeN. H. Tuan, T. T. Canh
5. Conclusion
The study used SPI and MI indicators to study the drought characteristics in
Ninh Thuan province and used MK and Sen’s slope analysis to analyze SPI and
MI indicators’ variation. The meteorological drought (SPI) and agricultural
drought (MI) in the Ninh Thuan area showed a difference in the drought mag-
nitude and intensity. Meteorological drought with indicators SPI 1, 3, 6, and 12
shows the occurrence of many extreme droughts and severe droughts. In agri-
cultural drought, mainly severe drought and significant droughts appear in the
average AI index of the severe drought which is −0.70.
Analyzing the trend of changing two indexes, namely meteorological drought
and agriculture drought, has similarities with the present and future downward
trend. For the meteorological drought, the SPI tends to increase, which means
that the meteorological term tends to decrease next time. In which areas of Phan
Rang, Song Pha, Quan The, and Ba Thap tend to increase very clearly, Tam My
and Nhi Ha tend to increase very low. With the agricultural drought, the average
MI results per year increased by 0.013 per year, with the Song Pha station tend-
ing to increase the highest with 0.03 per year and the lowest is Nhi Ha with 0.001
per year.
Meteorological drought forecast results show that by the end of the 21st cen-
tury, the index SPI 1, 3, 6, and 12 tends to decrease compared to 2016. With SPI
1 being −0.68, SPI 3 is −0.40, SPI 6 is −0.25, and SPI 12 is 0.42. Along with that is
the forecast that the MI index will increase 0.013 per year to 2035, the MI index
is 0.93, in 2050 is 1.13, in 2075 is 1.46, and by 2100 it is 1.79.
The research results show the vital role of non-parametric analysis in analyz-
ing and assessing changing environmental field trends. MK and Sen’s slope
analysis is currently a useful tool for many studies related to predicting change
trends related to meteorology and hydrology. In the field of drought research,
the application of MK and Sen’s slope will be the foundation for policymakers,
environmental resources management agencies, researchers ... to develop and
research solutions for adapting and mitigating the impacts of drought on so-
cio-economic in the present and the future.
Conflicts of Interest
The authors declare no conflicts of interest regarding the publication of this
paper.
References
Abares (2012). Drought in Australia: Context, Policy, and Management (No. 43282).
Australian Bureau of Agricultural and Resource Economics and Sciences report to
client (GHD Pty. Ltd.) prepared for the Australia China Environment Development
Partnership.
Adhikari, A., Mainali, K. P., Rangwala, I., & Hansen, A. J. (2019). Various Measures of
Potential Evapotranspiration Have Species-Specific Impact on Species Distribution
Models. Ecological Modelling, 414, Article ID: 108836.
DOI: 10.4236/ajcc.2021.101004 78 American Journal of Climate ChangeN. H. Tuan, T. T. Canh
https://doi.org/10.1016/j.ecolmodel.2019.108836
AghaKouchak, A. (2014). A Baseline Probabilistic Drought Forecasting Framework Using
Standardized Soil Moisture Index: Application to the 2012 United States Drought. Hy-
drology and Earth System Sciences, 18, 2485-2492.
https://doi.org/10.5194/hess-18-2485-2014
Ahmed, S. I., Rudra, R., Dickinson, T., & Ahmed, M. (2014). Trend and Periodicity of
Temperature Time Series in Ontario. American Journal of Climate Change, 3, 272-288.
https://doi.org/10.4236/ajcc.2014.33026
Allaby, M., Garratt, R., & Allaby, M. (2003). Droughts (Rev. ed.). Facts on File.
AMS (1997). Meteorological Drought—Policy Statement. Bulletin of the American Me-
teorological Society, 78, 847-849. https://doi.org/10.1175/1520-0477-78.5.847
Azad, A. S., Hasan, Md. K., Rahman, M. A. I., Rahman, Md. M., & Shahriar, N. (2014).
Exploring the Behavior and Changing Trends of Rainfall and Temperature Using Sta-
tistical Computing Techniques. In T. Islam, P. K. Srivastava, M. Gupta, X. Zhu, & S.
Mukherjee (Eds.), Computational Intelligence Techniques in Earth and Environmental
Sciences (pp. 53-78). Dordrecht: Springer.
https://doi.org/10.1007/978-94-017-8642-3_3
Bayazıt, Y., Bakış, R., & Koç, C. (2019). Mapping of Stream Flow Trends in Porsuk Basin
Using GIS Environment. Journal of Geoscience and Environment Protection, 7, 58-66.
https://doi.org/10.4236/gep.2019.79005
Bera, S. (2017). Trend Analysis of Rainfall in Ganga Basin, India during 1901-2000.
American Journal of Climate Change, 6, 116-131.
https://doi.org/10.4236/ajcc.2017.61007
Bhuyan, Md. D. I., Islam, Md. M., & Bhuiyan, Md. E. K. (2018). A Trend Analysis of
Temperature and Rainfall to Predict Climate Change for Northwestern Region of Ban-
gladesh. American Journal of Climate Change, 7, 115-134.
https://doi.org/10.4236/ajcc.2018.72009
Blain, G. C. (2012). Revisiting the Probabilistic Definition of Drought: Strengths, Limita-
tions and an Agrometeorological Adaptation. Bragantia, 71, 132-141.
https://doi.org/10.1590/S0006-87052012000100019
Bordi, I., & Sutera, A. (2007). Drought Monitoring and Forecasting at Large Scale. In G.
Rossi, T. Vega, & B. Bonaccorso (Eds.), Methods and Tools for Drought Analysis and
Management (pp. 3-27). Dordrecht: Springer.
https://doi.org/10.1007/978-1-4020-5924-7_1
Brewer, M. J., & Heim Jr., R. R. (2011). The Global Drought Monitor Portal.
http://digitalcommons.unl.edu/droughtfacpub/55/
Cardoso, L. F. N., Silva, W. L., & da Silva, M. G. A. J. (2016). Long-Term Trends in
Near-Surface Wind Speed over the Southern Hemisphere: A Preliminary Analysis. In-
ternational Journal of Geosciences, 7, 938-943. https://doi.org/10.4236/ijg.2016.77070
Chatterjee, K., Bandyopadhyay, A., Ghosh, A., & Kar, S. (2015). Assessment of Environ-
mental Factors Causing Wetland Degradation, Using Fuzzy Analytic Network Process:
A case Study on Keoladeo National Park, India. Ecological Modelling, 316, 1-13.
https://doi.org/10.1016/j.ecolmodel.2015.07.029
Cooley, H., Donnelly, K., Phurisamban, R., & Subramanian, M. (2015). Impacts of Cali-
fornia’s Ongoing Drought: Agriculture. Oakland, CA: Pacific Institute.
https://www.shrm.org/ResourcesAndTools/legal-and-compliance/state-and-local-upda
tes/Documents/ImpactsOnCaliforniaDrought-Ag.pdf
Correia, F. N. (2007). Water Scarcity and Drought a Priority of the Portuguese Presiden-
DOI: 10.4236/ajcc.2021.101004 79 American Journal of Climate ChangeN. H. Tuan, T. T. Canh
cy. Ministério do Ambiente, do ordenamento do território e do desenvolvimento re-
gional.
CRED (2006). CRED Crunch December 2006. Centre for Research on the Epidemiology
of Disasters. Belgium.
Dai, A., Trenberth, K. E., & Qian, T. (2004). A Global Dataset of Palmer Drought Severity
Index for 1870-2002: Relationship with Soil Moisture and Effects of Surface Warming.
Journal of Hydrometeorology, 5, 1117-1130. https://doi.org/10.1175/JHM-386.1
Ding, Y., Hayes, M. J., & Widhalm, M. (2010). Measuring Economic Impacts of Drought:
A Review and Discussion. Disaster Prevention and Management: An International
Journal, 20, 434-446. https://doi.org/10.1108/09653561111161752
Djaman, K., Koudahe, K., & Ganyo, K. K. (2017). Trend Analysis in Annual and Monthly
Pan Evaporation and Pan Coefficient in the Context of Climate Change in Togo. Jour-
nal of Geoscience and Environment Protection, 5, 41-56.
https://doi.org/10.4236/gep.2017.512003
Doan Van Diem, & Tran Danh Thin (2007). Assessment of Drought Impacts and Some
Keeping Soil Moisture Measures on Winter Maize in Midland Area of Northern Viet-
nam. VNU Journal of Science: Natural Sciences and Technology, 23, 91-98.
Domeisen, N. (1995). Disasters: Threat to Social Development. STOP Disasters, The
IDNDR Magazine No. 23, Geneva, Switzerland: IDNDR Secretariat.
DrinC (2019). Drought Indices Calculator (1.7). Computer Software.
https://drought-software.com
EPA (2016). ProUCL Software 5.1.00 (5.1).
https://www.epa.gov/land-research/proucl-software
Ernest, S., Nduganda, A. R., & Kashaigili, J. J. (2017). Urban Climate Analysis with Re-
mote Sensing and Climate Observations: A Case of Morogoro Municipality in Tanza-
nia. Advances in Remote Sensing, 6, 120-131.
https://doi.org/10.4236/ars.2017.62009
Esfahanian, E., Nejadhashemi, A. P., Abouali, M., Adhikari, U., Zhang, Z., Daneshvar, F.,
& Herman, M. R. (2017). Development and Evaluation of a Comprehensive Drought
Index. Journal of Environmental Management, 185, 31-43.
https://doi.org/10.1016/j.jenvman.2016.10.050
FAO (1978). Report on the Agro-Ecological Zones Project. Vol. 1: Methodology and Re-
sult for Africa. World Soil Resources Report 48/1, FAO.
Gillette, H. P. (1950). A Creeping Drought under Way. Water and Sewage Works,
104-105.
Govorushko, S. M. (2012). Natural Processes and Human Impacts. Dordrecht: Springer.
https://doi.org/10.1007/978-94-007-1424-3
GSA (2006). Managing Drought: A Roadmap for Change in the United States. A confe-
rence report from Managing Drought and Water Scarcity in Vulnerable Environments,
Longmont, CO, 18-20 September 2006.
Hashemi, F., & Habibian, M. T. (1979). Limitations of Temperature-Based Methods in
Estimating Crop Evapotranspiration in Arid-Zone Agricultural Development Projects.
Agricultural Meteorology, 20, 237-247. https://doi.org/10.1016/0002-1571(79)90025-6
Helsel, D. R., & Hirsch, R. M. (1992). Statistical Methods in Water Resources (Vol. 49, pp.
iii-xvi). Amsterdam: Elsevier Science Ltd.
Henry, B., McKeon, G., Syktus, J., Carter, J., Day, K., & Rayner, D. (2007). Climate Varia-
bility, Climate Change and Land Degradation. In M. V. K. Sivakumar, & N. Ndiang’ui
(Eds.), Climate and Land Degradation (pp. 205-221). Berlin, Heidelberg: Springer.
DOI: 10.4236/ajcc.2021.101004 80 American Journal of Climate ChangeN. H. Tuan, T. T. Canh
Herweijer, C., Seager, R., Cook, E. R., & Emile-Geay, J. (2007). North American Droughts
of the Last Millennium from a Gridded Network of Tree-Ring Data. Journal of Climate,
20, 1353-1376. https://doi.org/10.1175/JCLI4042.1
Islam, A. W. (2015). Rainy/Non-Rainy Day Pattern Analysis for North Carolina. Ameri-
can Journal of Climate Change, 4, 1-8. https://doi.org/10.4236/ajcc.2015.41001
Jenkins, K. L. (2011). Modelling the Economic and Social Consequences of Drought under
Future Projections of Climate Change. PhD Thesis, Cambridge: University of Cambridge.
Jeyaseelan, A. T. (2003). Droughts & Floods Assessment and Monitoring Using Remote
Sensing and GIS. In M. V. K Sivakumar et al. (Eds.), Satellite Remote Sensing and GIS
Applications in Agricultural Meteorology (Vol. 291). Geneva, Switz: World Meteoro-
logical Organisation. http://www.wamis.org/agm/pubs/agm8/Paper-14.pdf
Kendall, M. G. (1975). Rank Correlation Methods. London: Griffin.
Koba, M. (2014, September 5). Global Drought Real Threat to Lives and Economies: Ex-
perts. CNBC.
http://www.cnbc.com/2014/09/05/global-drought-real-threat-to-lives-and-economices-
experts.html
Koudahe, K., Kayode, A. J., Samson, A. O., Adebola, A. A., & Djaman, K. (2017). Trend
Analysis in Standardized Precipitation Index and Standardized Anomaly Index in the
Context of Climate Change in Southern Togo. Atmospheric and Climate Sciences, 7,
401-423. https://doi.org/10.4236/acs.2017.74030
Lake, P. S. (2011). Drought and Aquatic Ecosystems: Effects and Responses. Hoboken,
NJ: Wiley-Blackwell. https://doi.org/10.1002/9781444341812
Le Thi Thu Hien (2013). Application the Normalised Difference Vegetation Index of
Landsat Imagery to Assess the Desertification in Binh Thuan Province. Vietnam Jour-
nal of Earth Sciences, 35, 357-363.
Mann, H. B. (1945). Non-Parametric Tests Against Trend. Econometrica, 13, 245-259.
https://doi.org/10.2307/1907187
McKee, T. B., Doesken, N. J., Kleist, J. et al. (1993). The Relationship of Drought Fre-
quency and Duration to Time Scales. Proceedings of the 8th Conference on Applied
Climatology, 17, 179-183.
Moeletsi, M. E., Walker, S., & Hamandawana, H. (2013). Comparison of the Hargreaves
and Samani Equation and the Thornthwaite Equation for Estimating Dekadal Evapo-
transpiration in the Free State Province, South Africa. Physics and Chemistry of the
Earth, Parts A/B/C, 66, 4-15. https://doi.org/10.1016/j.pce.2013.08.003
Murumkar, A. R., & Arya, D. S. (2014). Trend and Periodicity Analysis in Rainfall Pattern
of Nira Basin, Central India. American Journal of Climate Change, 3, 60-70.
https://doi.org/10.4236/ajcc.2014.31006
Ngo Dinh Tuan, & Ngo Le An (2016). Research on Drought Factors, Criteria, Classifica-
tion in Ninh Thuan-Binh Thuan Provinces and Their Prevention and Mitigation
Measures. Journal of Water Resources and Environmental Engineering, 30, 132.
Nguyễn Đinh Tuấn, Bảo Văn Tuy, & Nguyễn Kỳ Phùng (2012). Tác động của biến đổi
khí hậu đến lĩnh vực nông nghiệp ở Ninh Thuận và giải pháp tương ứng. Tạp Chí Tài
Nguyên và Môi Trường, 23, pp. (In Vietnamese)
Nguyễn Đình Vượng, & Huỳnh Ngọc Tuyên (2012). Một số giải pháp sử dụng hợp lý tài
nguyên nước, phòng chống hạn hán, sa mạc hóa, thích ứng biến đổi khí hậu trên vùng
đất cát ven biển Ninh Thuận. Thông Tin Khoa Học Công Nghệ Ninh Thuận, Nghiên
cứu trao đổi. (In Vietnamese)
Nguyễn Hồng Trường (2008). Ứng dụng các biện pháp truyền thống và khoa học kỹ
DOI: 10.4236/ajcc.2021.101004 81 American Journal of Climate ChangeN. H. Tuan, T. T. Canh
thuật mới nhằm khai thác, bảo vệ tài nguyên đất và nước, góp phần phòng chống hạn
ở xã Phước Nam tỉnh Ninh Thuận. Tạp Chí Khí Tượng Thủy Văn, 8, 45-50. (In Viet-
namese)
Nyatuame, M., & Agodzo, S. (2017). Analysis of Extreme Rainfall Events (Drought and
Flood) over Tordzie Watershed in the Volta Region of Ghana. Journal of Geoscience
and Environment Protection, 5, 275-295. https://doi.org/10.4236/gep.2017.59019
Ogunrinde, A. T., Olasehinde, D. A., & Olotu, Y. (2020). Assessing the Sensitivity of
Standardized Precipitation Evapotranspiration Index to Three Potential Evapotranspi-
ration Models in Nigeria. Scientific African, 8, e00431.
https://doi.org/10.1016/j.sciaf.2020.e00431
Okafor, G. C., Jimoh, O. D., & Larbi, K. I. (2017). Detecting Changes in Hydro-Climatic
Variables during the Last Four Decades (1975-2014) on Downstream Kaduna River
Catchment, Nigeria. Atmospheric and Climate Sciences, 7, 161-175.
https://doi.org/10.4236/acs.2017.72012
Pereira, A. R., & Paes De Camargo, Â. (1989). An Analysis of the Criticism of Thorn-
thwaite’s Equation for Estimating Potential Evapotranspiration. Agricultural and For-
est Meteorology, 46, 149-157. https://doi.org/10.1016/0168-1923(89)90118-4
Pereira, A. R., & Pruitt, W. O. (2004). Adaptation of the Thornthwaite Scheme for Estimat-
ing Daily Reference Evapotranspiration. Agricultural Water Management, 66, 251-257.
https://doi.org/10.1016/j.agwat.2003.11.003
Pham Quang Vinh, & Pham Thi Thanh Huong (2013). Assessing Agricultural Drought
for Binh Thuan Province under Climate Change Scenario. Vietnam Journal of Earth
Sciences, 34, 513-523.
Prud’Homme, A. (2011, July 16). Drought: A Creeping Disaster. The New York Times.
http://www.nytimes.com/2011/07/17/opinion/sunday/17drought.html
Salmi, T., Määttä, A., Anttila, P., Ruoho-Airola, T., & Amnell, T. (2002). Detecting
Trends of Annual Values of Atmospheric Pollutants by the Mann-Kendall Test and
Sen’s Slope Estimates the Excel Template Application MAKESENS (Vol. 31). Finnish
Meteorological Institute.
Sen, P. K. (1968). Estimates of the Regression Coefficient Based on Kendall’s Tau. Journal
of the American Statistical Association, 63, 1379-1389.
https://doi.org/10.1080/01621459.1968.10480934
Svoboda, M. D., Fuchs, B. A., Poulsen, C. C., & Nothwehr, J. R. (2015). The Drought Risk
Atlas: Enhancing Decision Support for Drought Risk Management in the United States.
Journal of Hydrology, 526, 274-286. https://doi.org/10.1016/j.jhydrol.2015.01.006
Tadesse, T., Haile, M., Senay, G., Wardlow, B. D., & Knutson, C. L. (2008). The Need for
Integration of Drought Monitoring Tools for Proactive Food Security Management in
Sub-Saharan Africa. Natural Resources Forum, 32, 265-279.
https://doi.org/10.1111/j.1477-8947.2008.00211.x
Tannehill, I. R. (1947). Drought, Its Causes and Effects. Princeton, NJ: Princeton Univer-
sity Press.
Thao, P. T. P., Thu, P. M., Giam, N. M., Duan, H. D., & Long, B. H. (2018). Relationship
between Drought and Rainfall Due to Tropical Cyclone and Depression in Ninh
Thuan, Vietnam. Current Journal of Applied Science and Technology, 30, 1-8.
Theil, H. (1950). A Rank-Invariant Method of Linear and Polynomial Regression Analy-
sis, Part I; Confidence Regions for the Parameters of Polynomial Regression Equations.
Proceedings of the Royal Netherlands Academy of Sciences, 53, 386-392.
Thornthwaite, C. W. (1948). An Approach toward a Rational Classification of Climate.
DOI: 10.4236/ajcc.2021.101004 82 American Journal of Climate ChangeN. H. Tuan, T. T. Canh
Geographical Review, 38, 55-94. https://doi.org/10.2307/210739
Tian, Q., Wang, Q., Zhan, C., Li, X., & Liu, X. (2012). Analysis of Climate Change in the
Coastal Zone of Eastern China, against the Background of Global Climate Change over
the Last Fifty Years: Case Study of Shandong Peninsula, China. International Journal of
Geosciences, 3, 379-390. https://doi.org/10.4236/ijg.2012.32042
Tigkas, D., Vangelis, H., & Tsakiris, G. (2015). DrinC: A Software for Drought Analysis
Based on Drought Indices. Earth Science Informatics, 8, 697-709.
https://doi.org/10.1007/s12145-014-0178-y
Tigkas, D., Vangelis, H., & Tsakiris, G. (2017). An Enhanced Effective Reconnaissance
Drought Index for the Characterisation of Agricultural Drought. Environmental
Processes, 4, 137-148. https://doi.org/10.1007/s40710-017-0219-x
Tigkas, D., Vangelis, H., & Tsakiris, G. (2020). Implementing Crop Evapotranspiration in
RDI for Farm-Level Drought Evaluation and Adaptation under Climate Change Con-
ditions. Water Resources Management, 34, 4329-4343.
https://doi.org/10.1007/s11269-020-02593-6
UN Water (2015a). Proceedings of the Regional Workshops on Capacity Development to
Support National Drought Management Policies for Eastern and Southern Africa and
the Near East and North Africa Regions. UN-Water Decade Programme on Capacity
Development (UNW-DPC) United Nations University, Bonn, Germany: UNW-DPC.
UN Water (2015b). Synthesis: Capacity Development to Support National Drought Man-
agement Policies. UN-Water Decade Programme on Capacity Development (UNW-DPC)
United Nations University, Bonn, Germany: UNW-DPC.
UNDP (2012). Drought Risk Management: Practitioner’s Perspectives from Africa and
Asia. United Nations Development Programme, United Nation, United Nations Office
at Nairobi, Publishing Services Section, ISO 14001:2004-certifed.
UNESCO (2014). Ntegrated Drought Risk Management—DRM National Framework for
Iraq: An Analysis Repo (2nd Edition SC/2014/REPORT/H/1, p. 143). Iraq: UNESCO
Office. http://unesdoc.unesco.org/images/0023/002330/233093e.pdf
UNISDR (2009). Drought Risk Reduction Framework and Practices: Contributing to the
Implementation of the Hyogo Framework for Action. United Nations Secretariat of the
International Strategy for Disaster Reduction (UNISDR), Geneva, Switzerland, in
partnership with the National Drought Mitigation Center (NDMC), University of Ne-
braska-Lincoln, Lincoln, Nebraska, USA.
Weltbank (Ed.) (2006). Overcoming Drought: Adaptation Strategies for Andhra Pradesh,
India. World Bank.
Wilhite, D. A. (2000). Drought as a Natural Hazard: Concepts and Definitions. In D.
Wilhite (Ed.), Drought: A Global Assessment (Vol. 1, pp. 3-18). London: Routledge.
Wilhite, D. A., & Glantz, M. H. (1985). Understanding: Drought Phenomenon: The Role
of Definitions. Water International, 10, 111-120.
https://doi.org/10.1080/02508068508686328
Wilhite, D. A., & Glantz, M. H. (1987). Understanding the Drought Phenomena: The
Role of Definitions. In D. A. Wilhite, & W. E. Easterling (Eds.), Planning for Drought:
Towards a Reduction of Societal Vulnerability (pp. 11-27). Boulder, CO: Westview
Press.
WMO (2012). Standardized Precipitation Index User Guide. World Meteorological Or-
ganization.
WMO (2014). World Meteorological Organization (WMO) and Global Water Partner-
ship (GWP) National Drought Management Policy Guidelines: A Template for Action
DOI: 10.4236/ajcc.2021.101004 83 American Journal of Climate ChangeN. H. Tuan, T. T. Canh
(D.A. Wilhite). Integrated Drought Management Programme (IDMP) Tools and
Guidelines Series 1. World Meteorological Organization; Global Water Partnership.
Zhou, J., Wang, Y., Su, B., Wang, A., Tao, H., Zhai, J., Kundzewicz, Z. W., & Jiang, T.
(2020). Choice of Potential Evapotranspiration Formulas Influences Drought Assess-
ment: A Case Study in China. Atmospheric Research, 242, Article ID: 104979.
https://doi.org/10.1016/j.atmosres.2020.104979
DOI: 10.4236/ajcc.2021.101004 84 American Journal of Climate ChangeYou can also read


