Analysis of U.S. News & World Report Undergraduate Rankings, Scores, and Metrics - SMU
←
→
Page content transcription
If your browser does not render page correctly, please read the page content below
The Spivey Consulting Group, LLC
info@spiveyconsulting.com
(703) 624-7205
500 Elmington Ave., #320
Nashville, TN 37205

Analysis of U.S. News & World
Report Undergraduate Rankings,
Scores, and Metrics

Southern Methodist University
December 2, 2019
_________________________
I. Understanding the U.S. News Ranking System
The U.S. News & World Report (henceforth “USNWR” or “U.S. News”) Best Colleges Rankings methodology
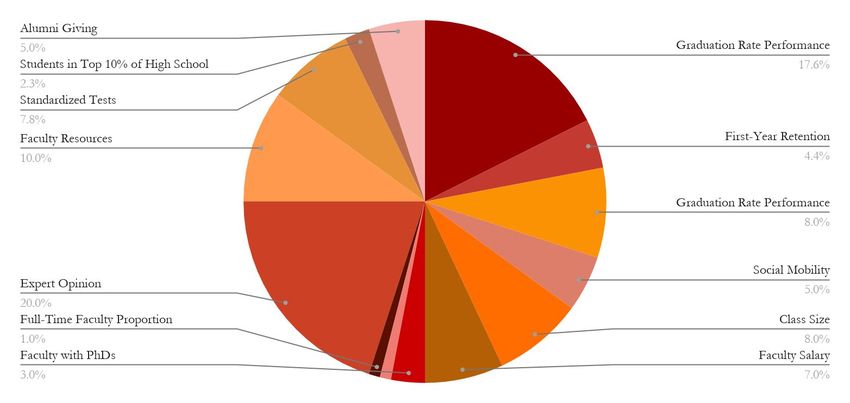
is simultaneously clear and cloudy. Its formula can be found here. Visually represented, the assignment of
weight to each score category is represented below.
Figure 1. U.S. News Raw Score Breakdown
Though this may seem straightforward, U.S. News does not publish what goes into each of these categories.
While it is impossible to know their exact methods for certain metrics, and thus impossible to replicate
perfectly, we can confidently and with a great deal of accuracy model and forecast most components of the
rankings and generate a very close approximation of overall score.
Further, the visual weighting shown above is somewhat deceiving due to the way U.S. News standardizes and
scales each piece of data. Taken literally, one would assume that a raw score would reflect that each piece of
data contributed their respective percentage to overall score—faculty salary making up 7% of the raw score,
retention making up 4.4%, expert opinion making up 20%, etc.—similarly to how one might calculate an
overall grade for a course from a number of assignments with different weights. That is not the case. Within
each score factor, U.S. News scales and standardizes scores, and then weighs the resulting scores by
their factor’s respective percentile. Unlike in our example of finding a grade for a course from a number of
assignments, in the U.S. News formula, it is quite possible to achieve “grades” above 100% or below 0% for
each given factor. In fact, this is quite common. This distorts the expected “weight” versus actual
contribution of each factor, in many cases quite drastically. If a school reports far above average faculty salary
________________________________________
PRIVILEGED AND CONFIDENTIAL — FOR SMU USE ONLY — PAGE 2_________________________
for example, that factor may make up 8% of that school’s raw score, or 10%, or 15%. If it reports a below
average faculty salary, that factor may make up 4% or 5% of their raw score—rather than the 7% one might
assume from a cursory understanding of U.S. News rankings methodology.
Ultimately, scores well above the average for each factor are thus strongly rewarded, while scores below the
average are severely punished. The rewards—or punishments—are stronger the larger or smaller the factor
weight is, in accordance to the score multiplier factor shown in the pie chart above. It is this understanding
that is key: schools that are the most highly ranked are those that have scored significantly above their
competitors in a few key elements. And when examining why one or a few schools are ranked above
another, it usually comes down to just a few specific categories wherein the higher ranked school
outperformed both the national average, and those schools it is closely ranked to.
Princeton is a fantastic example of this. In most other categories, Princeton is in close competition with its
similarly ranked schools (Harvard, Yale, Columbia, etc.). However, in the Alumni Giving category Princeton
is over six standard deviations above the national average—almost two standard deviations above
second-place Dartmouth. This incredible overperformance helps Princeton secure its number one spot. More
broadly, you see this effect for most top undergraduate schools in the Instructional Budget category, where
their incredible spending separates them from the rest of the top but not quite elite schools.
It is important to recognize what this means for an individual school’s ranking. A school will not go up in the
rankings simply by improving certain metrics—the improvement must be above and beyond what the overall
average improvement was, and that of the school’s close ranking competitors.
________________________________________
PRIVILEGED AND CONFIDENTIAL — FOR SMU USE ONLY — PAGE 3_________________________
II. Overview
In this report, we will address each of the components of the U.S. News and World Report raw score, then
examine in greater depth the factors that make up SMU’s performance in each of these components and how
SMU can use these insights to improve the school’s standing in the future.
We will examine SMU’s ranking through comparison with two groups: Similarly Ranked Schools (or “U.S.
News Peer Schools”), and the full list of U.S. News ranked schools.
Similarly Ranked Schools
We will count U.S. News Peer Schools as those schools whose raw score was +/-1 from SMU’s own raw
score of 59. This included a total of 11 schools, listed below:
Table 1. U.S. News Similarly Ranked Schools & Raw Scores
School U.S. News Raw Score
Rutgers University 60
University of Washington 60
SMU 59
Loyola Marymount University 59
University of Maryland–College Park 59
University of Massachusetts–Amherst 59
Worcester Polytechnic Institute 59
University of Connecticut 59
Texas A&M University–College Station 58
George Washington University 58
Clemson University 58
University of Minnesota–Twin Cities 58
________________________________________
PRIVILEGED AND CONFIDENTIAL — FOR SMU USE ONLY — PAGE 4_________________________
Why compare SMU to these schools, versus for instance similarly-ranked colleges in SMU’s region, or other
school similar applicants may be considering? We have chosen to use these schools as benchmarks because
they can help illustrate how particular over or underperformance in certain ranking factors can result in
ranking results, and illuminate why SMU is ranked where it is.
All USNWR National Universities
Further, we will spend a significant amount of our analysis focused on how SMU performs compared to all
national universities. This category will not necessarily yield insight into how SMU performs relative to direct
rankings competitors, but it can help shed light on how SMU’s score is composed, and why certain factors
may not be contributing in the way one may expect them to. Ultimately, SMU is competing against all
national universities- because it is competing to be as far above the average as possible.
________________________________________
PRIVILEGED AND CONFIDENTIAL — FOR SMU USE ONLY — PAGE 5_________________________
III. Analysis of Metrics
1. Graduation and Retention Rates
The Graduation and Retention Rate scoring category is made up of two components: the six-year graduation
rate, and the freshman retention rate. Overall, this category is given a 22% weighting in the USNWR
formula—the largest overall category weighting.
AVERAGE 6-YEAR GRADUATION RATE
This category measures the average graduation rate over a six-year period of the four classes for that period;
in the 2020 rankings, the classes entering in 2009-2012 were measured. The Average Graduation Rate is given
an 80% weight in this category, which translates to a 17.6% actual weight in the overall USNWR score.
SMU had an average six-year graduation rate of 79.25% for the 2020 rankings. This single factor is by far the
largest contributor to SMU’s overall USNWR rank, accounting for about 29% of SMU’s overall score.
Table 2. SMU Average Graduation Rate vs. Similarly Ranked and All National Schools
School/Group Average Graduation Rate SMU Ranking within Group
SMU 79.25% N/A
Similarly Ranked 82% 10th of 12 (tie)
All National Schools 63.1% 84th (tie)
SMU slightly underperforms the average of similarly ranked schools—not by a concerning amount, but
enough that it does impact rank. If SMU were to have an average graduation rate of 82%, the same as the
average for similarly ranked schools, its overall USNWR score would increase by 5%.
One important note for SMU is that Average Graduation Rate at all National Universities has been increasing
annually for the past several years. In fact, since the 2016 rankings the overall average among National
Universities has increased by 2.5%. You can see this clearly in the chart below.
________________________________________
PRIVILEGED AND CONFIDENTIAL — FOR SMU USE ONLY — PAGE 6_________________________
Figure 2. Average Graduation Rate for All National Universities Over Time
Thus far SMU has done an admirable job of keeping up with this rate—especially commendable as SMU has
been “keeping up” from a higher starting point than the national average, which always makes further
improvement more difficult. Unfortunately for SMU, it cannot afford to let up any focus in this category,
especially given how important this category is to SMU’s overall USNWR ranking. If SMU were to “stand
still” here—or worse, decrease—its overall score contribution from this category would decline as the
national average increases.
FRESHMAN RETENTION RATE
Freshman Retention Rate is assigned a 4.4% weight in the USNWR score.
SMU had a 90.75% freshman retention rate in the 2020 rankings. Freshman Retention has a positive
contribution to SMU’s overall score, accounting for approximately 7% of SMU’s score.
Table 3. SMU Freshman Retention Rate vs. Similarly Ranked and All National Schools
School/Group Freshman Retention Rate SMU Ranking within Group
SMU 90.75% N/A
Similarly Ranked 92.8% 7th of 12 (tie)
All National Schools 82.3% 82nd (tie)
________________________________________
PRIVILEGED AND CONFIDENTIAL — FOR SMU USE ONLY — PAGE 7_________________________
While SMU does underperform here relative to its similarly ranked peers, this underperformance does not
have a significant impact on its rank. Improving to the average of similarly ranked schools would only
increase SMU’s overall USNWR score by about 1%—and while this would be enough to increase SMU’s
actual rank, it would only do so by a small amount (the exact number would depend on certain tiebreakers
and rounding done by USNWR).
SMU has also been able to bring its average freshman retention rate up over time. In the past 10 years, this
rate has increased by 2.75% and has not seen a single year-over-year decline. This is helpful as freshman
retention rates have been increasing nationally over that timeframe as well (among all nationally ranked
schools, the increase has been 2.1% over the ten year period). As SMU outpaces this increase, it has been able
to increase its score in spite of the inflation in these rates.
2. Expert Assessment Score
The Expert Assessment Score is assigned a 20% weight in the USNWR undergraduate rankings. While certain
other categories have a larger collective weight, the Expert Assessment is assigned the largest sole weight for
any individual factor. This makes Expert Assessment Score particularly important.
EXPERT ASSESSMENT SCORE DATA
SMU scored a 3.3/5 on the most recent USNWR survey of Expert Assessment Scores. Among SMU’s
Similarly Ranked schools, this was somewhat low, placing SMU tied for 9th of 12.
Table 4. SMU Expert Assessment Score vs. Similarly Ranked and All National Schools
School/Group Average Expert Assessment Score SMU Ranking within Group
SMU 3.3 N/A
Similarly Ranked 3.5 9th of 12 (tie)
All National Schools 2.8 78th (tie)
This is a notable underperformance amongst SMU’s peers, and a higher score in this category would be very
helpful for SMU’s rank—increasing even by just 0.1 (to 3.4) would increase SMU’s overall USNWR score by
about 6%.
________________________________________
PRIVILEGED AND CONFIDENTIAL — FOR SMU USE ONLY — PAGE 8_________________________
At present, SMU derives approximately 26% of its overall score from its Expert Assessment score. Expert
Assessment is an incredibly important contributor to the school’s rank, and recent rises here have helped
buttress SMU’s overall score from the negative impacts of the newly introduced Social Mobility factors.
EXPERT ASSESSMENT SCORE ANALYSIS
Since the 2018 rankings, SMU’s Expert Assessment score has risen by 0.2—an increase of 0.1 in 2019 and an
additional increase of 0.1 in 2020. Prior to this increase, SMU’s Expert Assessment score had maintained a
relatively tight, consistent range between 2.9 and 3.1. Normally when Expert Assessment Scores show an
increase in a single year, it can be attributed to nothing more than statistical noise, and the scores tend to
return to their usual band shortly. However, two consecutive years of improvement out of the prior band of
2.9-3.1 is encouraging—this indicates SMU may have found a new “floor” for its Expert Assessment Score in
the 3.1-3.2 range. It is very possible that SMU will maintain the current 3.3 score for the 2021 rankings,
though we caution that there may be some correction to the 3.2 range.
The other good news regarding Expert Assessment is that the national average tends to change fairly
minimally from year to year, or even in the long term:
Figure 3. Average Expert Assessment Score of All National Universities Over Time
As you can see, the national average stays in a fairly confined range (last year’s change can be attributed to an
influx of newly ranked National Universities). This helps any school—such as SMU—that has seen increases
in its own average Expert Assessment. Recall that USNWR component scores are generated by determining
how well the school does in relation to other schools. Because Expert Assessment is not subject to the same
________________________________________
PRIVILEGED AND CONFIDENTIAL — FOR SMU USE ONLY — PAGE 9_________________________
inflationary effects as other scoring factors (such as test scores, instructional budget, etc.), growth over time
tends not to be diluted by corresponding growth in other national universities.
There has been some question as to whether aggressive marketing to the USNWR voters is an effective way
of increasing Expert Assessment score. Unfortunately, there are no voter-specific studies that can shed light
on whether marketing techniques impact their behavior, and we are left to review informal case studies of
schools that have engaged in such methods. Northeastern is one example of a school that seems to have been
doing this.
In the 2005 rankings, Northeastern’s Expert Assessment Score was a 3.0, compared to its current score of
3.5. 0.3 of those 0.5 points, or 60% of its improvement over this period, came in the 2017-2020 timeframe, by
which point the school’s overall USNWR rank had grown from 120 to 39 thanks to its efforts to improve
other aspects of its ranking. We feel it is equally plausible that the growth in Expert Assessment score at
Northeastern was simply reflective of the school’s growth in overall rank rather than a driving factor in it.
Essentially, it is likely that the perception of USNWR voters “caught up” to Northeastern’s new and
improved rank and the Expert Assessment Scores began to reflect this. It’s also worth noting that
Northeastern did not simply market to USNWR voters, it also engaged in ambitious new programs:
significant campus construction, a well publicized effort to dramatically increase school endowment, securing
large donations for “naming rights” at certain of the schools colleges, and the hiring of prominent faculty and
staff.
While we doubt that marketing a school to USNWR voters would have any negative effect, it is questionable
e more useful in SMU’s case as a way of solidifying
if this is a useful investment of school resources. It may b
the school’s recent gains in average Peer Assessment score by ensuring their familiarity with SMU, rather than
attempting to catalyze future upward movement.
3. Faculty Resources
Faculty Resources accounts for 20% of the overall USNWR score calculation. This category is split into five
different factors: the percentage of faculty who have a Ph.D, the percentage of faculty who are full time,
average faculty compensation, student-faculty ratio, and a USNWR-calculated number they label “class size
indicator index.”
PERCENTAGE OF FACULTY WITH PH.D
This category measures the percentage of the faculty at an institution who hold a Ph.D or other terminal
degree. It is assigned a 3% overall weight in the USNWR total score computation.
________________________________________
PRIVILEGED AND CONFIDENTIAL — FOR SMU USE ONLY — PAGE 10_________________________
For the 2020 rankings, SMU reported a Ph.D and terminal degree percentage of 83.7%. This number was
actually a net negative for SMU’s overall rank (though just barely), reducing the school’s overall score by
approximately 0.3%.
Table 5. SMU Faculty Resources vs. Similarly Ranked and All National Schools
School/Group Percentage of Faculty with Ph.D SMU Ranking within Group
SMU 83.7% N/A
Similarly Ranked 90% 10th of 12
All National Schools 84.3% 218th (tie)
As you can see, SMU significantly underperforms its Similarly Ranked peers, and is below the average of all
National Schools, though only slightly. However, as this category is not heavily weighted, the negative impact
on SMU’s ranking is limited.
PERCENTAGE OF FACULTY WITH PH.D ANALYSIS
Underperformance in this category is not helpful to SMU’s overall score—while the 3% weight is not hugely
substantial, it does make a difference. Bringing SMU into line with its Similarly Ranked peer schools in this
category would be helpful to SMU. Even bringing the percentage up to just a slight underperformance
relative to the school’s peers, bringing it to 89%, would yield an overall score increase of about 2% (the same
as improving average graduation rate by 2.5% or a 3% increase in alumni giving rate).
PERCENTAGE OF FULL-TIME FACULTY
This category measures the percentage of all faculty who are in full-time positions. It is assigned a 1% weight
in the overall score calculation used by USNWR. In the 2020 rankings, SMU reported a full-time faculty
percentage of 85.5%. This contributed about 0.6% of SMU’s overall USNWR score.
Table 6. SMU Percentage of Full-Time Faculty vs. Similarly Ranked and All National Schools
School/Group Percentage Full-Time Faculty SMU Ranking within Group
SMU 85.5% N/A
Similarly Ranked 90% 9th of 12
All National Schools 84.3% 172nd (tie)
________________________________________
PRIVILEGED AND CONFIDENTIAL — FOR SMU USE ONLY — PAGE 11_________________________
SMU does overperform the national average slightly, while underperforming compared to peers. Frankly,
given how small an impact this category has, it is our opinion that it is not worth significant consideration or
concern at this time.
STUDENT-FACULTY RATIO
The student-faculty ratio category tracks the number of students per one faculty member at an institution.
Part-time faculty are included in the calculation, though at a lesser rate. The factor is assigned a 1% weight in
the USNWR rankings calculation.
SMU reported a student-faculty ratio of 11:1 for the 2020 rankings. This ratio contributed approximately
1.6% of SMU’s overall USNWR score.
Table 7. SMU Student-Faculty Ratio vs. Similarly Ranked and All National Schools
School/Group Student-Faculty Ratio SMU Ranking within Group
SMU 11:1 N/A
Similarly Ranked 15.9:1 2nd of 12
All National Schools 14.8:1 61st (tie)
SMU’s performance in this category is quite good. Its ranking among all schools in this factor actually leads its
overall rank, which is the best measurement of whether a given factor is truly contributing to SMU’s overall
score in a positive way. Unfortunately, since it is such a lightly weighted category, the contribution is fairly
minimal.
FACULTY COMPENSATION
This category measures the average compensation for faculty members over the preceding two-year period. It
is worth noting that this factor measures average compensation rather than median compensation—therefore a
concentration of faculty members with very high compensation or a concentration of faculty members with
very low compensation can raise or lower performance in this category significantly. This factor is assigned a
7% overall weight in the ranking formula.
SMU reported an average faculty compensation of $176,834.59 for the 2020 rankings formula. This is an
incredibly high number relative to both Similarly Ranked peers and the larger pool of all national universities,
and as such this factor accounts for a full 14% of SMU’s overall USNWR score.
________________________________________
PRIVILEGED AND CONFIDENTIAL — FOR SMU USE ONLY — PAGE 12_________________________
Table 8. SMU Average Faculty Compensation vs. Similarly Ranked and All National Schools
School/Group Average Faculty Compensation SMU Ranking within Group
SMU $176,834.59 N/A
Similarly Ranked $159,017.6 2nd of 12
All National Schools $133,551.90 42nd
FACULTY COMPENSATION ANALYSIS
This category is a significant source of rankings strength for SMU. SMU receives almost twice as much of its
actual score from this category as is “indicated” by the 7% weight assigned in the rankings formula.
There is a degree of inflation over time that occurs with this factor, which is only natural given real-world
monetary inflation placing pressure on universities to continue increasing faculty compensation. Over the last
four years, average faculty compensation at national universities has increased by slightly over $8,000. This
has not negatively impacted SMU, however, because SMU has seen an increase of about $14,000 over this
same time period. As such, SMU has outpaced the growth in national averages, and the contribution of
Faculty Compensation to SMU’s overall score has increased in turn.
This is a category where, quite simply, money buys rank. There is certainly room to grow in this field as every
added dollar makes a ranking difference. It becomes a question of resource investment—and there may be
other areas where those expenditures can more easily benefit ranking. We will discuss other options for where
money might best be spent later in this report.
CLASS SIZE INDEX
Class size index is the one factor in the USNWR rankings where it is unfortunately not possible to precisely
calculate how it impacts scoring. It can be estimated, using the overall rank in this category—especially
because SMU is neither significantly above nor below the average, so any distortions are likely smoothed
out—but not precisely replicated. This also makes it quite difficult to analyze it in depth.
Class size index is USNWR’s formula to determine, essentially, what the average size of a given class section
is—10 students per class, 15, 45, etc. USNWR steadfastly refuses to provide additional information on how it
calculates this index, but has given the following high level guidance:
The percentage of undergraduate class sections with fewer than 20 students scores highest; the percentage
with 20-29 students, second highest; the percentage with 30-39 students, third highest; the percentage with
40-49 students, fourth highest; and any classes with 50 or more students receive no credit.
________________________________________
PRIVILEGED AND CONFIDENTIAL — FOR SMU USE ONLY — PAGE 13_________________________
As you can see, the greater the proportion of classes with small groups of students, the better a given
university will score. This factor has a 40% weight in the category, giving it an overall USNWR weight of 8%.
SMU ranked 137th in the 2020 rankings in this category.
4. Student Excellence
USNWR combines two factors to calculate the Student Excellence category: the percentage of an entering
class in the top ten percent of their high school graduating class, and a composite calculation of the average
SAT Evidence-Based Reading, Math, and ACT scores. Overall, the Student Excellence category is assigned a
10% weight in the USNWR rankings formula.
TOP-TEN PERCENT HIGH SCHOOL GRADUATION
This category measures the percentage of an entering class who graduated in the top ten percent of their high
school class. It is assigned a 2.25% weight in the rankings formula.
In the 2020 rankings, SMU reported that 49% of its entering class were in the top ten percent of their high
school graduating class. This contributes about 2.3% of SMU’s total USNWR score.
Table 9. SMU Top-Ten Percent High School Graduation vs. Similarly Ranked and All National Schools
School/Group Top-Ten Percent SMU Ranking within Group
SMU 49% N/A
Similarly Ranked 53% 9th of 12
All National Schools 34.7% 71st (tie)
TOP-TEN PERCENT HIGH SCHOOL GRADUATION ANALYSIS
SMU does not significantly underperform in this category; however, compared to test score composites,
which we will discuss next, SMU does not achieve the same level of performance in this measure of student
excellence. This is an area for SMU to consider exploring; this factor does not suffer from inflation (a result
of the natural limit on the number of top-ten percent high school graduates), and thus any increases SMU is
able to make will not be diluted by corresponding increases at peer institutions.
TEST SCORES
The test score factor measures the averages of incoming freshman class ACT and SAT scores. It is assigned a
7.75% overall weight in the USNWR rankings formula. SMU does extremely well in this category—its
composite test score average, by way of USNWR calculation (which we will discuss shortly) would rank it
________________________________________
PRIVILEGED AND CONFIDENTIAL — FOR SMU USE ONLY — PAGE 14_________________________
40th among all National Universities. While a one-to-one comparison is difficult given the convoluted
calculation formula USNWR uses, SMU receives the 3rd most ranking points from its test score composite of
all similarly ranked universities.
The calculation of test score contribution to overall score is fairly convoluted. First, it is important to
understand that the actual numbers associated with test scores are only important insofar as they correspond
to the score’s corresponding percentile.
Some examples may help clarify this. Imagine we had three entering classes with SAT scores of the following:
School 1: Reading and Writing–710, Math–680
eading and Writing–660, Math–690
School 2: R
School 3: Reading and Writing–650, Math–640
The percentiles associated with the classes’ entering profiles would look as follows:
Table 10. Hypothetical SAT Score Percentile Comparison
Reading/Writing Reading/Writing Math Math Overall
Score Percentile Score Percentile Percentile
School 1 710 97 680 93 95
School 2 660 92 690 94 93
School 3 650 90 640 90 90
The “overall percentile” calculated by USNWR is the average of the Reading/Writing and Math scores, not
the percentiles for “total score” published by USNWR. This is important, as math score percentiles decline
more quickly than reading scores; thus, it is more helpful to keep a high math score raw average than reading.
What about the ACT? Average scores for that test are more straightforward in that USNWR considers the
composite percentage only, not the subsection percentages. The ACT faces the same diminishing returns as
the SAT, however. A one-point improvement from a 25 to a 26 average ACT score corresponds to a 4%
increase in percentage average, but a one-point improvement from a 30 to a 31 average ACT comes with only
half that percentile increase, at 2%. Put simply, the higher the original average score, the lower the return a
school receives for increasing its average score.
________________________________________
PRIVILEGED AND CONFIDENTIAL — FOR SMU USE ONLY — PAGE 15_________________________
USNWR combines the average SAT Reading and Writing, Math, and Composite ACT score percentiles to
generate a total test score average percentile. The proportion each test contributes to overall score is
determined by how prevalent it is in the entering class. For example, a school with a 99th percentile SAT
average would benefit little if that test was used by only a tenth of its entering class. Students who submit
scores for both tests are considered in both averages; thus it is possible to have total test score percentage
submissions that show more than 100% of the class submitting test scores. However, the formula does
account for this, and schools with this effect do not receive any rankings boost from this.
SMU performs very strongly in the test scores category. In fact, SMU’s weighted, combined SAT/ACT rank
would be 40th in the nation, 24 spots above SMU’s overall rank. Indeed, SMU derives about 16% of its raw
score from this single category, despite the category only being given a 7.75% weighting by USNWR. Further,
SMU does superbly in ensuring a diverse, balanced source of score contribution from this category. With
63% of freshman submitting ACT scores and 49% submitting SAT scores, SMU is well protected against
sudden changes in score trends from one test. Further, the SMU SAT and ACT average scores work in
tandem—with an SAT combined average of 93.5% and an ACT composite average of 93%, SMU is not
reliant on one test to bring up the score in this category.
TEST SCORES ANALYSIS
SMU does incredibly well in the test score category, and its growth here has been a key part of keeping a
strong USNWR ranking in the face of other challenges. Unfortunately, further improvement is unlikely to
yield significant rankings improvement, as discussed above. This is due to the nature of diminishing returns in
the upper echelons of test scores. At the level where SMU’s incoming class is currently performing, each
additional point added to SMU’s average test score does less and less for its overall rank.
By way of example, here is what SMU’s combined SAT percentile would look like with a 20-point
improvement to both Reading and Math averages.
Table 12. SMU Percentile Improvement with Aspiration 20-Point Increase in SAT Scores
Reading/Writing Reading/Writing Math Score Math Percentile Overall
Score Percentile Percentile
Aspirational 690 96 710 96 96
SAT Scores
Southern 670 93 693 94 93.5
Methodist
University
________________________________________
PRIVILEGED AND CONFIDENTIAL — FOR SMU USE ONLY — PAGE 16_________________________
And here is an example of a school, starting somewhat lower than SMU in averages, would see with a
20-point improvement in both Reading and Math.
Table 13. Hypothetical Percentile Improvement with 20-Point Increase in SAT Scores
Reading/Writing Reading/Writing Math Score Math Percentile Overall
Score Percentile Percentile
20 Point 640 88 650 90 89
Improvement
Starting 620 84 630 87 85.5
Average
Scores
You will notice that the school starting with 620 and 630 Reading and Math scores improved 3.5% overall,
compared to SMU’s 2.5% overall improvement—despite the same 20 raw point increase in averages. This
2.5% improvement in SMU’s average would in turn yield only a 0.15% overall increase to its overall USNWR
score.
Both the ACT and SAT experience this same diminishment, albeit at different intervals as the tests are scored
differently. Since the ACT is on a tighter scale, the inflation tends to be more marginal in raw score;
ultimately, the effect is the same.
The other challenge for SMU comes from the fact that, while it increases its own test scores, so do its peers.
Last year, for example, the average composite SAT score at National Universities went up over 10 points.
ACT averages move in much smaller increments (due to the tighter scoring scale) but have also been
increasing. Much like monetary inflation, this growth in national average diminishes the benefit SMU derives
from its own increases. This creates an unfortunate reality: SMU must continue to increase its test scores in
order to “keep up” with this inflation, but cannot realistically rely on test score increases to drive growth in
the rankings, thanks to the diminishing marginal returns to test scores at the higher end of the scale.
To illustrate this point, consider the following hypothetical: imagine SMU, overnight, had the highest
aggregate test score average of all National Universities. Its overall USNWR score would only grow by
approximately 6%. While this would certainly improve SMU’s overall rank, it would not be likely to yield a
top 50 ranking. Overall, relying on this category to grow rankings is the equivalent of trying to squeeze blood
from a stone.
________________________________________
PRIVILEGED AND CONFIDENTIAL — FOR SMU USE ONLY — PAGE 17_________________________
5. Financial Resources
This category has only one factor: the average expenditure per student for instruction, research, student
services, and related educational expenditures over the preceding two year period. This category is assigned a
10% overall weight in the USNWR formula.
SMU reported $44,570 in average educational expenditures per student in the 2020 rankings. This contributed
about 4% of SMU’s overall USNWR score.
Table 14. SMU Financial Resources vs. Similarly Ranked and All National Schools
School/Group Average Educational Expenditures SMU Ranking within Group
SMU $44,570 N/A
Similarly Ranked $44,185 6th of 12
All National Schools $37,285 72nd
As you can see, SMU is just about in line with its similarly ranked peers, and is above average compared to the
overall pool.
ANALYSIS
While SMU is above the average of all National Universities for Instructional Spending, it is only above by
about a quarter of a standard deviation. This category is tremendously top heavy, with just a few top
universities spending massive amounts per student compared to the rest of the pool, and this leads to
extremely skewed averages and standard deviations.
SMU actually outperforms most of its Similarly Ranked universities, showing that SMU is not really
underperforming its actual rank. This category is also not necessarily one in which SMU would benefit from a
specific focus. Because the standard deviation in this category is so large, even large increases in expenditures
have a somewhat diluted impact on rankings. By way of example, suppose SMU were to increase its average
expenditures per student to $50,000. Its overall USNWR score would only increase by slightly less than
3%—an expensive proposition for a very modest gain. While there are universities that obtain a tremendous
rankings advantage from this category, they are each spending well into six figures per student in order to do
so.
________________________________________
PRIVILEGED AND CONFIDENTIAL — FOR SMU USE ONLY — PAGE 18_________________________
One important note regarding this category is that it, like many of the factors going into USNWR rankings
(especially the monetary factors), experiences inflation over time. See the below chart for a visual of how the
average expenditures at national universities has changed over the years.
Figure 4. National Average Expenditures Over Time
While SMU has thus far outpaced increases in the overall average, it has only done so by 15%, meaning that
its raw expenditure increase over this period has not translated to quite as much of a rankings benefit as
might be expected if the national average were static.
6. Graduation Rate Performance
Graduation Rate Performance measures the ratio between actual 6-year graduation rate for a single cohort (in
the 2020 rankings, the 2012 entering class was measured) compared to what USNWR predicted for that class’
graduation rate. This factor is assigned an 8% weight in the U.S. News rankings.
In the 2020 rankings, SMU had a 78% actual graduation rate. Compared to its predicted graduation rate of
80%, SMU’s Graduation Rate Performance was 97.5%. This performance is a serious net negative for SMU;
its negative pull on the overall raw score is the approximate equivalent of entirely negating SMU’s score
contribution from the High School Top 10% factor and the Full-Time Faculty Percentage factor.
Table 15. SMU Graduation Rate Performance vs. Similarly Ranked and All National Schools
School/Group Graduation Rate Performance SMU Ranking within Group
SMU 97.5% N/A
Similarly Ranked 105.3% 10th of 12
All National Schools 100.1% 222nd (tie)
________________________________________
PRIVILEGED AND CONFIDENTIAL — FOR SMU USE ONLY — PAGE 19_________________________
UNDERSTANDING PREDICTED GRADUATION RATE
In order to understand why SMU does poorly in Graduation Rate Performance despite an objectively strong
actual graduation rate, it is important to understand how USNWR creates its predictions. Reproduced below
is the formula USNWR follows to calculate Predicted Graduation Rate for National Universities like SMU:
45.801 + (0.879 * expenditures per student) + (0.387 * mean standardized test scores) -
(1.89*10^-5)*(mean standardized test scores^3) + (0.354 * top 10% class proportion) - (0.236 *
Pell proportion) - (.446 * 1st Gen proportion) - (0.029 * STEM degree proportion)
This formula is unfavorable for SMU. The formula starts with a “base” graduation rate of 45.801%, then
different variables are then used to increase or discount the final predicted graduation rate for a specific
school. Below, we discuss each of the factors that go into this final predicted graduation rate:
The formula multiplies the natural log value of the average expenditure per student and adds it to that base
rate. In this variable, having higher average expenditures per student increases the final predicted graduation
rate—which increases the predicted graduation rate.
first it multiples the weighted average
The formula has two calculations for the entering class test scores—
percentile by 0.387, then it reduces that somewhat by multiplying the cubed weighted average against a
fractional constant of 0.0000189. Higher average test scores (such as those that make up SMU’s incoming
classes) significantly increase the predicted graduation rate.
The formula also adds to the predicted graduation rate by multiplying the percentage of the incoming class in
the top tenth of their high school graduating class by 0.354. The more highly ranked high school graduates a
school admits, the higher its predicted graduation rate.
The formula then discounts the predicted graduation rate by several factors:
The five-year average of students receiving federal Pell Grants is multiplied by 0.236. The resulting figure is
then subtracted from the predicted graduation rate. A higher number of Pell Grant recipients means a lower
predicted graduation rate.
The formula then considers the proportion of students who are first-generation college students. It multiplies
that percentage by 0.446, then subtracts the resulting number from the overall predicted graduation rate.
Having more first-generation students yields a greater discount on final predicted graduation rate.
The final variable considered is the percentage of STEM-pursuing students in the school’s class. This
percentage is multiplied by 0.029 and subtracted from the overall predicted graduation rate. A greater
proportion of STEM-pursuing students means a lower predicted graduation rate.
________________________________________
PRIVILEGED AND CONFIDENTIAL — FOR SMU USE ONLY — PAGE 20_________________________
ANALYSIS OF PREDICTED GRADUATION RATE
From a rankings perspective, a school’s predicted graduation rate inputs would ideally be such that they yield
a lower predicted graduation rate, as this will help a school perform well in the Graduation Rate Performance
factor. Consider two schools, both with actual graduation rates of 75%. School 1, with a predicted graduation
rate of 80%, will have a Graduation Rate Performance of 93.75%, while School 2, with a predicted graduation
rate of 90%, will yield a far lower Graduation Rate Performance rate of 83.3%.
The problem for SMU is that it does very “well” in the factors that increase predicted graduation rate, and
“poorly” in the factors that discount it.
SMU does very well in average expenditures and test score averages, and to a lesser extent it also does well in
high school graduation performance. These factors, which increase predicted graduation rate, are also areas
where SMU has been improving over the last several years above and beyond the national average. This is
problematic for future rankings, as these factors are measured on a time delay—thus the predicted graduation
rate of 2020 rankings is based on the performance in these factors from the past several years. Because SMU
has done so well improving these areas into the present, its future predicted graduation rate will continue to
grow.
SMU also does poorly in the areas that discount predicted graduation rate. In particular, SMU has among the
lowest proportions of first-generation students and Pell Grant recipients among all national universities. This
is deeply damaging to SMU’s predicted graduation rate. Where its peers receive deep discounts to their
predicted graduation rates thanks to higher percentages of these types of students in their class, SMU receives
a comparatively miniscule percentage.
ANALYSIS OF GRADUATION RATE PERFORMANCE
Essentially, SMU’s challenge is that it spends a considerable amount of money on educating its students and
admits an extremely high quality incoming class as measured by test scores and high school performance, but
it does not bring in a high proportion of low-income or first-generation students. This yields a very hard to
achieve Predicted Graduation Rate.
Furthering this challenge, because the factors that go into calculating predicted graduation rate are measured
on a time-lag, it will be hard for SMU to achieve any immediate improvements. In fact, by spending the last
several years improving its incoming class profiles as measured by average test scores and high school
performance, SMU has unfortunately also been increasing the predicted graduation rate calculated by
USNWR and thus making it much more difficult to perform well in Graduation Rate Performance.
The opportunity for future rankings benefits from this category are tremendous. By improving its Graduation
Rate Performance to just below the average of similarly ranked universities—about a 105%—SMU could
increase its overall USNWR score by about 10%, the equivalent of having the highest average test scores in
the country and increasing the percentage of the incoming class in the top 10% of their high school to 70%. It
________________________________________
PRIVILEGED AND CONFIDENTIAL — FOR SMU USE ONLY — PAGE 21_________________________
is certainly possible to improve Graduation Rate Performance by improving just actual graduation rate—but
the easier and safer path is to improve both actual graduation rate and predicted graduation rate.
7. Alumni Giving Rate
USNWR’s Alumni Giving Rate metric measures the percentage of living alumni who made donations during
the preceding two year period. This factor is assigned a 5% weight in the overall score calculation.
In the 2020 rankings, SMU had an alumni giving rate of 18.1%. This category is an exceptionally strong
performer for SMU, contributing over 9% of SMU’s overall USNWR score.
Table 16. SMU Alumni Giving Rate vs. Similarly Ranked and All National Schools
School/Group Alumni Giving Rate SMU Ranking within Group
SMU 18.1% N/A
Similarly Ranked 11.8% 3rd of 12
All National Schools 9.7% 43rd (tie)
As you can see, SMU has almost double the average alumni giving rate among national universities. It also
significantly outscores most similarly ranked national universities.
ANALYSIS
Alumni giving at SMU peaked in the 2017 rankings, and has declined somewhat since then. The effects of this
decline have been somewhat muted by the fact that average alumni giving rates nationwide are on the decline,
as you can see below.
Figure 5. National Average Alumni Giving Rate Over Time
________________________________________
PRIVILEGED AND CONFIDENTIAL — FOR SMU USE ONLY — PAGE 22_________________________
This factor does contribute an outsized amount of SMU’s overall score, making SMU vulnerable to a sudden
decline in alumni giving. A decline in SMU’s average alumni giving rate to 15% would yield a decline in
SMU’s overall raw score of about 3.5%. 15% would still be a significant overperformance compared to the
average, but it shows how vulnerable SMU’s overall score could be to rapid declines in this factor.
8. Social Mobility
The recently introduced Social Mobility category is designed to measure how well universities perform at
helping students coming from less advantaged backgrounds. This category is comprised of two factors: Pell
Grant Graduation Rate, and the more complex Comparative Pell Grant Graduation Rate. The category as a
whole is assigned a 5% weight in the USNWR formula, and each of the two sub-factors are assigned 50% of
the total, i.e. each one is given a 2.5% overall weight.
Before examining each factor, first it is important to understand how U.S. News weighs each proportional
Pell Grant student population. Each sub-factor—for example, the simple Pell Grant graduation rate—is
adjusted to reflect the proportion of Pell Grant students in the university. The higher the proportion of Pell
Grant recipients at a university, the more “credit” they receive in each sub-factor for this category. The lower
the proportion of Pell Grant Recipients, the harder it is for a school to perform well in this category.
Consider the following scenarios:
School 1: Pell Grant Graduation Rate 85%, Pell Grant Student Population 14%
School 2: Pell Grant Graduation Rate 68%, Pell Grant Student Population 42%
Despite having a significantly lower Pell Grant graduation rate, School 2 would have over double the adjusted
Pell Grant graduation rate used for the USNWR scoring formula, and thus have a much higher score
contribution from this category.
Simply put, the universities that enroll higher numbers of Pell Grant students have a tremendous advantage
over those universities enrolling smaller numbers of Pell Grant students. By way of example, each of the
bottom 10 schools in the simple Standard Pell Grant Graduation Rate category had Pell Grant enrollment of
less than 13%, while in the top 10 performing schools, none had a Pell Grant enrollment rate of less than
36%. SMU, with its own Pell Grant proportion standing at about 13%, is seriously disadvantaged in this
category.
PELL GRANT GRADUATION RATE
This factor measures the percentage of students with Pell Grants who graduated (adjusted, as discussed
above, to reflect the proportion of students with a Pell Grant relative to the entire class). For the 2020
USNWR, rankings SMU had a Pell Grant graduation rate of 67%. This rate, by itself, would have tied SMU
for 126th nationally—still a net negative on SMU’s overall rank, but not overly so. The bigger problem for
________________________________________
PRIVILEGED AND CONFIDENTIAL — FOR SMU USE ONLY — PAGE 23_________________________
SMU comes when USNWR factors in the proportion of Pell Grant students at the university. With a value of
13% for SMU, the adjusted Pell Grant Graduation Rate becomes quite low.
Table 17. SMU Adjusted Pell Grant Graduation Rate vs. Similarly Ranked and All National Schools
School/Group Adjusted Pell Grant Graduation Rate SMU Ranking within Group
SMU 8.6% N/A
Similarly Ranked 15.7% 12th of 12
All National Schools 16.8% 356th
This factor is in fact the most negative single weight on SMU’s overall USNWR ranking—subtracting about
7% of its overall USNWR score. The primary responsibility for that comes from SMU’s very low proportion
of Pell Grant students among its class.
COMPARATIVE PELL GRANT GRADUATION RATE
This factor measures the difference between Pell Grant recipient and non-Pell Grant recipient graduation
rates. The USNWR calculation rewards universities where Pell Grant recipients achieve the same or higher
graduation rates than their non-Pell Grant peers; it punishes those universities which have lower rates.
SMU had a 67% Pell Grant Graduation rate, compared to an 80% graduation rate among non-Pell Grant
recipients. This yielded a comparative graduation rate of 83.75%, which is then negatively adjusted further by
SMU’s low proportion of Pell Grant recipients. Like the simple graduation rate discussed earlier, this low
proportion at SMU yielded a very low Comparative Pell Grant Graduation Rate.
Table 18. SMU Comparative Pell Grant Graduation Rate vs. Similarly Ranked and All National Schools
School/Group Comparative Pell Grant Graduation Rate SMU Ranking within Group
SMU 10.75% N/A
Similarly Ranked 15.7% 12th of 12
All National Schools 16.8% 356th
ANALYSIS
The primary challenge SMU faces is its incredibly low proportion of Pell Grant students. So long as this
continues, SMU will be unable to perform well in this category.
________________________________________
PRIVILEGED AND CONFIDENTIAL — FOR SMU USE ONLY — PAGE 24_________________________
Further, SMU should be prepared for even more potential future problems in this category. At present, the
proportion of Pell Grant recipients that is factored into the calculation is capped at 50%. If that cap was lifted
then SMU’s distance to the average would fall, further hurting the school’s performance in these categories.
The comparative Pell vs. non-Pell graduates factor the also has an artificial cap limiting the comparative rate
to 100% (i.e. if Pell Grant recipients graduate at a higher rate that non-Pell Grant recipients, it is counted as
functionally the same as if they graduated at the same rate). If this were lifted, SMU would suffer for the same
reasons as mentioned earlier: an increase in negative distance from the average.
Additionally, U.S. News has indicated that it will likely publish separate rankings for “Social Mobility” that are
based on these factors. If—more accurately, when—they do so, as it stands SMU will do poorly and should
be ready for that. This is more of a public relations concern than an immediate rankings concern however,
though of course the two are never entirely unrelated because of Expert Assessment scores.
The good news is that improvements in this category can be beneficial to SMU- especially so because it is so
far below the average. For example, improving the proportion of Pell Grant Recipients at SMU to 20% would
increase SMU’s overall USNWR score by about 5% just from improvements in the social mobility factor- to
say nothing of the impact had by lowering the predicted graduation rate. That’s without even improving the
actual graduation rate of Pell Grant recipients, which would obviously yield even greater improvement.
Understanding SMU’s Overall Rank
It may be helpful to visualize each score factor and how it differs from SMU’s overall USNWR rank.
Table 19. SMU Rankings Factors Positions vs. Total Ranking
Rankings Factor SMU Factor Approximate Percentage Difference from SMU
Position of SMU Score Total Rank
Simple Graduation Rate 84th +29% -20
Expert Assessment 78th +26% -14
Average Test Scores 40th +17% +24
Average Faculty Salary 41st +14% +23
Alumni Giving Rate 43rd +9% +21
Freshman Retention 85th +7% -21
Rate
Class Size Indicator 137th +7% -73
________________________________________
PRIVILEGED AND CONFIDENTIAL — FOR SMU USE ONLY — PAGE 25_________________________
Average Instructional 72nd +4% -8
Budget
High School 74th +2.3% -10
Performance
Student:Faculty Ratio 61st +1.6% +3
Full-Time Faculty 174th +0.6% -110
Ph.D Faculty 219 -0.3% -155
Graduation Rate 223rd -3% -159
Performance
Pell Comparative 351st -7% -287
Graduation Rate
Pell Graduation Rate 356th -7% -292
Those rankings factors where SMU is dramatically lower than its overall USNWR ranking are a negative
weight on SMU’s USNWR ranking—even if they contribute positively to SMU’s score, they do not
contribute to the degree needed to “boost” SMU’s score above its current position. Conversely, those factors
where SMU’s ranking is above its overall ranking are factors where SMU receives a rankings boost. The
degree of gain or loss to overall rank is of course determined by the categories’ weighting and how far above
or below SMU’s overall ranking the factor is. This is a somewhat simplified way of viewing the factors’
effects, but it is generally accurate. It also does not mean that factors will not have a positive impact in the
future, if they are improved, unless they meet SMU’s overall ranking—any improvement still helps.
As you can see, the three most important factors propping up SMU’s overall ranking are Average Test Scores,
Alumni Giving Rate, and Average Faculty Salary. While there are other factors that contribute, overall, a
greater percentage of SMU’s raw score, they do not do so at a level that meets or exceeds SMU’s actual
rankin, meaning in effect that they are a negative weight on the overall rank.
The most negative factors by difference from overall rank—and also by net impact on raw score—are
Graduation Rate Performance and the two Social Mobility factors. These are of course related, as discussed in
the examination of how graduation rate performance is calculated, and largely relate to low enrollment of Pell
Grant students.
________________________________________
PRIVILEGED AND CONFIDENTIAL — FOR SMU USE ONLY — PAGE 26_________________________
IV. Key Findings
Finding 1: Testing averages are unlikely to further boost rankings
SMU significantly overperforms its ranking in the aggregated Test Score category, which measures ACT and
SAT averages for the incoming class. However, it will be difficult for SMU to continue relying on this
category as a source of positive rankings growth. SMU’s overall test averages in this category are already at the
93rd percentile. Not only is continued growth from such heights difficult in of itself, but it comes with
diminishing rankings returns. Because both the ACT and SAT are scaled tests, and U.S. News measures these
averages on their percentiles not the raw score (1-36 or 0-1600 respectively), each additional point SMU adds
to its averages is worth less than growth from starting at lower averages.
This should also help explain why growth in SMU’s raw test average did not yield quite the rankings boost
that might have been expected from the outside looking in—though it has helped protect against
negative impacts from other, less well performing categories. This is because SMU was already starting
from an above-average test score composite.
The other consideration in growing test scores is the fact that it contributes to a growth in predicted
graduation rate as calculated by USNWR, as discussed in detail in the previous section. This is already a
difficulty causing SMU to underperform—significantly—in Graduation Rate Performance, and hence hurt
SMU’s overall score. We do not suggest, of course, that SMU lower the quality of its incoming class to
improve Graduation Rate Performance, but this is simply one factor to keep in mind when allocating time,
efforts, and resources to improve in the various rankings metrics.
Finding 2: Predicted Graduation Rate is a significant problem
Related to test scores, SMU’s actual graduation rate is quite strong, but this is offset, in large part, by the
USNWR calculated “Predicted Graduation Rate.” SMU’s challenge is that it spends a considerable
amount of money on educating its students and admits an extremely high quality incoming class as
measured by test scores and high school performance, but does not bring in a high proportion of
low-income or first-generation students. This yields a very high Predicted Graduation Rate, which in turn
makes it more difficult to score well for Graduation Rate Performance. Further, because Predicted
Graduation Rate is largely calculated on lagging indicators, even immediate changes made to potentially lower
the predicted graduation rate won’t take effect for several years.
________________________________________
PRIVILEGED AND CONFIDENTIAL — FOR SMU USE ONLY — PAGE 27_________________________
Finding 3: Low enrollment of low income and first generation students is a
hindrance
The recent introduction of Social Mobility rankings present a serious problem for SMU—in fact, the two
components of this are SMU’s lowest scoring of all 15 U.S. News metrics. Actual graduation rates by Pell
Grant recipients at SMU are not overly problematic (though they could be improved); the primary issue is
that U.S. News weights these factors by the proportion of Pell Grant enrollment—and SMU is in the bottom
twenty National Universities for proportional Pell Grant enrollment.
This low enrollment alone makes it impossible for SMU to perform well in Social Mobility, and has caused
SMU’s overall score to go down since the introduction of this factor. By way of example, consider that SMU
could have a 100% graduation rate for all Pell Grant students, and its Pell Grant Graduation Rate would still
rank 286th among all national universities because the proportion of Pell Grant students at SMU is so low.
Further, if USNWR were ever to uncap certain adjustments in the calculation for Pell Grant graduation rates
(simple and comparative), as discussed further in the previous section, then these factors would weigh even
more heavily against SMU’s ranking. It is unlikely that these caps will be removed in the short term future,
but it is worth considering as a possibility because there is some pressure on USNWR to do so.
Low numbers of Pell Grant students also hurt SMU’s Predicted Graduation Rate (further detailed in the prior
finding), which is discounted for having more Pell Grant recipients. Closely related, the lack of
first-generation students at SMU (many of whom tend to be recipients of Pell Grants) also causes SMU’s
predicted graduation rate to be high compared to its peers.
Finding 4: The sudden drop in Class Size Indicator had a negative impact
Class Size Indicator is the one ranking factor where SMU saw a dramatic decline in its performance between
2019 and 2020, going from 80th nationally to 136th. For the previous three years of rankings, SMU had
stayed in the 75-80 range among National Universities. This precipitous single-year decline is problematic,
and it is likely a contributory reason SMU’s ranking declined despite year-over-year increases in average test
scores, average educational expenditures, and the Peer Assessment score. However this is only speculation
and cannot be precisely quantified because USNWR does not publish precise enough statistics regarding class
size indicators to calculate the changes in national averages and standard deviation.
The reasons for the drop are beyond SMU’s control—the inclusion of a number of new universities in the
National Universities rankings caused this change, as determined by SMU’s own Office of Institutional
Research. As a result, unfortunately, it is unlikely SMU will be able to regain its prior position in this factor, at
least in the short term. The good news is that the drop is not likely to repeat unless additional universities are
included in the rankings.
________________________________________
PRIVILEGED AND CONFIDENTIAL — FOR SMU USE ONLY — PAGE 28You can also read