ANALYST AND INVESTOR PRESENTATION HY RESULTS 2020 - Bell Direct
←
→
Page content transcription
If your browser does not render page correctly, please read the page content below
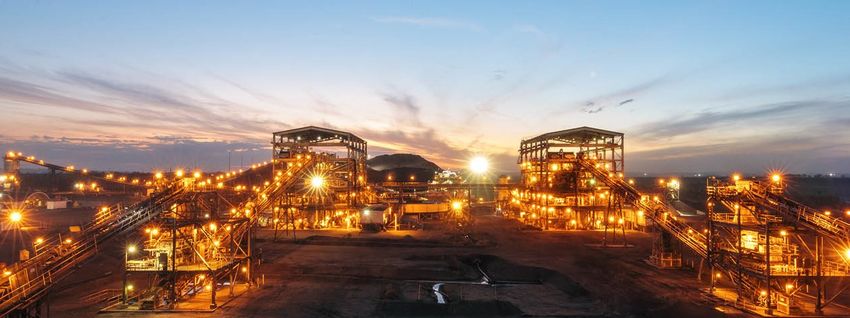
ANALYST AND INVESTOR PRESENTATION
HY RESULTS 2020
Marcelino Fernández Verdes, Executive Chairman
Juan Santamaria, Chief Executive Officer
Stefan Camphausen, Chief Financial Officer

At Lake Vermont in Queensland, Thiess was awarded a $2.5bn extension to its contract

30 July 2020
Refer to ‘ASX/Media Release’ for further information
HY20 Financial Overview NPAT of $317m for HY20 Revenue ($bn) Revenue1 of $6.2bn, down $0.8bn from HY19 7.0 (11)% COVID-19 leading to temporary delay in the award of new projects and slowdown of revenues across our To be updated 6.2 activities, both domestic and overseas Resilient operating profit2, PBT and NPAT margins3 of 8.6%, 6.9% and 5.1% respectively; supported by business mix and cost efficiency measures Operating cash flow4 pre-factoring in LTM of $1.3bn, up $495m YOY HY19 HY20 61% EBITDA cash conversion5 pre-factoring in LTM, up from 39% in HY19 and compared to 76% at 1Q20, with COVID-19 mainly impacting 2Q20 Operating cash flow pre-factoring LTM ($m) Factoring balance reduced to $1.87bn (versus $1.99bn at June 2019) 1,287 +63% Disciplined focus on capital expenditure, managing working capital and generating sustainable cash-backed profits 792 Strong liquidity with gross cash6 of $4.0bn, debt repayments of just $264m due in next 12 months Net debt7 of $1.3bn, net cash of $64m excl. BICC and after $147m of share buyback, with YTD variation mainly HY19 LTM HY20 LTM due to COVID-19 impact and H1 seasonality Solid investment grade credit ratings reaffirmed by Moody’s (Baa2/Stable) in June 2020 and S&P Movement in net cash Jun 20 ($m) (BBB/Stable/A-2) in 1Q20 832 67 (271) (443) Solid work in hand8 of $38.1bn, includes $3.1bn from Ventia’s acquisition of Broadspectrum (121) 64 (1,362) (1,298) $4.9bn of new work awarded9 in HY20; temporary delay in award of new projects due to COVID-19 At 30 June 2020, around $70bn of tenders relevant to CIMIC were expected to be bid and/or awarded for the Net cash OCF Int., tax, Net Share Net BICC remainder of this year (subject to COVID-19 evolution) and around $470bn of projects were coming to the Dec pre- fin. capex & buy- 2019 factoring costs, fin. back/ cash Net debt pre- market in 2021 and beyond factoring lease other BICC Jun 2020 Includes around $130bn of PPP opportunities identified for the remainder of 2020 and beyond Work in hand ($bn) Outlook across Group’s core businesses remains positive, monitoring COVID-19 impacts 36.8 38.1 We continue to monitor the impact of COVID-19 on 2020 operational and financial performance 3.1 8.3 4.9 Mining market proving resilient; exclusivity agreement signed with new equity investor to support mining growth strategy, process well advanced and targeting resolution in the coming weeks 28.5 30.1 Removal of tendering restrictions in Hong Kong with immediate effect Numerous stimulus packages announced by governments in core Construction and Services markets with Jun 19 Jun 20 Existing WIH New work awarded Acquisition new work additional opportunities through strong PPP pipeline HY20 Results 30 July 2020 2
NPAT of $317m for HY20 Revenue1 of $6.2bn, down $0.8bn from HY19 with COVID-19 leading to temporary delay in the award of new Revenue ($bn) projects and slowdown of revenues across our activities, both domestic and overseas 7.0 (11)% Ramp up of tendering activities expected in Hong Kong following reinstatement to approved tenderer list with 6.2 immediate effect Resilient operating profit2, PBT and NPAT margins3 of 8.6%, 6.9% and 5.1% respectively; supported by business mix and cost efficiency measures Increase in net finance costs mainly due to BICC and increased liquidity to manage potential COVID-19 impacts HY19 HY20 No significant one-offs (excluding ongoing COVID-19 impacts) Financial performance ($m) HY19 HY20 Chg. $ FY19 EBITDA ($m) Revenue 6,955.1 6,206.3 (748.8) 14,701.1 1,024 (4)% 982 EBITDA 1,023.8 982.1 (41.7) 2,146.7 EBITDA margin 14.7% 15.8% 110bp 14.6% D&A (454.8) (447.5) 7.3 (917.6) HY19 HY20 Operating profit2 569.0 534.6 (34.4) 1,229.1 Operating profit margin 8.2% 8.6% 40bp 8.4% Operating Profit ($m) Net finance costs (65.4) (105.0) (39.6) (129.2) 569 (6)% 535 Profit before tax (excl. BICC) 503.6 429.6 (74.0) 1,099.9 PBT margin (excl. BICC) 7.2% 6.9% (30)bp 7.5% Income tax (excl. BICC) (136.0) (115.9) 20.1 (297.0) HY19 HY20 Effective tax rate 27.0% 27.0% - 27.0% Non-controlling interests (0.9) 2.9 3.8 (2.6) NPAT ($m) NPAT (excl. BICC) 366.7 316.6 (50.1) 800.3 367 (14)% 317 NPAT margin (excl. BICC) 5.3% 5.1% (20)bp 5.4% EPS (basic) – NPAT (excl. BICC) 113.1c 98.6c (14.5)c 246.9c One-off BICC item10 - - - (1,840.2) NPAT 366.7 316.6 (50.1) (1,039.9) HY19 HY20 HY20 Results 30 July 2020 3
Operating cash flow pre-factoring $1.3bn LTM, up $495m YOY COVID-19 impacting HY20 operating cash flow due to reduced revenue and lower net working capital position, in addition to the normal H1 seasonality Notwithstanding, 61% EBITDA cash conversion5 pre-factoring in LTM, up from 39% in HY19 and compared to 76% Operating cash flow pre-factoring LTM ($m) in 1Q20, with COVID-19 mainly impacting 2Q20 1,287 Factoring balance reduced to $1.87bn (versus $1.99bn at June 2019) +63% 792 Ongoing investment in capital expenditure to deliver mining operations and job-costed tunnelling opportunities Disciplined focus on capital expenditure, managing working capital and generating sustainable cash-backed profits HY19 LTM HY20 LTM Cash flow ($m) HY19 HY20 Chg. % HY20 LTM Operating cash flow pre-factoring 486.8 67.1 (86.2)% 1,287.3 Variation in factoring 41.8 (88.0) - (122.5) EBITDA conversion pre-factoring LTM (%) Operating cash flow4 528.6 (20.9) - 1,164.8 61% +22 Interest, finance costs and taxes (168.7) (183.1) 8.5% (478.2) 39% Net operating cash flow 359.9 (204.0) - 686.6 Gross capital expenditure11 (341.1) (296.6) (13.0)% (729.9) Gross capital proceeds12 14.6 10.9 (25.3)% 18.8 HY19 HY20 Net capital expenditure (326.5) (285.7) (12.5)% (711.1) Free operating cash flow13 33.4 (489.7) - (24.5) Movement in net cash Jun 20 ($m) 832 67 (271) EBITDA conversion ($m) HY19 LTM HY20 LTM (443) (121) 64 (1,362) (1,298) EBITDA (a) 2,049.0 2,105.0 Operating cash flow (b)4 1,778.8 1,164.8 Net cash OCF Int., tax, Net Share Net BICC Net EBITDA conversion (b)/(a)5 87% 55% Dec pre- fin. capex & buy- 2019 factoring costs, fin. back/ cash debt pre- factoring lease other Jun BICC Operating cash flow pre-factoring (c) 792.0 1,287.3 2020 EBITDA conversion pre-factoring (c)/(a)5 39% 61% HY20 Results 30 July 2020 4
Strong liquidity with gross cash of $4.0bn Net debt7 of $1.3bn, net cash of $64m excl. BICC and after $147m of share buyback, with YTD variation mainly due to COVID-19 impact and H1 seasonality Gross cash ($bn) Debt repayments of just $264m due in next 12 months 4.0 Net contract debtors stable in 2Q20 +2.2 $675m contract debtors provision remains unchanged 1.8 Reduced factoring balance of $1.87bn (versus $1.96bn at December 2019) Supply Chain Finance balance of $361m (versus $851m at December 2019) Dec 19 Jun 20 Strong investment grade credit ratings reaffirmed by Moody’s (Baa2/Stable) in June 2020 and S&P (BBB/Stable/A-2) in 1Q20 Increased liquidity to manage potential COVID-19 impacts, facility mix leading to average cost of debt decreasing 140bp YOY to 2.2% Movement in net cash Jun 20 ($m) Jun 2020 Net cash/(debt) ($m) Dec 2019 Jun 2020 BICC14 832 67 (271) (excl. BICC) (443) (121) 64 (1,362) (1,298) Cash and equivalent liquid assets6 1,754.5 3,992.8 1,361.8 5,354.6 Gross debt (922.9) (5,291.1) - (5,291.1) Net cash/(debt)7 831.6 (1,298.3) 1,361.8 63.5 Net cash OCF Int., tax, Net Share Net Dec pre- fin. capex & buy- BICC Net cash 2019 factoring costs, fin. back/ debt pre- Net contract debtors ($m) Dec 2019 Mar 2020 Jun 2020 factoring lease other BICC Jun 2020 Net contract debtors 1,285.7 1,537.0 1,526.3 Finance cost detail ($m) HY19 HY20 Debt interest expenses (30.0) (44.1) Average cost of debt (%) Facility fees, bonding and other costs15 (64.6) (74.8) Total finance costs (94.6) (118.9) 3.6% (140)bp Interest income 29.2 13.9 2.2% Net finance costs16 (65.4) (105.0) Finance cost detail ($m) HY19 HY20 Debt interest expenses (a) (30.0) (44.1) HY19 HY20 Gross debt17 at period end 697.8 5,291.1 Gross debt period average (b) 1,675.9 4,067.9 − Average cost of debt ( ) 3.6% 2.2% HY20 Results 30 July 2020 5
Solid work in hand of $38.1bn; pipeline up 17% YOY Work in hand8 of $38.1bn, Operating Companies’ work in hand equivalent to more than two years of revenue, provides good visibility Work in hand ($bn) $4.9bn of new work9 awarded in HY20, COVID-19 leading to temporary delay in the award of new projects 36.8 38.1 3.1 Ventia’s acquisition of Broadspectrum, finalised on 30 June 2020, added $3.1bn to work in hand, with the 8.3 4.9 combined group expected to generate annual revenue in excess of $5bn18 30.1 Contracts announced included: 28.5 Lake Vermont mining services extension, QLD Mackay Northern Access Upgrade, QLD Jun 19 Jun 20 Port Wakefield to Port Augusta Regional Projects Several services contracts in the rail sector, Australia Existing WIH New work awarded Acquisition new work Alliance (RPA), SA Several maintenance contracts in the mining, oil and South Gippsland Highway Upgrade, VIC gas sectors, Australia Pipeline of opportunities increased 17% YOY As at 30 June 2020, around $70bn of tenders relevant to CIMIC were expected to be bid and/or awarded for the remainder of this year (subject to COVID-19 evolution) and around $470bn of projects were coming to the Pipeline of opportunities ($bn) 540 market in 2021 and beyond 460 +17% 70 60 Includes around $130bn of PPP opportunities identified for the remainder of 2020 and beyond Notwithstanding the shorter-term impacts from the evolving COVID-19 situation, outlook across the Group’s core 400 470 businesses remains positive Some major projects that CIMIC is currently bidding include: Jun 19 Jun 20 Western Harbour Tunnel and Warringah Freeway Changi Airport Terminal 5, Singapore Next year and beyond Remainder of year Upgrade, NSW Rio Tinto major shutdown extension, QLD Sydney Metro Greater West – North South Rail Link Mount Piper Emergent Work, NSW Stage 1 PPP, NSW Mount Pleasant mining extension, NSW M6 Stage 1 (Arncliffe to Kogarah), NSW Numerous other mining and processing opportunities Work in hand by activity Jun 20 (%) Inland Rail (Gowrie to Kagaru section) PPP, QLD in Australia, South America and Botswana Corporate 14% Work in hand ($m) as at Jun 19 Jun 20 Chg. % Dec 19 Construction 37% Construction 14,729 14,237 (3.3)% 16,229 Services 22% Mining & mineral processing 10,791 10,296 (4.6)% 10,143 Services 8,763 8,263 (5.7)% 8,944 Mining & mineral processing 27% Operating Companies’ work in hand 34,283 32,796 (4.3)% 35,316 Corporate19 2,562 5,288 - 2,195 Total work in hand 36,845 38,084 3.4% 37,511 HY20 Results 30 July 2020 6
Shareholder returns and Outlook Dividends and buyback Total shareholder return (indexed) Share price closed at $24.12 at 30 June 2020, providing a total shareholder return20 of 37.0% over a 5 300 250 year period notwithstanding the COVID-19 impact, during which the S&P/ASX 200 accumulated index 200 returned 33.5% 150 100 50 CIMIC has not declared an interim dividend CIMIC repurchased and cancelled 6,274,847 shares, equivalent to 1.94% of the issued share capital, for a total consideration of $147m S&P/ASX 200 total shareholder return (indexed) Since 2015, CIMIC has returned $2.67bn to shareholders through dividends ($2.1bn) and share CIMIC total shareholder return (indexed) buyback ($0.6bn) Outlook across Group’s core businesses remains positive, monitoring COVID-19 impacts We continue to monitor the impact of COVID-19 on 2020 operational and financial performance Mining market proving resilient; exclusivity agreement signed with new equity investor to support mining growth strategy, process well advanced and targeting resolution in the coming weeks Removal of tendering restrictions in Hong Kong with immediate effect Numerous stimulus packages announced by governments in core Construction and Services markets with additional opportunities through strong PPP pipeline HY20 Results 30 July 2020 7
APPENDICES
Financial Overview
Financial performance ($m) HY19 HY20 Chg. $ Chg. %
Revenue 6,955.1 6,206.3 (748.8) (10.8)%
EBITDA 1,023.8 982.1 (41.7) (4.1)%
EBITDA margin 14.7% 15.8% 110bp
Operating profit2 569.0 534.6 (34.4) (6.0)%
Operating profit margin 8.2% 8.6% 40bp
Profit before tax 503.6 429.6 (74.0) (14.7)%
PBT margin 7.2% 6.9% (30)bp
NPAT 366.7 316.6 (50.1) (13.7)%
NPAT margin 5.3% 5.1% (20)bp
EPS (basic) – NPAT 113.1c 98.6c (14.5)c (12.8)%
Financial position ($m) Dec 19 Jun 20 Chg. $ Chg. %
Net cash/(debt) 831.6 (1,298.3) (2,129.9) -
One-off BICC item21 398.6 1,361.8 963.2 -
Net cash/(debt) (excl. BICC)7 1,230.2 63.5 (1,166.7) -
Lease liabilities (902.1) (809.6) 92.5 (10.3)%
Net cash/(debt) (incl. leases, excl. BICC) 328.1 (746.1) (1,074.2) -
Net contract debtors 1,285.7 1,526.3 240.6 18.7%
Cash flows ($m) HY19 HY20 Chg. $ Chg. %
Operating cash flow4 528.6 (20.9) (549.5) -
Interest, finance costs and taxes (168.7) (183.1) (14.4) 8.5%
Net operating cash flow 359.9 (204.0) (563.9) -
Gross capital expenditure (341.1) (296.6) 44.5 (13.0)%
Gross capital proceeds 14.6 10.9 (3.7) (25.3)%
Net capital expenditure (326.5) (285.7) 40.8 (12.5)%
Free operating cash flow 33.4 (489.7) (523.1) -
Work in hand ($m) Jun 19 Jun 20 Chg. $ Chg. %
Work in hand beginning of period 36,706.1 37,510.7 804.6 2.2%
New work 8,264.7 4,875.1 (3,389.6) (41.0)%
Acquisition work in hand22 - 3,072.2 3,072.2 -
Executed work (8,125.6) (7,374.4) 751.2 (9.2)%
Total work in hand end of period 36,845.2 38,083.6 1,238.4 3.4%
HY20 Results 30 July 2020 9
Statement of financial performance
 Key figures ($m) HY19 HY20 Chg. $ Chg. %

 Revenue 6,955.1 6,206.3 (748.8) (10.8)%

 Expenses (6,389.0) (5,705.3) 683.7 (10.7)%

 Share of profit/(loss) of joint ventures and
 2.9 33.6 30.7 -
 associates

 Operating profit2 569.0 534.6 (34.4) (6.0)%

 Operating profit margin 8.2% 8.6% 40bp

 Net finance costs (65.4) (105.0) (39.6) 60.6%

 Profit before tax 503.6 429.6 (74.0) (14.7)%

 PBT margin 7.2% 6.9% (30)bp

 Income tax (136.0) (115.9) 20.1 (14.8)%

 Profit for the year 367.6 313.7 (53.9) (14.7)%

 Non-controlling interests (0.9) 2.9 3.8 -

 NPAT 366.7 316.6 (50.1) (13.7)%

 NPAT margin 5.3% 5.1% (20)bp

 EPS (basic) – NPAT 113.1c 98.6c (14.5)c (12.8)%

HY20 Results 30 July 2020 10
Segment performance Segment Revenue ($m) HY19 HY20 Chg. $ Chg. % Solid performance in core businesses Construction 3,634.3 3,195.9 (438.4) (12.1)% Construction Performance was driven by COVID-19 with a temporary delay in project awards Mining & mineral and slowdown in revenues 2,057.2 1,962.0 (95.2) (4.6)% processing PBT reflective of development of revenue with profitability benefitting from Services 1,240.9 1,026.5 (214.4) (17.3)% cost efficiency measures Corporate 22.7 21.9 (0.8) (3.5)% Mining & mineral processing Revenue 6,955.1 6,206.3 (748.8) (10.8)% Robust revenue contributions from diverse range of mining and mineral processing contracts helped deliver a resilient result despite COVID-19 impact Segment PBT ($m) HY19 HY20 Chg. $ Chg. % on selected areas of the business PBT and margins continue to benefit from diversifications across commodities Construction 268.8 202.5 (66.3) (24.7)% and geographic markets Mining & mineral 235.5 262.0 26.5 11.3% Services processing Revenue also impacted by COVID-19 as delivery of some service projects is Services 74.5 61.4 (13.1) (17.6)% being delayed Corporate (75.2) (96.3) (21.1) 28.1% PBT margins steady, supported by implementation of cost efficiency measures PBT 503.6 429.6 (74.0) (14.7)% Corporate The HY20 Corporate segment mainly includes contributions from corporate, EIC Activities, Pacific Partnerships and the commercial & residential business, as well as CIMIC’s investment in Ventia HY20 Results 30 July 2020 11
Statement of cash flows
 Key figures ($m) HY19 HY20 Chg. $ Chg. %

 Operating cash flow4 528.6 (20.9) (549.5) -
 Interest, finance costs and taxes (168.7) (183.1) (14.4) 8.5%
 Net operating cash flow 359.9 (204.0) (563.9) -
 Payments for intangibles (1.0) (9.8) (8.8) -
 Payments for property, plant and equipment (341.1) (296.6) 44.5 (13.0)%
 Proceeds from sale of property, plant and equipment 14.6 10.9 (3.7) (25.3)%
 Cash acquired from acquisition of investments in controlled
 18.0 - (18.0) -
 entities and businesses
 Payments for investments in controlled entities and
 (12.2) (3.0) 9.2 (75.4)%
 businesses
 Payments for investments (24.1) - 24.1 -
 Loan to associates and joint ventures (117.1) - 117.1 -
 Net cash from investing activities (462.9) (298.5) 164.4 (35.5)%
 Cash payments for share buyback - (146.9) (146.9) -
 Net proceeds/(repayment) of borrowings 160.3 4,425.0 4,264.7 -
 Dividends paid to non-controlling interests - (2.4) (2.4) -
 Repayment of leases (154.4) (157.5) (3.1) 2.0%
 Net cash from financing activities (excl. BICC) 5.9 4,118.2 4,112.3 -
 One-off BICC item14 - (1,361.8) (1,361.8) -
 Net cash from financing activities 5.9 2,756.4 2,750.5 -

HY20 Results 30 July 2020 12
Statement of financial position – assets Assets ($m) Dec 2019 Jun 2020 Chg. $ Chg. % Composition Current assets Current assets: Cash and cash equivalents: Cash and cash equivalents Cash and cash equivalents 1,750.0 3,988.7 2,238.7 - was $3,988.7m at 30 June 2020 Short term financial assets and Short term financial assets and investments: Includes 4.5 4.1 (0.4) (8.9)% liquid assets converted or readily convertible to cash investments subsequent to period end Trade and other receivables 3,554.4 3,998.5 444.1 12.5% Trade and other receivables: Includes contract debtors, sundry debtors, joint venture and other receivables Current tax assets - 15.2 15.2 - Inventories: consumables and development properties: Includes job-costed inventories held for large Inventories: consumables and infrastructure projects and commercial & residential 400.1 421.0 20.9 5.2% assets development properties Total current assets 5,709.0 8,427.5 2,718.5 47.6% Non-current assets: Non-current assets Investments accounted for using the equity method: Trade and other receivables 130.4 220.4 90.0 69.0% Equity accounted investments include project-related associates and joint ventures and PPP projects Inventories: development 114.9 101.0 (13.9) (12.1)% Property, plant and equipment: Additions to property, properties plant and equipment during the period included Investments accounted for using investment in job-costed tunnelling machines for major 250.5 214.1 (36.4) (14.5)% road and rail projects, and ongoing investment in mining the equity method equipment Other investments 112.2 139.7 27.5 24.5% Deferred tax assets 1,025.2 977.5 (47.7) (4.7)% Property, plant and equipment 2,279.1 2,151.4 (127.7) (5.6)% Intangibles 1,104.4 1,087.5 (16.9) (1.5)% Total non-current assets 5,016.7 4,891.6 (125.1) (2.5)% Total assets 10,725.7 13,319.1 2,593.4 24.2% HY20 Results 30 July 2020 13
Statement of financial position – liabilities and equity Liabilities and equity ($m) Dec 2019 Jun 2020 Chg. $ Chg. % Composition Current liabilities Current and non-current liabilities: Trade and other payables: Includes contract Trade and other payables 6,024.6 5,594.6 (430.0) (7.1)% liabilities, trade creditors and accruals, joint venture Current tax liabilities 60.3 38.5 (21.8) (36.2)% payables and other creditors Provisions: Relates to wages and salaries, annual Provisions 327.2 320.5 (6.7) (2.0)% leave, long service leave, retirement benefits and Financial liability 1,483.4 231.1 (1,252.3) (84.4)% deferred bonuses Financial liability: Relates to the Group’s exposure Interest bearing liabilities 164.3 264.3 100.0 60.9% to financial guarantees in respect of BICC Lease liabilities 277.8 274.9 (2.9) (1.0)% Interest bearing liabilities: Current and non-current interest bearing liabilities amounted to $5,291.1m at Total current liabilities 8,337.6 6,723.9 (1,613.7) (19.4)% 30 June 2020 Non-current liabilities Lease liabilities: Represents the Group’s portfolio of leased assets made up by property, plant, mining Trade and other payables 200.8 196.9 (3.9) (1.9)% equipment and vehicles utilised by the Group Provisions 60.5 53.1 (7.4) (12.2)% Interest bearing liabilities 758.6 5,026.8 4,268.2 - Lease liabilities 624.3 534.7 (89.6) (14.4)% Deferred tax liabilities 20.9 20.5 (0.4) (1.9)% Total non-current liabilities 1,665.1 5,832.0 4,166.9 - Total liabilities 10,002.7 12,555.9 2,553.2 25.5% Equity 723.0 763.2 40.2 5.6% One-off BICC item10 1,840.2 1,840.2 - - Equity (excl. BICC) 2,563.2 2,603.4 40.2 1.6% HY20 Results 30 July 2020 14
Selected project wins during the LTM
RAIL CONTRACTS $180m, UGL (Mar 2020) RAIL AND MINING SERVICES CONTRACTS CURRAGH CONTRACT EXTENSION LAKE VERMONT CONTRACT EXTENSION CROSS RIVER RAIL RIS# PACKAGE $900m,
Operation and maintenance contract for $260m, UGL (Aug 2019) $1.3bn, Thiess (Sep 2019) $2.5bn, Thiess (Jul 2020) CPB Contractors and UGL (Aug 2019)
Adelaide’s North-South tram and bus network Rail manufacturing and O&M services, and Contract extension to provide mining services Contract extension to provide full-service Design, supply and install supporting rail systems
until July 2028 and a contract to manufacture delivery of services contracts in the mining and equipment maintenance until 2025 mining operations until 2027 and brownfield works by 2024
new locomotives in Newcastle, NSW sector

 REGIONAL TRANSPORT PROJECTS $237m, REGIONAL ROAD CONTRACTS $164m, CPB (Feb
 CPB Contractors (Mar 2020) 2020)
 Contract to deliver three major road projects Contract to deliver upgrades to two major
 through an alliance style contract in regional regional highway projects in Queensland and
 South Australia by 2022 Victoria by 2022

 RIO TINTO CONTRACTS $150m,
 CPB Contractors (Dec 2019) CAMPBELLTOWN HOSPITAL $424m,
 Deliver three packages of earthworks and civil CPB Contractors (Aug 2019)
 works for the Robe Valley iron ore Stage 2 of the redevelopment for the
 development by 2021 construction of expanded clinical, mental health
 and paediatric facilities by mid-2023

OIL & GAS MAINTENANCE $450m, UGL (Feb
2020) SYDNEY TRAINS CONTRACT EXTENSION $630m,
Contracts to provide maintenance, UGL (Jul 2019)
turnarounds and project services in the oil and Extension of contract to deliver maintenance and
gas sector in Western Australia and Victoria logistics services for a portion of Sydney’s
 metropolitan passenger rail fleet to 2024*

METRONET CONTRACT $423m, WESTERN SYDNEY AIRPORT EARTHWORKS
CPB Contractors (Dec 2019) $323m CPB Contractors (Sep 2019)
Alliance contract to construct the 14.5km Deliver design and construction of bulk
Yanchep Rail Extension and the 17.5km earthworks and drainage works by 2022
Thornlie-Cockburn Link by mid-2023

SUNBURY LINE UPGRADE $158m, NEPEAN HOSPITAL REDEVELOPMENT
CPB Contractors (Oct 2019) STAGE 1 $379m, CPB Contractors (Aug 2019)
Deliver overhead electrification, signalling Construction of a new 14-storey clinical services
power upgrades and additional infrastructure building by 2021
by 2023

 NORTH EAST LINK EARLY WORKS $195m, M80 UPGRADE $331m, STAGE 2 OF MONASH FREEWAY UPGRADE SYDNEY METRO STATION PROJECT $463m, SYDNEY METRO CITY & SOUTHWEST PPP
 CPB Contractors (Sep 2019) CPB Contractors (Oct 2019) $761m, CPB Contractors (Sep 2019) CPB Contractors (Sep 2019) $366m, UGL and Pacific Partnerships (Nov 2019)
 Design, development and removal, relocation Widening the freeway and realignment of Design and construct freeway lanes along a Design and construction of the new Pitt Extension of an existing contract to provide O&M
 and/or protection of utility services by 2021 ramps, and installation of a management 36km route, upgrade interchanges and Street Metro Station by 2023 services for 66km of rail and 31 metro stations
 system along a 38km route by early 2023 deliver a lane management system by 2022 for 10 years from 2024

#RIS – Rail, Integration and Systems *Replaces and expands a contract announced in January 2019
HY20 Results 30 July 2020 15
Group revenue by activity and market
% BY ACTIVITY (HY20) % BY MARKET (HY20)
 Corporate 12%
 International 20%

 Services 18%
 Construction 43%

 Domestic 80%

 Mining & mineral
 processing 27%

% BY ACTIVITY (HY19) % BY MARKET (HY19)
 Corporate 11%
 International 21%

 Services 19%
 Construction 44%

 Domestic 79%

 Mining & mineral
 processing 26%

HY20 Results 30 July 2020 16
Work in hand by activity and market
% BY ACTIVITY (JUNE 2020) % BY MARKET (JUNE 2020)

 Corporate 14% International 14%

 Services 22% Construction 37%

 Domestic 86%

 Mining & mineral
 processing 27%

% BY ACTIVITY (JUNE 2019) % BY MARKET (JUNE 2019)
 Corporate 7%

 International 23%
 Services 24%
 Construction 40%

 Domestic 77%

 Mining & mineral
 processing 29%

HY20 Results 30 July 2020 17
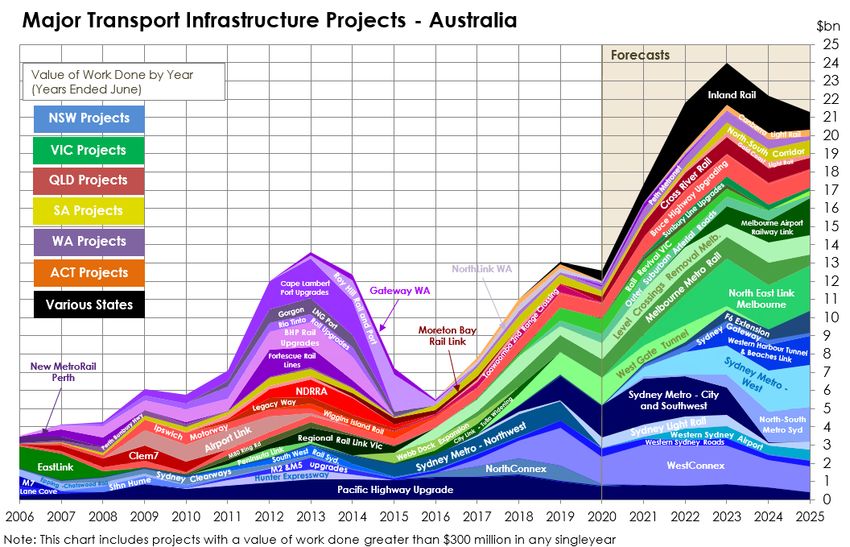
Australian transport infrastructure projects – market opportunities

 Source: Macromonitor, July 2020
HY20 Results 30 July 2020 18
CIMIC Group

HY20 Results 30 July 2020 19
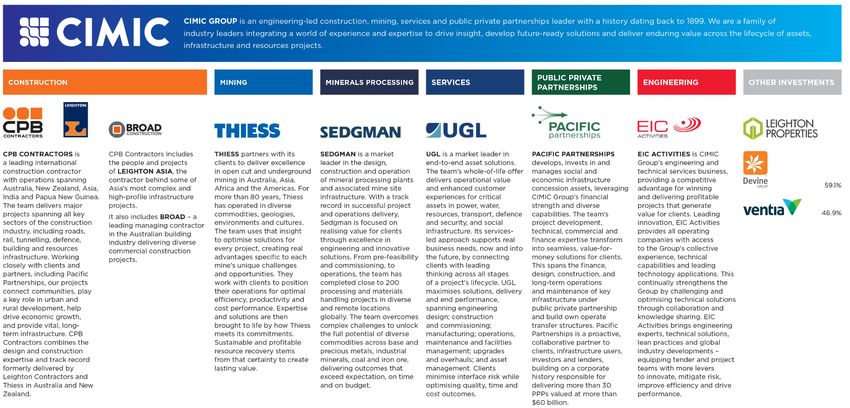
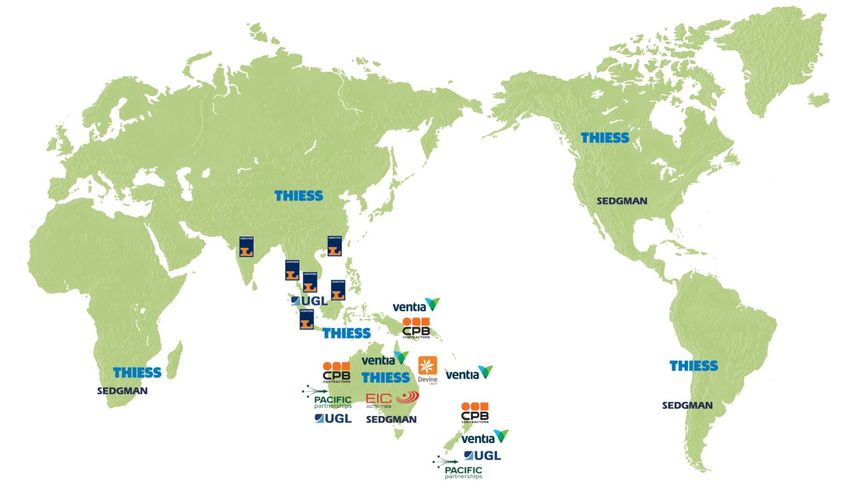
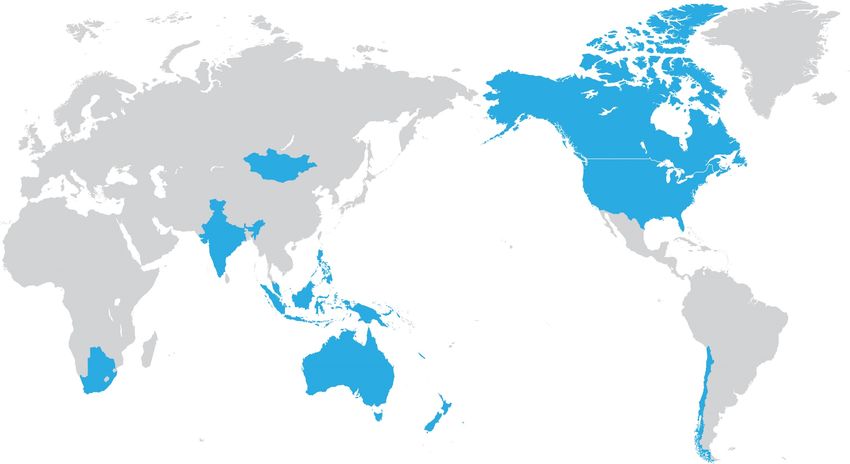
Group market position

HY20 Results 30 July 2020 20
F/X rates
 Jun Jun
 End of the period Chg. $ Chg. %
 2019 2020

 AUD/USD 0.69 0.70 0.01 1.4%

 AUD/EUR 0.61 0.61 - -

 Period average HY19 HY20 Chg. $ Chg. %

 AUD/USD 0.70 0.66 (0.04) (5.7)%

 AUD/EUR 0.62 0.58 (0.04) (6.5)%

HY20 Results 30 July 2020 21
1Revenue excludes revenue from joint ventures and associates of $1,168.1m (HY19: $1,170.5m) 2Operating profit is EBIT adjusted for any one-off items. No one-off items in HY20 or HY19. One-off item in FY19 relates to the provisions and asset impairments (net of tax) of the Group’s financial investment in BICC and exit from the Middle East region. 3Margins are calculated on revenue which excludes revenue from joint ventures and associates 4Operating cash flow includes cash flow from operating activities and changes in short term financial assets and investments before interest, finance costs and taxes 5EBITDA cash conversion and EBITDA in HY20 LTM does not include any gains/(losses) recognised as a result of the Group’s financial investment in BICC and exit from the Middle East region in 4Q19 6Gross cash represents cash and equivalent liquid assets (which includes cash, cash equivalents and short term financial assets and investments) 7Net cash/(debt) includes cash and equivalent liquid assets (which includes cash, cash equivalents and short term financial assets and investments) 8WIH includes CIMIC’s share of work in hand from joint ventures and associates 9New work includes new contracts and contract extensions and variations, including the impact of foreign exchange rate movements 10One-off relates to the provisions and asset impairments (net of tax) of the Group’s financial investment in BICC and exit from the Middle East region in FY19 11Gross capital expenditure is payments for property, plant and equipment 12Gross capital proceeds are proceeds received from the sale of property, plant and equipment 13Free operating cash flow is defined as net operating cash flow less net capital expenditure for property, plant and equipment 14 Payments in relation to CIMIC’s financial guarantees of certain BICC liabilities of $1.36bn gross of tax included in statutory net cash 15 Relates to the $2.0bn of working capital facilities of which $0.5bn is undrawn at 30 June 2020 and bank bonding commitment fees 16Net finance costs include interest income and finance costs 17Total interest bearing liabilities 18Ventia’s acquisition of Broadspectrum was completed on 30 June 2020 and accordingly, had no impact on the financial performance in the period to 30 June 2020 19Corporate work in hand includes work in hand from CIMIC’s share of investments of Ventia 20Total shareholder return represents the total amount returned to investors, including change in market share price and dividends paid. The 5 year period is 30 June 2015 to 30 June 2020 21Dec19 relates to funding provided to BICC. Jun20 relates to repayments in relation to CIMIC’s financial guarantees of certain BICC liabilities 22CIMIC’s share of work in hand in relation to Ventia’s acquisition of Broadspectrum Definitions 1Q19, 2Q19, 3Q19 & 4Q19 – Three months to March 2019, June 2019, September 2019 and Excl - Excluding December 2019 respectively FY – Full year from January to December 1Q20, 2Q20, 3Q20 & 4Q20 – Three months to March 2020, June 2020, September 2020 and H1/HY – Half year from January to June December 2020 respectively H2 – Half Year from July to December bn – Billion LTM – Last 12 months bp – Basis points m – Million cps – Cents per share NPAT – Net profit after tax D&A – Depreciation and amortisation PBT – Profit before tax EBIT – Earnings before net finance costs and tax PPP – Public Private Partnership EBITDA – Earnings before net finance costs, tax, depreciation and amortisation WIH – Work in hand EPS – Earnings per share (basic) YOY – Year on year YTD – Year to date HY20 Results 30 July 2020 22
Disclaimer This presentation, and any oral presentation accompanying it: is not an offer, invitation, inducement or recommendation to purchase or subscribe for any securities in CIMIC Group Limited (“CIMIC”) or to retain any securities currently held; is for information purposes only, is in summary form and does not purport to be complete - the Management Commentary and Appendix 4D within the Consolidated Interim Financial Report lodged provides statutory disclosures and details of the CIMIC financial position; is not intended to be relied upon as advice to investors or potential investors and does not take into account the investment objectives, financial situation or needs of any particular investor, potential investor or any other person. Such persons should consider seeking independent financial advice depending on their specific investment objectives, financial situation or needs when deciding if an investment is appropriate or varying any investment; and contains forward looking statements. These statements reflect the current views, expectations and assumptions of the board of directors of CIMIC and are based on information currently available to the Board, involve risks and uncertainties and do not guarantee future results, performance or events. Any forward looking statements have been prepared on the basis of a number of assumptions which may prove to be incorrect or involve known and unknown risks, uncertainties and other factors, many of which are beyond the control of CIMIC, which may cause actual results, performance or achievements to differ materially from those expressed or implied in the statements. There can be no assurance that actual outcomes will not differ materially from these statements. Any forward looking statement reflects views held only as at the date of this presentation. Subject to any continuing obligations under applicable law or any relevant stock exchange listing rules, CIMIC does not undertake to nor is it under any obligation to, publicly update or revise any of the forward looking statements or change in events, conditions or circumstances on which any such statement is based. No representation or warranty, express or implied, is made as to the fairness, accuracy, completeness or correctness of the information, opinions and conclusions contained in this presentation and any oral presentation accompanying it. To the maximum extent permitted by law, CIMIC and its related bodies corporate, and their respective directors, officers, employees, agents and advisers, will not be liable (including, without limitation, any liability arising from fault or negligence) for any loss, damage, claim, demand, cost and expense of whatever nature arising in any way out of or in connection with this presentation and any oral presentation accompanying it, including any error or omission therefrom, or otherwise arising in connection with any reliance by any person on any part of this presentation and any oral presentation accompanying it. HY20 Results 30 July 2020 23
You can also read