Analytical Brief on Energy Sufficiency in the National Context: Hungary - Cactus
←
→
Page content transcription
If your browser does not render page correctly, please read the page content below

Analytical Brief on Energy Sufficiency in the National Context: Hungary
Hungary analytical brief: Energy
  Sufficiency in the National
            Context
  prepared as part of the EUKI project
“Consolidating Ambitious Climate Targets
  with End-Use Sufficiency” (CACTUS)
Authors: Mária Bartek-Lesi, Viktor Rácz, Bettina Dézsi, Balázs Felsmann, Ágnes Törőcsik (REKK)

  CACTUS is a project on energy sufficiency and its integration into climate and energy strategies in the Central
                 and Eastern European context funded by the European Climate Initiative EUKI.
     It sensitises key scenario builders, policy makers and wider EU and climate and energy stakeholders on
           energy sufficiency and explores its integration in Hungarian and Lithuanian scenario models.
   Since the Summer 2020, the négaWatt association has been coordinating the implementation of the Cactus
   project with its partners REKK, LEI and the Fraunhofer ISI, and with the financial support of the EUKI fund of
                                  the German Ministry of the Environment BMU.

Analytical Brief on Sufficiency: Hungary                  2
© Cactus Project (2021 January)
Table of Contents
Introduction........................................................................................................................................... 4
1 ............................................................................................................................................................ 5
1. General information and overview of the energy sector ...................................................................... 5
1.1. General information on Hungary ............................................................................................................... 5
1.2. Overview of the energy sector in Hungary ................................................................................................. 6
1.3. The main sector-relevant targets and measures focusing on energy demand .......................................... 8
2 ............................................................................................................................................................ 9
2. The building sector – trends, potentials, and strategies ....................................................................... 9
2.1. Households ................................................................................................................................................. 9
    2.1.1. Average floor area and the size of households ................................................................................... 9
    2.1.2. Final energy consumption by end use and by fuel ............................................................................ 10
    2.1.3. Per capita energy consumption and household characteristics ........................................................ 11
    2.1.4. Indicators of energy poverty ............................................................................................................. 14
2.2. The tertiary sector .................................................................................................................................... 15
    2.2.1. Final energy consumption by fuel ..................................................................................................... 15
    2.2.2. Energy consumption per value added and per employee ................................................................. 16
2.3. Strategic energy and climate policy goals related to the building sector ................................................ 16
2.4. Main drivers and bottlenecks to energy sufficiency ................................................................................ 18
    2.4.1. Regulatory aspects ............................................................................................................................ 18
    2.4.2. Behavioural, social, and cultural factors ........................................................................................... 18
2.5. Possible improvements in the building sector ......................................................................................... 19
3 .......................................................................................................................................................... 20
3. The transport sector – trends, potential and strategies ...................................................................... 20
3.1. Passenger transport.................................................................................................................................. 21
    3.1.1. Passenger km per capita ................................................................................................................... 21
    3.1.2. Modal split in passenger transport ................................................................................................... 22
    3.1.3. Passenger cars ................................................................................................................................... 23
3.2. Freight transport....................................................................................................................................... 24
    3.2.1. Tonne km per GDP ............................................................................................................................. 24
    3.2.2. Modal split in freight transport ......................................................................................................... 25
    3.2.3. Composition of vehicles by age ......................................................................................................... 25
3.3. Strategic energy and climate policy goals related to the transport sector .............................................. 26
3.4. Main drivers and bottlenecks to energy sufficiency ................................................................................ 27
    3.4.1. Regulatory aspects ............................................................................................................................ 27
    3.4.2. Behavioural, social, and cultural factors ........................................................................................... 28
3.5. Possible improvements in the transport sector ....................................................................................... 29
Conclusions and link with the CACTUS project ...................................................................................... 30
Data table list ...................................................................................................................................... 32
Bibliography ........................................................................................................................................ 33
ANNEX ................................................................................................................................................. 34

Analytical Brief on Sufficiency: Hungary                                      3
© Cactus Project (2021 January)
Introduction
For the EU to achieve climate neutrality in 2050 and, in line with this, reduce greenhouse gas (GHG) emissions
55% by 2030, national policies have to stretch across all activities of the economy. The National Energy and
Climate Plans (NECPs) and Long-Term Strategies of most member states were established with a view to the
previous, less ambitious 40% GHG reduction target of the 2030 climate and energy framework. The upward
revision this year will require more stringent actions to deliver long-lasting emission reductions, especially in
sectors where mitigation is slow, or emissions continue rising.
Besides energy efficiency improvements (consuming less energy for the same services) and increased
renewable energy use (resulting in lower GHG emissions), curbing the demand for services without negatively
affecting the well-being of consumers can contribute significantly to reaching sustainability goals. The term
‘sufficient’ means ‘as much as you need’1 or ‘the quality of being good enough’2. In the context of energy
consumption, ’sufficiency’ has varying definitions used in different disciplines, but mostly it is related to
consumption levels which do not endanger the carrying capacity of the Earth, requiring change in consumer
behaviour (Samadi et al. 2016, Förster et al. 2019, Spangenberg and Lorek, 2019).
Relatively low living standards might be associated with positive patterns of consumer behaviour in some
energy consumption areas (e.g. higher reliance on public transportation, extended time of appliance use).
Sustaining those practices at higher levels of consumer satisfaction could help avoid unfavourable
developments (e.g. moving towards individual transport modes). The achievement of decarbonisation goals
could be easier and faster and perhaps less costly if policies aiming to maintain and to widen sufficiency-
oriented lifestyles could be applied effectively.
In Hungary, the energy consumption of households, although gradually increasing, is still below the EU
average. On the other hand, there is also evidence for consumer habits leading to excessive energy use.
Bearing the sustainability goals in mind, policies could be formulated to reverse the trend of these
unsustainable practices.
The CACTUS project aims to support the integration of energy sufficiency in national scenarios and policies
for two Central Eastern European (CEE) countries based on mitigation potential assessed by bottom-up
modelling in the sectors of buildings and transportation. This analytical brief explores the national context
of energy sufficiency in these two sectors to identify sufficiency potential, review regulatory and socio-
cultural barriers and enablers, and offer policy recommendations to reach more ambitious goals. The
analysis was supported by the elaboration of a dashboard, incorporating the present and projected 2030
values of some key indicators related to energy consumption, energy production and GHG emissions.
The first section provides some basic country-level data with a short overview of the energy sector. The
second section addresses the status and developments of energy use in household and service building
sectors, the related strategic goals of the government, and the regulatory and socio-cultural factors
influencing the exploitation of sufficiency potentials. The third section assesses the energy use patterns in
the passenger and freight transport segments in Hungary, highlighting policies that could encourage
sufficiency, and examining the regulatory and social and cultural factors driving or hindering development.
The last section draws conclusions.

1
    Oxford Advanced Learner’s Dictionary, oxfordlearnersdictionaries.com/definition/english/sufficient?q=sufficient
2
    Cambridge Dictionary, dictionary.cambridge.org/dictionary/english/sufficiency

Analytical Brief on Sufficiency: Hungary                   4
© Cactus Project (2021 January)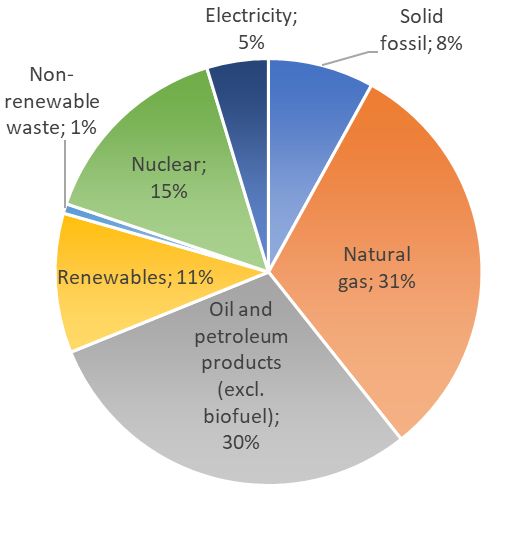
1
1. General information and overview of
  the energy sector
This section provides some general information on the Hungarian economy and a brief summary of the
energy sector including strategic goals outlined in the National Energy and Climate Plan.

1.1. General information on Hungary
Hungary is a Central European country, situated in the Carpathian Basin sharing borders with Slovakia,
Ukraine, Romania, Serbia, Croatia, Slovenia and Austria. Its territory is 93030 km2. The population has fallen
slightly from 10 million in 2005 to 9.8 million in 2019. The NECP projects a further decrease in population,
falling to 9.17 million by 2030 (see the Annex). As Figure 1 shows, Hungary has the fifth lowest per capita
GDP in the EU (EUR 13,910), less than half of the EU average (EUR 31,030) expressed in current prices.

                     Figure 1: GDP per capita in the EU countries, 2018, at current prices

                                            Source of data: Eurostat

The level of average annual net earnings expressed in PPS is the 6th lowest in the EU, reaching around 57%
of the EU average.

Analytical Brief on Sufficiency: Hungary             5
© Cactus Project (2021 January)
Hungary has a temperate continental climate. As shown in Figure 2, since 2005 the heating degree days (HDD)
varied between 3,042 (2005) and 2,278 (2014) , while the cooling degree days (CDD) had the lowest value of
41.63 in 2005, peaking at 199.47 in 2015.3 Although the heating and cooling demand is slightly lower than
the EU average, they have higher variability than the smoother EU27 average values, which in general show
higher (and slowly decreasing) heating and growing cooling demand.
Figure 2: Heating degree days (HDD) and cooling degree days (CDD) in Hungary and in the EU, 2005-
2019
Source of data: Eurostat
1.2. Overview of the energy sector in Hungary
The primary energy production of Hungary amounted to 10.9 Mtoe in 2018, 37% of which was nuclear energy,
followed by renewables (28%) and natural gas (14%). Lignite accounted for 11%, while oil and petroleum
products made up 10%.
As Figure 3 shows, energy imports were more than double of exports, a large share of which was reexported
oil and natural gas. Imports account for nearly 60% of domestic demand. Net imports are composed mainly
of oil and petroleum products (45%) and natural gas (42%).
3
Heating Degree Days (HDD) and Cooling Degree Days (CDD) indices are used as a measure of the intensity of cold and
heat in a given location, based on the difference between selected room temperatures and outside temperatures taking
into account the days with higher or lower temperatures compared to selected base values (15°C in case of HDD and
24°C in case of CDD). Eurostat uses the following calculation method for statistical purposes: HDD - If Tm ≤ 15°C Then
[HDD = ∑i(18°C - Tim)] Else [HDD = 0] ; CDD - if Tm ≥ 24°C Then [CDD = ∑iTim - 21°C)] Else [CDD = 0]. (Tim denotes the daily
mean temperature.) Source: https://ec.europa.eu/eurostat/cache/metadata/en/nrg_chdd_esms.htm
Analytical Brief on Sufficiency: Hungary 6
© Cactus Project (2021 January)Figure 3: Energy supply and fuel composition, 2018
Source of data: Eurostat
The total energy supply was 26.4 Mtoe in 2018, 31% of which was natural gas and another 30% oil. Nuclear
maintains a dominant role in electricity generation, making up 15% of primary supply, while renewable
products account for 11%, over half of which is attributable to household biomass for heating (Eurostat,
2019). Coal supplies 8%.
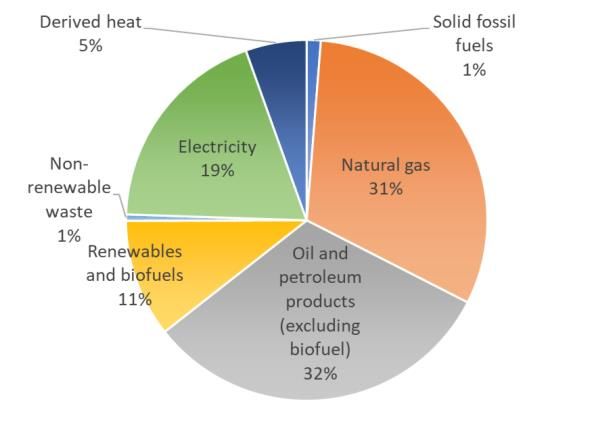
Final energy consumption was 17.9 Mtoe in 2018 broken into energy sources in Figure 4. The share of natural
gas and petroleum products is the highest in households and the transport sector, respectively. Industry
used almost half of the electricity in 2018, followed by the household and services sectors. Renewables and
biofuels make up 11% of total final consumption.
Nuclear energy accounts for about half of Hungary’s electricity mix followed by natural gas (23%), coal (15%)
and renewables (12%). In 2018, 69% of the demand was sourced domestically and 31% came from imports.
Figure 4: Composition of final energy use by fuel (2018) and by sector in Hungary (2000-2018)
urce of data: Eurostat
Two important trends are visible in final energy use. The amount and corresponding share of the transport
sector has been rising since 2000, except for a drop in 2009 due to the economic crisis. Its share in total final
Analytical Brief on Sufficiency: Hungary 7
© Cactus Project (2021 January)consumption increased from 20% in 2000 to 27% in 2018. While energy consumption fell in the services
sector, households did not achieve considerable energy savings over the period. The energy use of the
industry sector has also been rising since 2009, driven by the economic recovery.
1.3. The main sector-relevant targets and measures
focusing on energy demand
Hungary will most likely reach its 2020 renewable energy target of 13% with the share already at 12.61%
by the end of 2019 (Shares database, 2019). Renewable electricity auctions and subsequent RES-E
investments will contribute to meeting the 2030 RES-E targets. Hungary will also comply with its greenhouse
gas (GHG) mitigation target for sectors outside of the Emission Trading Scheme, managing a 5.4% reduction
while the Effort Sharing Decision4 allowed a 10% increase (Eurostat). For the targeted 9% fall compared to
2005, primary energy consumption was 7% lower than the projected 2020 level at the end of 2018, however,
the gap between the targeted and achieved final energy consumption reduction by 2018 compared to 2005
was considerable: 1% versus 23%. 5 Although the actual 2020 numbers will be strongly shaped by the effects
of the pandemic, more effort has to be made to ensure that the energy consumption levels are put on the
right path to reach decarbonisation goals (Eurostat).
Based on the Energy Strategy and National Energy and Climate Plan (NECP), one of the most important energy
policy goals of Hungary is to decarbonise energy production and strengthen energy sovereignty through the
combined use of renewable and nuclear energy. Coal-based electricity production is to be phased out by
2030. Another important goal emphasized in the NECP is to maintain the government policy of ‘utility rate
cut’. This regulation is related to the end user energy prices for household consumers and small businesses
supplied under universal service provision, keeping the utility rates at a near constant level after a phased
20% reduction compared to pre-2013 levels.
The main national objectives for 2030 presented in the NECP are the following:
▪ 40% reduction in greenhouse gas (GHG) emissions - corresponding to the EU target at the time of
drafting the plan,
▪ minimum 7% reduction of non-ETS emissions - in line with the Effort Sharing Regulation,
▪ maximum 785 PJ (18.7 Mtoe) final energy consumption in 2030 (equal to the 2005 consumption level)
– stating that industry and transport consumption should not be limited in case of economic growth,
▪ minimum 21% renewable energy share in gross final energy consumption.
Besides these goals, the Hungarian government also aims to reduce energy import dependency and reach
the average final energy intensity level of the EU.
The energy efficiency goal allows a slight increase in final energy consumption by 2030 compared to the
present values, also indicated by the comparative dashboard in the Annex.
4
Effort Sharing Decision, No 406/2009/EC.
5
These values correspond to the 20% national reduction targets set against the business-as-usual projected energy
use for 2020. Source: NEEAP of Hungary, 2015,
https://ec.europa.eu/energy/sites/ener/files/documents/hungaryActionPlan2014_en.pdf.
Analytical Brief on Sufficiency: Hungary 8
© Cactus Project (2021 January)2
2. The building sector – trends,
potentials, and strategies
2.1. Households
Hungary’s household sector is responsible for 32.6% of the final energy consumption and 12% of the GHG
emissions6.
2.1.1. Average floor area and the size of households
The average floor area of dwellings in Hungary is 82 m2, approximately 10% lower than the Europe-wide
average (91 m2). Both are rising moderately as shown in Figure 5, but no significant convergence of the
Hungarian value is yet visible.
Figure 5: Floor area of dwellings (m2 average)
Source: Odyssee-Mure Database
A significant drop in the average household size is shown in Figure 6. The NECP envisages a further decline
in the size of households to 2.23 by 2030 (see the Annex). The trend is similar across the EU28 countries,
falling from 2.40 to 2.31 between 2010-2017. Floor area per capita is expanding continuously in Hungary,
6
Compared to total GHG emissions excluding LULUCF and including international aviation.
Analytical Brief on Sufficiency: Hungary 9
© Cactus Project (2021 January)with a significant (15%) increase observable over the last 12 years. This could result in growing energy needs
per person unless counterbalanced by energy efficiency measures. Compared to the other countries
participating in the project, the per capita floor area in Lithuania and Hungary are below the values of France
and Germany but are growing at a higher rate.7
Figure 6: Average household size and floor area per person
Source of data: Central Statistics Office Hungary, Odyssee-Mure Database
2.1.2. Final energy consumption by end use and by fuel
Hungary’s household energy consumed for space heating is significantly higher (72%) compared to EU28
(64%) (Eurostat).
Figure 7: Final energy consumption by end use, 2018
Source of data: Eurostat
7
Values are computed using average dwelling size, number of dwellings and population data from the Odyssee database.
Data on the number of dwellings was not available for the EU.
Analytical Brief on Sufficiency: Hungary 10
© Cactus Project (2021 January)Based on the composition of household energy use by fuel8, space heating in Hungary mostly relies on two
sources - natural gas and renewables. The share of solid fossil fuels and oil products are negligible compared
to the EU28 average (Figure 8).
Figure 8: Final energy consumption by end use and by fuel, 2018
Source of data: Eurostat
The large contribution of solid biomass to heating is attributable to biomass (wood) used in conventional
stoves, especially in non-urban areas. This constitutes a significant proportion of renewable energy counted
towards renewable energy targets, raising several concerns: besides its harmful environmental and health
effects, the large volume of total biomass use in the economy leads to sustainability concerns (Bartek-Lesi
et al., 2019)
As regards water heating, the most important difference compared to the EU average is that Hungarian water
boilers are highly electrified. On the other hand, the most widely used cooking appliances use natural gas.
2.1.3. Per capita energy consumption and household
characteristics
Like several EU countries, Hungary revised its solid biomass accounting system in the residential sector in
2017, switching from the earlier method of calculating biomass consumption based on supply side data
(firewood sales) to a new methodology using demand side data gained from representative household
surveys on fuels used for heating. Since the recalculation revised the statistics back to 2011, there is a sharp
increase from 2010 to 2011, where the value jumped from 30.3 PJ to 76.2 PJ (Bartek-Lesi et al., 2019),
rendering longer term evaluations impossible. However, interesting trends have emerged over the decade
8
Lighting and electrical appliances are not presented as these end uses are fully based on electricity.
Analytical Brief on Sufficiency: Hungary 11
© Cactus Project (2021 January)since. While the per capita energy consumption in the EU28 has fallen slightly in 2018 compared to 2010,
the opposite can be observed in Hungary (Figure 9)9.
Hungary’s stagnant and falling energy consumption trend in the first half of the 2010’s reversed to growth in
the latter half. This might be explained by the introduction of the ‘utility rate cut’ policy of the government,
which reduced prices by about 20% in three consecutive waves. This price regulation serves as a flagship
policy of the government, considered to be the main tool for fighting energy poverty, though it benefits all
consumers. Szép and Weiner (2020) examined the effect of this policy, finding it indeed led to higher
consumption from 2013.
Figure 9: Energy consumption per capita
Source of data: Eurostat
Electricity for lighting and appliances is a small but growing part of energy consumption in Hungary, showing
8% growth between 2015 and 2018 though more detailed data is unavailable (Eurostat). Figure 10 shows the
change in the number of electrical appliances since 2010. Among the trends, personal computers are
replaced by laptops and tablets, growing at a faster rate than PCs are declining, meaning higher levels of
electronic device use. The number of air conditioners and dishwashers were minimal in 2010, but by 2018
can be found in every 4th or 5th household. Two televisions per household is becoming the norm.
9
The very low levels of per capita energy consumption for 2014 can be considered as outliers due to a record warm
winter that year, see https://earthobservatory.nasa.gov/images/83371/some-perspective-on-winter-2014
Analytical Brief on Sufficiency: Hungary 12
© Cactus Project (2021 January)Figure 10. Number of appliances per 100 households
Source: Central Statistical Office of Hungary
Figure 11 presents the value of households’ energy-related expenditures (including electricity, natural gas
and other fuels) and its share of their overall spending. The impact of the utility rate cut is clearly visible,
here, as energy expenditures fell by 38% between 2012 and 2014.
Figure 11. Energy expenditure and its share in total consumption expenditure
Source of data: Eurostat
Energy related spending is also influenced by improvements in energy efficiency. However, according to the
NECP, building renovations carried out in Hungary are mostly partial renovations, while complex
renovations are rarely executed. According to the results of a survey referenced in the NECP, 41% of
households participated in efficiency investments over the last 5 years: 6-7% towards replacing windows, 42%
towards thermal insulation and 31 % to replace boilers.
Analytical Brief on Sufficiency: Hungary 13
© Cactus Project (2021 January)2.1.4. Indicators of energy poverty
End user price regulation has downside effects for energy consumption practices and the motivation of
households to invest in energy efficiency and engage in energy sufficiency. On the other hand, Hungary has
made a significant progress in the improvement of some energy poverty indicators.
As shown in Figure 12, the share of households unable to keep their homes adequately warm and with arrears
on utility bills has fallen in Hungary and the EU, though more dramatically in Hungary. Still, Hungary’s NECP
estimates that 35-42% of dwellings are underheated. The calculation of heating deficiency ratio is based on
the theoretical heating energy requirement and the actual consumed energy. This ratio would fall by 0.27 %
with 1 % growth in GDP, according to the estimation.
Figure 12: Indicators of energy poverty
Source: EUROSTAT - EU-SILC survey
Underheating takes several forms, from setting a lower general temperature in the dwelling to heating only
those rooms that are constantly in use. Although this practice can result in substantial energy savings, it might
also cause depreciation (e.g. if moulding occurs due to humidity problems).
Figure 13 presents indicators related to housing occupancy. An overcrowded dwelling does not have enough
rooms relative to the number of occupants, while under-occupied dwellings have excess rooms which more
than meet the needs of the household. The first situation is associated with poverty and the second with
unnecessary or wasteful energy consumption. Under-occupied dwellings can also be associated with the
inability or unwillingness of older inhabitants to resettle to a smaller dwelling once their children grow up
and move out.
As the charts show, the share of overcrowded dwellings is higher and that of under-occupied dwellings is
significantly lower than the average in the EU28. This implies that the overall floor area of household
buildings is better utilized in Hungary, albeit there is a need for tackling the problem of overcrowding
stemming from poverty.
Analytical Brief on Sufficiency: Hungary 14
© Cactus Project (2021 January)Figure 13. Share of overcrowded and under-occupied dwellings, 2018
Source: EUROSTAT - EU-SILC survey
2.2. The tertiary sector
The tertiary sector contributes 11.8% to Hungary’s final energy consumption and is responsible for 4.5% of
greenhouse gas emissions (Eurostat).10
2.2.1. Final energy consumption by fuel
Figure 14 presents the composition of energy use in the tertiary sector by fuel, where only one third of total
final energy consumption is covered by electricity, while in the EU it is nearly half. Natural gas accounts for
more than half of the sector’s energy consumption.
Figure 14. Energy consumption in the tertiary sector by fuel, Hungary and EU28, 2018
Source: Odyssee-Mure Database
10
The total value includes international aviation and excludes LULUCF.
Analytical Brief on Sufficiency: Hungary 15
© Cactus Project (2021 January)2.2.2. Energy consumption per value added and per
employee
Figure 15 compares the energy intensity (per value added energy consumption) of the tertiary sectors in
Hungary and the EU. One euro of value added requires significantly more energy in Hungary, and although
the gap is narrowing, in 2018, the Hungarian energy intensity was still almost twice as high as the EU average.
Figure 15. Final energy consumption per GVA and per employee in the services sector, Hungary and EU28,
2010-2018
Source: Odyssee-Mure Database
The per employee figures, however, show a different picture. This value has also declined in the period,
leading to lower values for Hungary than the EU from 2013. However, this also suggests that the Hungarian
services sector is more labour intensive. Of course, the value of both indicators depends largely on the types
of services and activities constituting the tertiary sector.
2.3. Strategic energy and climate policy goals related
to the building sector
This subchapter summarizes the priorities of national strategic documents related to the buildings sector. It
includes the objectives and measures set out in the National Energy and Climate Plan (2020), National Energy
Strategy (NES) (2020)11 and the National Building Energy Strategy (2015). Firstly, it is important to note, that
the goals stated in these strategies are not always linked to specific measures. Secondly, the strategies have
several overlapping points that build upon each other. Finally, the most relevant document, the Buildings
Energy Strategy, is outdated and the content does not necessarily reflect the latest strategic directions.
11
Hungary updated its Energy Strategy 2030 from 2012 in 2020, in parallel with establishing its National Energy and
Climate Plan to better align the development of the energy sector with climate ambitions. The NECP and NES are based
on harmonized modelling (Hungarian Times model).
Analytical Brief on Sufficiency: Hungary 16
© Cactus Project (2021 January)Article 2a of the Energy Performance of Buildings Directive (EPBD) prescribes that all EU countries must
establish a long-term renovation strategy to support the renovation of national buildings into highly energy
efficient and decarbonised building stock by 2050. The strategy must include an overview of the national
building stock and outline national initiatives to promote the spread of smart solutions and energy-efficiency
related education. It must also elaborate the policies and measures for facilitating the cost-effective deep
renovation of buildings targeting least efficient buildings first. As the strategy is currently under preparation,
it is not covered in this brief.
The National Energy and Climate Plan of Hungary (2020) envisages that municipal district heating systems
(with supplied heat over 100 000 GJ per year) in the medium term, and district heating service in the long
term will fall within the category of ‘efficient district heating/district cooling’, reducing the energy
consumption of buildings and GHG emissions. It identifies the largest potential for energy savings in the
modernisation of residential buildings and heating systems, where energy efficiency improvements and
transition to alternative heating methods can replace 1/4 of natural gas imports. Modernisation projects in
the retail sector are planned to be implemented by the introduction of ESCO financing schemes through
energy efficiency obligations for energy distributors and/or retail energy trade undertakings to introduce
programmes and implement measures resulting in documented energy savings for final customers.
The annual deep renovation rate of 3% floor area for central government buildings is also included within
the strategic objectives outlined in the NECP in line with the provisions of the Energy Efficiency Directive. The
NECP envisages more stringent legal obligations to exploit the energy saving potential in the operation of
public buildings and the development of a personal incentive scheme for operators of public bodies. It
highlights the need for the clarification of rules for implementing the proposals of energy auditors and
consultants for public buildings.
The National Network of Energy Engineers is to be strengthened to provide support for the energy efficient
operation of public bodies and households. In the future, it will be mandatory to list the contact information
of the closest network consulting point in building performance certificates.
The NECP includes the following measures in the sector:
- Awareness raising programs to support energy efficiency measures.
- Energy Efficiency Innovation Programme for development and dissemination of building automation,
building supervision and control systems.
- Building Energetics Tender Program with 1.1 million EUR/year budget targeting the promotion of RES
fuels, energy efficiency actions, public awareness raising of climate policies, the green economy,
energy literacy and the construction of low energy buildings.
- Supporting investments in the residential sector with funds from the Hungarian Development Bank
through credits offered to private persons, apartment blocks and housing co-operatives, subject to
a minimum 10% own contribution. The energy efficiency measures include insulation of heating
systems, the replacement of doors/windows, and the installation of renewable sources of energy (PV
panels, solar thermal collectors, heat pumps and modern wood gasification equipment).
- Hungary will encourage the use of heat pumps and the burning of biomass in efficient individual
heating equipment to satisfy the heating and cooling needs of modern buildings.
The NECP strongly builds on the content of the National Energy Strategy (NES, 2020). The NES, however,
articulates some additional goals not mentioned in the NECP:
- Approximately 2/3 of the Hungarian building stock needs to be modernized, 12% of which is in sub-
scale condition, meaning the renovation is not economically viable.
Analytical Brief on Sufficiency: Hungary 17
© Cactus Project (2021 January)- Various studies estimate the annual energy savings potential to be 110-130 PJ with about 60% of the
savings identified for buildings.
- Increasing the proportion of decarbonised, near-zero energy residential buildings to 33% by 2030
from 0% in 2017.
- Measures in the district heating sector: improvement of controllability; smart cost sharing,
harmonization of seconder (renovation) and primer (system deployment) developments.
- Introduction of low-temperature heating networks in the efficient building stock, helping to utilize
geothermal energy in district heating, reduce network losses and primary energy needs, while
connecting new customers to the network.
- For individual residential heating/cooling: increasing the share of energy-efficient, renewable
solutions.
- Implement awareness-raising programs to encourage sustainable energy using practices.
The National Building Energy Strategy (NBES) was prepared in 2015, therefore some of its goals are not
relevant anymore. Nevertheless, it is the most specific strategic document, and thus, it names several
objectives related to the energy efficiency objectives in the building sector, which support general national
economic interests like job creation and reducing budgetary expenditures. The strategy targets the reduction
of energy poverty through renovation and states that high energy savings can be obtained in new, highly
efficient buildings, through renovation of old buildings supplemented by increasing efficiency in district
heating, RES utilization, introduction of energy management systems, and programs to raise awareness and
spread information.
2.4. Main drivers and bottlenecks to energy
sufficiency
Among the main drivers and bottlenecks affecting possible energy sufficiency improvements, are regulatory
measures and behavioural, social, and cultural factors.
2.4.1. Regulatory aspects
As the strategic documents show, Hungary targets efficiency improvements in the buildings sector to reduce
energy consumption for current and expected energy needs. The other approach is the expansion of new
district heating systems and renovation of existing networks. The NECP projects 0.4 Mtoe decrease in the
residential final energy consumption by 2030 compared to 2017 (see the Annex).
However, goals or measures targeting the reduction of the specific demand itself is absent. What is more,
utility price regulation pushes in the opposite direction by de-incentivizing energy-conscious consumption.
2.4.2. Behavioural, social, and cultural factors
Behavioural patterns and routines are shaped by cultural factors and social norms (Shove, 2010). Each
country’s residents have their own specific characteristics which influence their attitude towards energy
consumption. These endowments must be taken into account when policies and measures are created and
evaluated.
Analytical Brief on Sufficiency: Hungary 18
© Cactus Project (2021 January)According to a household survey carried out in 2018 across five EU countries, around 65% percent of
Hungarian households heat their rooms to temperatures above 22 °C and 24% above 24 °C, irrespective of
whether it is possible to control temperature in their homes (Csutora et al., 2018). Although subjectively
assessed by respondents, this is a high share compared to other countries and suggests that
overconsumption of heating energy is a common phenomenon in Hungary.
According to the same survey, only 14% of Hungarian households would like to receive feedback on their
consumption level compared to previous periods or other similar households compared to 40% in the other
countries. Furthermore, 22% would like targeted advice on energy saving options compared to 44-78% in the
other four countries.
Regulated prices only reaffirm these behavioural patterns: the perceived low price level and the strong
communication support accompanying the policy make potential savings from lower energy consumption
seem less beneficial than the discomfort it may take.
2.5. Possible improvements in the building sector
Historic data on energy consumption reveals that household energy efficiency measures have not resulted
in notable energy savings in Hungary. As the summarized strategic documents show, measures outlined for
energy efficiency improvements are in force, but energy sufficiency has not appeared on the policy agenda.
This analysis shows that the change in some sufficiency-related indicators may lead to increasing energy
consumption:
- The average floor area of dwellings and the floor area per person are increasing. The demographic
changes behind these trends, such as the falling average household size and rising number of
households, are very difficult to influence with policies. Further expansion of per capita floor area is
also expected with more wealth accumulation, partially resulting from improvements in the living
conditions of deprived households living in overcrowded dwellings. However, increasing the floor
area over sufficient levels can be avoided by well-targeted policies. The modelling performed within
the CACTUS project evaluates the policy effects on overall energy consumption based on various
assumptions for sufficient average floor area values.
- Space heating energy use makes up 72% of final residential energy consumption in Hungary, about a
third of which comes from biomass burned in conventional stoves. This mode of heating is outdated,
uncomfortable, and the fuel is often mixed with materials having very harmful environmental effects.
Increasing household affluence can push transition to more sustainable heating modes, such as
natural gas or heat pumps, which will increase accounted GHG emissions unless biomass accounting
is revised at the EU level. Model calculations can explore the effects of switching to different heating
fuels and provide insights for policy makers on which should be supported.
- The per capita energy consumption in Hungary reached parity with the EU average over the last three
years. One explanation is the utility rate cut which reduces incentive for energy-savings. The effect
of policies restoring this incentive and measures targeting sufficient levels of heating temperatures
in homes can be evaluated through the modelling.
- A positive impact of the utility rate cut policy is the improvement of energy poverty indicators. The
share of households unable to keep their homes adequately warm has dropped below the EU level
while households with arrears on utility bills is also down, though still above the EU average. On the
other hand, according to the Hungarian NECP, 35-42% of dwellings remain underheated. Replacing
the blunt price regulation with targeted measures aiming to increase access sufficient energy services
Analytical Brief on Sufficiency: Hungary 19
© Cactus Project (2021 January)could help restore more conscious energy consumption and provide stronger incentives to save
energy and make energy efficiency investments. The question to be explored within the project is
the extent to which sufficiency and efficiency improvements from restored energy awareness of the
population can counterbalance the rebound effect of better conditions for energy poor households.
- Besides energy poverty, the high underheating ratio can also result from the low mobility rate of
Hungarian households. Older people, especially in the countryside, are often living in large houses
built for more generations, while younger people prefer having their own dwellings. The
unfavourable distribution of dwellings can also be reinforced by the fact that Hungarians tend to own
the dwellings they live in. Encouraging the mobility of households could result in a certain
rearrangement of under and over-occupied buildings, the effect of which can be investigated under
various assumptions.
- The modelling could also help assess the possible effects on overall energy use of maintaining a
certain number of household appliances per households or per capita.
As opposed to the household sector, employees of companies in the tertiary sector have a less direct effect
on overall energy consumption. Improvements are delivered at the organisational level due to energy cost
saving considerations. However, economic growth, the development of individual businesses, and the
objective of providing more comfort for employees and customers can result in larger service floor areas and
more energy use. According to the projections of the WAM scenario in Hungarian NECP the final consumption
of the tertiary sector will increase by 0.3 Mtoe between 2017 and 2030 (see the Annex).
The COVID19 pandemic brought about important changes in the sector but the effects can be contrasting.
With employees forced to work from home, utilization of office buildings decreased substantially. As a result
of restrictions, energy usage in the tertiary sector migrated to the housing sector. It is not possible to draw
long term conclusions on how durable this current trend will be after the softening of restrictions but the
effect on final energy consumption will depend on the energy efficiency of buildings across these sectors.
3
3. The transport sector – trends,
potential and strategies
The fossil fuel consumption and GHG emissions of the EU transport sector have been on the rise, contributing
some 25% of total emissions. Hungary’s transport sector consumed 4.8 Mtoe (201.4 TJ), up 55% from 3.1
Mtoe in 2000, responsible for 27% of final energy consumption and 22% of GHG emissions12, 98% of which
comes from road transportation (Eurostat).
12
GHG emissions exclude LULUCF and include international transport.
Analytical Brief on Sufficiency: Hungary 20
© Cactus Project (2021 January)As shown in Figure 16, the per capita energy consumption and greenhouse gas emissions in the Hungarian
transport sector are below the EU average but are growing at a faster rate, approaching the EU level. While
the per capita energy consumption increased from 0.57 to 0.64 toe/capita in the EU, the Hungarian per
capita consumption more than doubled in the same period, growing from 0.24 in 1995 to 0.49 toe/capita
in 2018. GHG emissions follow a similar trend, though increasing at slower rate due to improved
environmental performance of new vehicles replacing old fleets. EU per capita GHG emissions were flat from
1995 (1.8 tons/capita) to 2018 (1.9 tons/capita), while doubling in Hungary over the same period (0.7 to
1.4 tons/capita).
Figure 16: Per capita energy consumption and GHG emissions in the transport sector of Hungary and the
EU, 1995 - 2018
Source of data: Eurostat
3.1. Passenger transport
Sustainable transportation systems start with public transportation and non-motorized individual modes
(depending on travel distances), while trains and ships require relatively smaller amounts of energy
compared to road transport (assuming similar propulsion system and fuel type). This section examines the
change in demand for passenger transport, the evolution of car ownership, modal split, and the age of
vehicles in passenger transport.
3.1.1. Passenger km per capita
The per capita passenger km values are used to compare the evolution of demand for passenger travel in
Hungary and in the EU. From 1995 to 2018, the demand for total transport increased by 35% in Hungary
and 17% in the EU28, shown in Figure 17. The majority of this growth stems from use of private cars: in this
segment, the per capita passenger kilometres in Hungary were 49% higher than in 1995 compared to 19%
in the EU. Growth in public transport was far slower, achieving 11% and 13% in the EU28 and Hungary,
respectively.
The absolute value of per capita passenger travel was 9,541 pkm/capita in Hungary and 11,726 pkm/capita
in the EU. The Hungarian NECP projects rising demand for passenger transport, expecting the per capita
performance to reach 12,705 pkm.
Analytical Brief on Sufficiency: Hungary 21
© Cactus Project (2021 January)Figure 17: Evolution of demand for passenger travel in Hungary and the EU, passenger kilometres per
capita, 1995-2018
Source of data: EC, DG Move, 2020
3.1.2. Modal split in passenger transport
The modal split in passenger transport refers to the percentage share of transport modes in the total
transport volume (expressed in pkm). Figure 18 presents the EU values.
Figure 18: Modal split in the EU countries, 2018
Source of data: EC, DG Move, 2020
Analytical Brief on Sufficiency: Hungary 22
© Cactus Project (2021 January)Hungary has the second lowest share of individual car use in the EU. However, there is clear shift towards
less sustainable travel modes, with car travel gaining more importance to the detriment of public
transportation. The contribution of passenger cars to total pkm increased from 62% in 2005 to 71% in 2018,
while the share of train, metro and trams fell from 13% to 8.6% over the same period.
3.1.3. Passenger cars
Hungary ranks favourably among countries in terms of passenger car ownership, third in the EU with the
lowest rate of passenger cars per 1000 inhabitants, as shown in Figure 19. The number of cars per 1000
inhabitants in the EU is 524 compared to 373 in Hungary, but this is up from 232 in 2000.
Figure 19: Number of passenger cars per 1000 inhabitants
Source of data: Eurostat
The number of newly registered cars has been steadily rising since 2010, following a period of falling sales
after 2003. However, since the economic crisis the share of used imported cars has been on the rise, making
up about 50% of car sales, as Figure 20 shows.
Figure 20: Share of new vehicles in registered cars in Hungary, 2001 - 2019
Source of data: Hungarian Statistical Office
Analytical Brief on Sufficiency: Hungary 23
© Cactus Project (2021 January)Although the longer service life of cars could be positive from a sufficiency perspective, older vehicles have
negative environmental effects depending on their age and engine type. The composition of all vehicles by
age shows a similar trend. The proportion of cars over 10 years was declining until 2005, stabilized until 2008,
and rose steadily thereafter. This happened despite the growing number of new car registrations, in line with
the expansion of used vehicle imports. The share of cars older than 10 years reached 72% by 2018 (Eurostat).
3.2. Freight transport
Since freight transport performance has been traditionally correlated with economic development, the
decoupling of GDP growth and GHG emissions will have a critical role in transport decarbonisation (see for
example Alises et al. 2014 and Sharmina et al. 2020). Measures will need to address the use of more efficient
vehicles, renewable fuels, modal shift, and different possibilities of curbing demand. In this subsection we
investigate the evolution of freight transport intensity, the modal split of freight transport in Hungary and
the EU, and the use of vehicles according to age categories.
3.2.1. Tonne km per GDP
Freight transport intensity measures the tonne-kilometres (tkm) per unit of GDP. The trend shows how
successful the economy is in decoupling economic growth from freight transport demand: decreasing values
imply that less tonne-kilometres are associated with producing one euro of GDP. The next chart on Figure 21
presents the freight transport intensity of the Hungarian economy in the last 13 years compared to the EU
average.
The figure reveals that the freight performance of one euro of GDP fluctuated around 0. 35 tkm, compared
to the average EU value dropping below 0.2 tkm. The difference can be explained by several factors, the most
important of which is the sectoral composition of the economy. Nevertheless, while the European average
shows signs of decoupling, this is not evident in Hungary. Hungary’s NECP projects a 18% uptick in freight
transport intensity between 2017 and 2030 (see the Annex).
Figure 21: Tonne km in freight transport per GDP, Hungary and the EU, 1995 - 2018
Source of data: Eurostat and EC DG Move, 2020. Note: The tkm values refer to road transport
adjusted for territoriality, rail, inland waterways and pipeline transport. GDP is expressed in
2010 euros.
Analytical Brief on Sufficiency: Hungary 24
© Cactus Project (2021 January)3.2.2. Modal split in freight transport
As Figure 22 illustrates, more than three-quarters of EU freight transport in 2018 was on roads compared to
68.9% in Hungary. However, the evolution of the modal shift over time suggests that road transport is
expanding while the role of inland waterways and rail transport are stagnant.
Figure 22: Performance of freight vehicles by age category (tkm %) in EU member states
Source of data: Eurostat
3.2.3. Composition of vehicles by age
Energy use and pollution from freight transport are related to the efficiency and environmental performance
of vehicles, a factor of the age composition of the vehicle fleet.
Figure 23: Composition of freight vehicles by age category (% of the number of registered vehicles) in
Hungary, 2018
Source: Hungarian Statistical Office
Figure 23
Analytical Brief on Sufficiency: Hungary 25
© Cactus Project (2021 January)As Figure 23 shows, the share of vehicles younger than 6 years is low for trucks and somewhat better for
tractors moving larger haulage, partially due to the stricter environmental regulation13 and the greater role
of economic factors in operating heavy-duty vehicles.
Figure 24 highlights that most tonne-kilometres are performed by younger, more efficient vehicles in
Hungary, despite the pre-eminence of old vehicles in the national fleet: more than 60% of the activities are
carried out by vehicles less than 5 years old and around 80% by vehicles under 10 years.
Figure 24: Performance of freight vehicles by age category (tkm %) in EU member states
Source of data: Eurostat
3.3. Strategic energy and climate policy goals related
to the transport sector
Hungary’s NECP foresees greening of transport through renewable energy use and better energy efficiency.
The plan partially builds on existing strategic documents, such as the National Transport Strategy and the
Transport Energy Efficiency Improvement Action Plan.
The NECP does not set out goals for the absolute reduction of demand for transport, although it is widely
acknowledged that curbing demand for transportation is one of the basic pillars for decarbonisation (see for
example EASAC, 2019). It aims to facilitate the decoupling of economic growth and energy consumption,
but also states that rising energy use due to economic growth should not constrain the industry and
transport sectors.
The main targets set for the transport sector include a 14% the share of renewable transport energy use (RES-
T) by 2030, 7% met by conventional biofuels, 3.5% by advanced biofuels, and the rest would be reached
through electrification. Another key goal is to limit the growth of petroleum products to 10 % by 2030. The
13
On the evolution of EU emission standards see: https://www.transportpolicy.net/standard/eu-heavy-duty-emissions/
Analytical Brief on Sufficiency: Hungary 26
© Cactus Project (2021 January)development of advanced biofuels and expansion of electric vehicle charging infrastructure will be supported
with dedicated funding.
More specific measures targeting sustainable transport development include:
▪ replacement of light commercial vehicle fleets used in public services (e.g. postal service)
▪ supporting electric vehicles through purchase subsidies and tax allowances
▪ supporting intermodal transport through tax advantages for combined freight transportation
▪ implementation of the Green Bus Programme through which 1300 environmentally friendly local
buses will be put into operation by 2029
The document also mentions car sharing but does not specify any corresponding targets or measures.
The National Energy Strategy (2020) sets out objectives that contribute to reaching sufficiency goals, e.g. the
promotion of alternative ways of mobility, such as car-sharing, car-pooling, bike-sharing, use of bicycles and
more efficient transport planning. It acknowledges that the promotion of working in home-office can
contribute to the reduction of transport energy use.
The Hungarian Transport Infrastructure Development Strategy (2014) defines more precise measures limiting
private transport demand, such as the improvement of service quality in public transportation (increased
convenience, shorter travel time, better connections, intelligent passenger information systems), increased
availability of public transport in less densely populated areas, the establishment of new P+R and B+R parking
facilities, and the promotion of active modes of mobility by ensuring new biking routes, new biking storage
and parking places, and creating low-traffic zones.
Similar strategic goals, together with the requirement to implement the integrated development of rail
transportation in Budapest and better connecting suburban areas and city centres are included in the
Budapest Transport Development Strategy (Balázs Mór Plan 2014-2030), which emphasizes active and
conscious awareness raising of travellers and the provision of comfortable and seamless public transport
services supported by IT solutions.
Some goals from the 2014 strategy have already been realized, including new biking routes and P+R parking
places. New infrastructure facilitating integrated rail transportation and the improvement of public transport
availability have been initiated recently in Budapest.14
3.4. Main drivers and bottlenecks to energy
sufficiency
The regulatory and behavioural factors that hinder or help coping with the ever-increasing demand for
transport are summarised in the next subsections.
3.4.1. Regulatory aspects
The Hungarian government is reluctant to establish energy reduction goals in the transport sector due to
economic growth expectations. The transport and freight energy intensity still need to be improved to enable
the decoupling of transport GHG emissions and economic growth, as shown in previous chapters.
14
http://abouthungary.hu/news-in-brief/budapest-transportation-development-plans-in-the-works/
Analytical Brief on Sufficiency: Hungary 27
© Cactus Project (2021 January)You can also read