Analyzing Evolution of the Olympics by Exploratory Data Analysis using - R - IOPscience
←
→
Page content transcription
If your browser does not render page correctly, please read the page content below

IOP Conference Series: Materials Science and Engineering

PAPER • OPEN ACCESS

Analyzing Evolution of the Olympics by Exploratory Data Analysis using
R
To cite this article: Rahul Pradhan et al 2021 IOP Conf. Ser.: Mater. Sci. Eng. 1099 012058

View the article online for updates and enhancements.

                               This content was downloaded from IP address 46.4.80.155 on 02/08/2021 at 19:47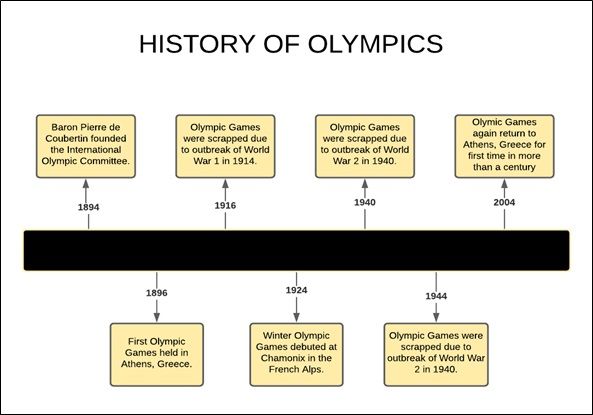
ASCI-2020                                                                                                                IOP Publishing
IOP Conf. Series: Materials Science and Engineering              1099 (2021) 012058           doi:10.1088/1757-899X/1099/1/012058

Analyzing Evolution of the Olympics by Exploratory
Data Analysis using R
                      Rahul Pradhan1 , Kartik Agrawal1 and Anubhav Nag1
                      1
                          GLA University, Mathura
                      E-mail: kartik.agrawal1 cs18@gla.ac.in

                      Abstract. Olympic Games are one of the main international event and also a matter of
                      prestige for countries and therefore each country tries to give their best performance during the
                      event. Despite a lot of hard work, many countries/player are unable to perform well during
                      the events and grab medals whereas there are many countries which performs very well in the
                      event and secures many medals. An Analysis need to be done by each country to evaluate the
                      previous statistics which will detect the mistakes which they have done previously and will also
                      help them in future development. An analysis can also be done by the host country to find
                      out the mistakes in the arrangements of the Event which will help them in overcoming these
                      mistakes and host the event accurately. The primary objective of this Research paper is to
                      analyze the large Olympic dataset using Exploratory Data Analysis to evaluate the evolution
                      of Olympic Games over the years. This analysis will provide detailed and accurate information
                      regarding various factors which leads to the evolution of Olympic Games and improvement of
                      Countries/Players over the time in visual format. Visualization of the data over various factors
                      will provide us with the statistical view of the various factors which leads to the evolution of the
                      Olympic Games and Improvement in performance of various Countries/Players over the time.

1. Introduction
Olympics games are considered as one of the most prime event which provides a valid and
common platform for players across different countries to show their talent and skills. Modern
Olympic Games were originated by taking inspiration from Ancient Olympic Games held in
Olympia, Greece from the 8th Century BC to the 4th Century AD [1]. The following timeline
outlines the main events in the history of Modern Olympic Games. The Olympics consists
of various games (Approximately 45) in which players from various countries (Approx 205)
participate to win a medal for their country. Olympics has a great history of evolution. From 13
participating nations in 1st Olympics (1896) to 207 participating nations in 2016 Rio Olympics,
the Olympics have come across a long way.
    There are various scenarios which comes in our mind when we look into Evolution of Olympic
Games over the years. These scenarios are: Increase in number of participating nations, Increase
in number of participating Athletes, Increase/Decrease in number of events, Increase in the
expenditure cost of the event, improvement in performance of particular country, improvement
in performance of a particular player, Increase in women participation, Participation Ratio of
Men to Women, improvement in medication facilities during competition, the effect of pandemic
(if any) on the performance of the players. Analysis over these scenarios would depict the
evolution of the Olympics over the years. This analysis would help in the future prediction of
              Content from this work may be used under the terms of the Creative Commons Attribution 3.0 licence. Any further distribution
              of this work must maintain attribution to the author(s) and the title of the work, journal citation and DOI.
Published under licence by IOP Publishing Ltd                          1
ASCI-2020                                                                                       IOP Publishing
IOP Conf. Series: Materials Science and Engineering   1099 (2021) 012058   doi:10.1088/1757-899X/1099/1/012058

Figure 1. This figure depicts the detailed history of Olympic Games since 1896 till now. It
explains the main events which have occurred in the Olympics till now.

the number of participating countries, players; winners of various games; Women participation
and many more. These type of Analysis can also serve as a performance indicator of a particular
country or Player.
   The main objective of this study is to analyze the various factors mentioned above which
plays a vital role in the evolution of Olympic Games over the years. The Analysis will include
the visualization and explanation of the change in trends of the various factors over the years
which will help to predict the information of future Olympic Games. As Olympic Games are
one of the most important sporting event across the world, each country and each player tries to
give their best performance in the event. In order to improve their performance, every country
should perform such Analysis which would help them in the improvement of their policies and
strategies by providing current statistics to them.

2. Related Work
Data interpretation and Analysis is one of the main and primary task in the field of big data
analytics . There has been a lot of analysis on the Olympic Games like statistics visualization,
performance analysis of players, improvement in the performance of various countries and many
more. The type of analysis which is quite popular and suitable while analyzing the evolution
of the Olympics is Exploratory Data Analysis. In Exploratory Data Analysis, we examine large
data and elucidate its various characteristics basically in the visual format(Graphs, Charts, and
many more). EDA is an approach which provides deeper understanding of the dataset. There has
been a research paper which analyze the outbreak of Novel Corona Virus. [2] Exploratory Data

                                                         2
ASCI-2020 IOP Publishing
IOP Conf. Series: Materials Science and Engineering 1099 (2021) 012058 doi:10.1088/1757-899X/1099/1/012058
Analysis technique is used to analyze the data and find out the number of cases reported(positive,
dead, discharged) inside China and Outside China. [2] This paper took data from different
datasets and apply EDA technique to analyze various factors like the number of cases recovered
during January and February inside and outside China, the number of cases confirmed in the
different provinces of China and outside China till 16 February 2020 [2].
There has been another research paper, which depicts the application of Exploratory Data
Analysis. This paper used EDA technique to find out the origin and distribution of naturally
occurring contaminants like Fluorine, Barium, Manganese, Arsenic and many more in the
groundwater from Southern Quebec (Canada). [3] For the purpose of study, they used a
Groundwater Chemistry database in compilation with 16 regional projects after which the
final dataset includes the information regarding the supply framework, geological settings,
hydrological conditions and inorganic water chemistry. The results disclosed the sources of
these contaminants i.e., these contaminants are obtained from natural sources [3].
There has been a research paper which analyze 2016 Rio Olympics to find out the various
legacies on which these games depends and which are the main reason to explain the hosting
of Olympic Games. [4] . This paper used a methodology which uses a performance indicator
used in public sector assessment and with the help of it, they find out approximately 32 legacies
which plays a major role in the smooth functioning of Olympic Games. [4]
There is another research paper which analyze the evolution of volunteering activities in
Olympic Games. [5] Volunteers are the ones who offers to take part in the event, arrangement,
social activities or works for an organization without being paid. This paper detailed analyzed
official reports of each Olympic Games (Winter as well as Summer) and a survey of Olympic
Bibliography [5]. They also made an effort and tried to achieve the direct corroboration from
the volunteers who had participated in the respective Olympic Game [5]. There has been an
another research paper which analyze the practices and strategies of Ambush Marketing by
Social Media during 2014, 2016, and 2018 Olympic Games [6]. They used an methodology of
Observational Nentography for the purpose of Analysis. Data from various industry competitors
were collected and the results show that in spite of strict Social Media Guidelines from IOC,
Ambush marketing by Social Media was noticeable during each of the given Olympic Games.
The main incentive behind this research paper came from a research paper named as -
Performance Analysis in Olympic Games using Exploratory Data Analysis Techniques, 2018
(Yamunathangam.D, Kirthicka.G, Shahanas Parveen). [7] In this Research Paper, the same
technique i.e., Exploratory Data Analysis has been used to analyze the data. [7] This paper
precisely examined Olympic Dataset to make a comparison between whole performance of
participating countries and contribution of each country in Olympic Games. [7] The main aim
of this analysis was to find out the growth in the performance of a country in the Olympics over
the years. [7] With the Help of such Analysis, any player can check their progress record and
can also have a look on its opponent’s progress. [7] There has been analysis on various factors
like Total number of Gold, Silver and Bronze medal won by different countries, Performance
Analysis of particular country, Comparison between various countries and participants [7].
3. Proposed Approach
An Approach is referred as a systematic path to reach a solution. Every problem, whether
technical or non technical, requires a proper approach so that we can get a proper path on
which we have to proceed to get the required result. This Research Paper aims to analyze the
vast history of Olympic Games and determine the evolution of Olympic Games over the Time.
There are various factors which contributes in the evolution of the Olympics. To determine these
factors and perform a comparative study on these factors, we need to follow an Approach which
will take us to our destination. Given below is the flowchart (See Figure. 2) of the proposed
approach for the problem. We will discuss each step thoroughly.
3ASCI-2020 IOP Publishing
IOP Conf. Series: Materials Science and Engineering 1099 (2021) 012058 doi:10.1088/1757-899X/1099/1/012058
Figure 2. This Figure depicts the steps of the Analysis. These are the steps in which the whole
process has been executed.
3.1. Data Collection
The very first step of any type of Analysis, whether it is technical or non-technical, is Data
Collection. In order to perform analysis on a certain problem, we require a large amount of
Data on which we apply various techniques and algorithms to reach to a particular conclusion
and get our desired result. It is advised to take the data in abundance because larger the
volume of data for analysis, the greater would be the accuracy in the result and also the greater
would be the confidence in decision making based on these results. We have used data from
various data sources for analysis on Evolution of the Olympics over the time. We have taken
three datasets which provide us with large volume and a large variety of data for Analysis. 1st
dataset consists the information about the players and their entire details like their Gender,
Height, Weight, Country for which they play, Medals won (Gold, Silver and Bronze) and many
more. This data can be used to analyze the performance of the particular player and can also
help in the comparative study between two or more players. 2nd dataset consists the information
of the countries which have participated in the Olympics so far and the list of the total number of
medals (Gold, Silver and Bronze) won by them. This data can be used to perform a comparative
study on the performance of the countries. 3rd dataset consists of the list of countries along
with their country code which is the identification of these countries. This data can be used to
find out the total number of countries which have participated in the Olympics so far. These
datasets provide us with high volume and a variety of accurate data on which we can apply
4ASCI-2020 IOP Publishing
IOP Conf. Series: Materials Science and Engineering 1099 (2021) 012058 doi:10.1088/1757-899X/1099/1/012058
various techniques like EDA to reach to a conclusion.
3.2. Data Pre-Processing
The next step after collecting Data is Data Processing. Data directly obtained from a data
source such as dataset is known as Raw data. We can’t apply various techniques or Machine
Learning Algorithms like Linear Regression, Decision Tree, SVM etc directly to the Raw Data.
This Data need to be processed and converted into useful data. Data Pre-Processing is the
process of translating the Raw data into Useful data by conscientiously checking for errors and
eliminating redundant, incomplete, or incorrect data.
The Dataset consists of various fields like Age, Gender, etc which consists of some null values
which produces errors in the end result which is the Visualization of data in graphical format.
These null values are needed to be omitted or replaced with some valid value which solves
the error and generates accurate result. We have used a technique known as Deterministic
Imputation to complete this task. Deterministic Imputation is a situation where the null values
(NA or NaN) are determined with the help of the other values in the same column in the dataset.
For this purpose, there are various models such as Basic Numeric Imputation Model in which
the null value is replaced by Mean or Median of other values of the same column of the dataset.
There is another model known as Hot Deck Imputation in which the null value is replaced by
similar record in the dataset, i.e., some other value in the same column. Hot Deck Imputation
can be applied to both Numerical as well as the Categorical value, but only if it contains enough
values in the same column.
3.3. Exploratory Data Analysis
The next step after data pre-processing is data analysis. In this step, analysis is done on data
using various Techniques like Text Analysis, Diagnostic Analysis, Exploratory Data Analysis,
etc and Machine learning Algorithms like Linear Regression, Logistic Regression, SVM, Decision
Tree etc to reach to a particular conclusion.
As our field of Research is visualization and comparative study of various factors which
leads to the Evolution of Olympic games over the time, We are using the Exploratory Data
Analysis technique to complete this task. Exploratory Data Analysis (EDA) is an approach to
analyze data thoroughly and encapsulate its primary attributes basically in visual format. [8]
Exploratory Data Analysis is mainly used to see what the data represents apart from applying
various algorithms. [8] With the help of EDA, we can understand the structure and content of
the dataset by various types of graphs and plots which can be drawn with the help of EDA.
There are various types of plots which used in EDA. Some of them are mentioned below:
• Histogram
• Bar Graph
• Box Plot
• Scatter Plot
and many more. We can View the data in the visual format and can explain the analysis on
that basis and also perform a Comparative Study between different plots.
4. Experimental Setup And Result Analysis
4.1. Experimental Setup
Analysis on any type of data cannot be done without the help of Programming Language and
a platform on which we can perform the Analysis with the help of Programming language.
A Programming Language is a conventional language which consists of the various set of
instructions by which one can produce a specific output by taking data from the system or
5ASCI-2020 IOP Publishing
IOP Conf. Series: Materials Science and Engineering 1099 (2021) 012058 doi:10.1088/1757-899X/1099/1/012058
by providing custom input. There are various programming languages which are used for the
purpose of Data Analysis. Some of the widely used programming languages for Data Analysis
are - Python, JavaScript, Scala, R, SQL, Julia and many more. With the help of any of these
Programming, one can perform Analysis over data by applying various techniques.
For our Project we have chosen R as the programming language and RStudio as the platform
where we have analyzed the data using R language. R is a programming language used for
Analytical Computation and Graphical Representations. [9] It consists more than 10000 inbuilt
packages.R provides various analytical techniques like linear and nonlinear modeling, Time Series
Analysis, Clustering, Classification, etc and various Graphical Techniques, which makes it an
ideal language for our task which is visualization of various factors which contributes in the
evolution of Olympic Games over the years. Launched in 2011. RStudio is an open source IDE
for R programming language written in C++, Java, JavaScript. It includes various R packages
like Tidyverse, TensorFlow, Reticulate and many more.
For our purpose, we have used various packages of R Language and imported them in RStudio
to work with them. Some of them are :
• Tidyverse - Tidyverse is a dictatorial collection of various R packages which are used in
the field of Data Analysis. The Packages included in Tidyverse are ggplot2, dplyr, tidyr,
readr, purrr, tibble, stringr, and forcats.
• ggplot2 - Released in 2005, ggplot2 is a package used to visualize almost all type of data
in any format into graphs. It is one of the most popular packages of R Language.
• readr - readr package is used to read Rectangular Data like csv (Comma Separated Values),
tsv (Tab Separated Values), and fwf files.
• dplyr - dplyr package is used to make Data Manipulation easier. It provides various
methods which helps to manipulate data. Some functions in the dplyr package are mutate(),
select(), filter(), summarize(), arrange() and many more.
• readxl - readxl package is used to import data from the excel file. Data in xlsx, xls can be
imported using readxl.
4.2. Result Analysis
The main objective of this research work is to analyze and represent the various factors which
have contributed in the Evolution of the Olympics over the time in Graphical Format and
perform a comparative study between the various factors. For this purpose we have used R
programming Language which consists of which consists of various Packages which make it
easier to analyze and visualize the data. We have analyzed many factors (fields) present in the
dataset and plotted various graphs which clearly depicts the change in the trends of Olympic
Games over the years. Some of the findings of our research are given below :
4.2.1. To Find out the number of Participating Countries in Olympic Games Over the Time
[10]. In this Analysis, we have find out Change (Increment or Decrements) in the number
of participating countries [10] in Olympic Games (Both Summer and Winter) over the time.
We have plotted a line graph where lines represent Summer and Winter Olympics and Points
represent the exact number of countries(See Figure 3). We can see from the above graph that
initially, only Summer Olympics were used to held till 1924. The number of participating
countries have increased over the time, but there is a certain period of time in both Summer and
Winter Olympics where the count of Participating Countries have decreased. We can also see
that the number of Participating countries are always greater in Summer Olympics in comparison
with Winter Olympics.
6ASCI-2020 IOP Publishing
IOP Conf. Series: Materials Science and Engineering 1099 (2021) 012058 doi:10.1088/1757-899X/1099/1/012058
Figure 3. This Graph explains the number of Participating Countries in Olympics Games,
both Summer and Winter, over the Time since 1896.
4.2.2. To Find the Density of Players in Olympic Games on the Basis of Age. In this Analysis,
we have find out the density of the Players among all the nations who have participated in
Olympic Games on the Basis of Age. For this we have plotted a Density Graph where intercept
shows the Age of which, maximum players have participated in Olympic Games (See Figure 4).
Initially, the graph grows exponentially till 23-27 years of age which means that there are less
players whose age is less than 18 years and the maximum number of players belongs to the age
group of 23-27 years. After this age group, the graph falls exponentially which indicates that as
the age increases, the number of players belonging to that age group decreases. We can also see
that there is no player after the age of approximately 45 years.
4.2.3. To Find out the Total number of Medals won by various countries in Olympic Games.
In this Analysis, we have find out the total number of Medals (Gold, Silver and Bronze) won by
various countries in Olympic Games. For this purpose we have plotted a Horizontal Bar Graph
in which X-Axis shows the number of Medals and Y-Axis shows the List of some Participating
countries(See Figure 5). From this graph we can see that the USA has won the maximum
number of medal (4383), which is far greater than the Medal count of Russia (3610) which is
on 2ND Position. We can also observe from this graph that as we move down, the difference
between Medal count decreases.
4.2.4. To Find the number of Male and Female Participants In Olympic Games in different
years. In this Analysis, we have find out the total number of Male and Female Participants
in different seasons of Olympic Games. For this purpose we have plotted a Line Graph where
lines represent Gender and points on that line represent the count of the Male and Female
participants(See Figure 6). From the above plot, we can clearly see that initially there were no
female participants in the Olympics till the 1920s. Only men used to take part in the event.
After the 1920s female start taking part in the event. We can also see that the number of male
and female players started increasing rapidly after the 1950s, but the number of Male Players
7ASCI-2020 IOP Publishing
IOP Conf. Series: Materials Science and Engineering 1099 (2021) 012058 doi:10.1088/1757-899X/1099/1/012058
Figure 4. This Graph Explains the Density of Players in Olympic Games on the Basis of Age.
Figure 5. This Graph Explains the Total number of medals won by various countries in Olympic
Games over the Time.
are always less than Female Players. This graph also depicts that as the time increases, female
participation in Olympic Games also increases.
4.2.5. To Find Height of the players who have won the maximum number of Medals. In
this Analysis, we have find out the median height of the players who have won the maximum
number of Medals (Gold, Silver and Bronze). For this purpose we have plotted a Scatter plot
in which scatter points represent the Median height of the players corresponding to the number
of Medals and the Black line represent the line of Linear Regression as the Best fitting line(See
Figure 7). From this graph we can see that the Players with very less median height as well as
the Players with very high median height did not won a large number of medals. The Maximum
number of Medals has been won by the Players having the Median height between the range of
8ASCI-2020 IOP Publishing
IOP Conf. Series: Materials Science and Engineering 1099 (2021) 012058 doi:10.1088/1757-899X/1099/1/012058
Figure 6. This Graph Explains the Total number of Male and Female Participants in Olympic
Games over the time.
165cm-190cm.
Figure 7. This Graph explains the Median Height of Athletes in Olympics Games who have
won maximum number of Medals .
4.2.6. To Find Weight of the players who have won the maximum number of Medals. In this
Analysis, we have find out the median Weight of the players who have won the maximum number
of Medals (Gold, Silver and Bronze). For this purpose we have plotted a Scatter plot in which
scatter points represent Median Weight of the players corresponding to the number of Medals
and the Black line represent the line of Linear Regression as the Best fitting line(See Figure 8).
From this graph we can clearly see that the Players with very less median Weight as well as the
Players with very high median Weight did not won a large number of Medals. The Maximum
9ASCI-2020 IOP Publishing
IOP Conf. Series: Materials Science and Engineering 1099 (2021) 012058 doi:10.1088/1757-899X/1099/1/012058
number of Medals have been won by the Players having Median Weight between the range of
60Kg - 85Kg. These are some of the main Factors which we have Analyzed using Exploratory
Figure 8. This Graph explains the Median Weight of Athletes in Olympics Games who have
won maximum number of Medals.
Data Analysis and obtained the Results mentioned above.
5. Conclusion
The main Objective of this study was to Analyze and visualize the various factors which have
contributed in the Evolution of Olympic Games over the years. These type of Analysis are very
helpful as this type of Analysis can be performed by any Country or Player which can help them
in analyzing their performance so that they can improve their performance by changing their
strategies.
We have used a technique named as Exploratory Data Analysis which enables you to
encapsulate the primary factors of a dataset into visual format. We selected R language to
implement our work because It is one of the best language suitable for Data Analysis and
RStudio as the platform where we have preformed this Analysis. As the result of Analysis,
we can conclude that It is true that Olympic Games have evolved considerably over the time
since 1896 Olympic Games till 2016 Rio Olympics. There are various factors which provides
the valid evidence that the Olympics have changed a lot. some of these factors are launch of
Winter Olympic Games apart from Summer Olympic Games in 1924, Increase in the number
of participating countries in both Summer and Winter Olympics, the Average age of players in
Olympic Games, the increase in the participation of the females in both Summer and Winter
Olympics over the time, the Total number of medals won by various participating countries over
the years, Average height and the weight of Players who contributes to victory of Games in the
event. Apart from these there are many more factors which depicts the Evolution of Olympic
Games over the time. Visualization of these factors has been done to explain and validate the
Analysis in various Graphical formats like a Line graph, Scatter Plots, Bar Graphs, Density
Plots etc.
6. Future Scope
We all know that any Analysis is not perfect and it consists of some limitations which defines
the Future scope of the Research Work. This project work also contains some limitations which
we are considering as Future Scope of the Project. These are:
10ASCI-2020 IOP Publishing
IOP Conf. Series: Materials Science and Engineering 1099 (2021) 012058 doi:10.1088/1757-899X/1099/1/012058
• We have visualized our data only in Graphical format. We can also describe the data in
other formats like Geographical format where we can depict the countries on the World
map.
• Till now we have only performed Data Analysis using Exploratory Data Analysis. We can
also apply various Machine Learning Algorithms on the data set after Analysis and can
create a Predictive Model which can predict the statistics of Future Olympic Games.
• We can also perform Correlation Analysis on the data set and analyze the relation between
two continuous variables.
References
[1] Wikipedia contributors: https://en.m.wikipedia.org/wiki/Olympic Games, last accessed 2020/11/02.
[2] Dey S K, Rahman M M, Siddiqi U R and Howlader A 2020 Analyzing the epidemiological outbreak of
COVID-19: A visual exploratory data analysis approach J. Med. Virol. 92 632–8
[3] Bondu R, Cloutier V, Rosa E and Roy M 2020 An exploratory data analysis approach for assessing the
sources and distribution of naturally occurring contaminants (F, Ba, Mn, As) in groundwater from southern
Quebec (Canada) Appl. Geochem. 114 104500
[4] Cutait, M.: Management performance of the Rio 2016 Summer Olympic Games. Research Paper submitted
and approved to obtain the Master’s degree in Sports Administration at AISTS in Lausanne, Switzerland.
[5] Moreno A, Moragas M and Paningua R 1999 The evolution of volunteers at the Olympic Games Proceedings
of Symposium on Volunteers (Lausanne, Switzerland: Global Society and the Olympic Movement) pp 1–18
[6] Abeza G, Braunstein-Minkove J R, Séguin B, O’Reilly N, Kim A and Abdourazakou Y 2020 Ambush
marketing via social media: The case of the three most recent Olympic Games Int. J. Sport Communication
1–25
[7] Yamunathangam D, Kirthicka G and Shahanas P 2018 Performance Analysis in Olympic Games using
Exploratory Data Analysis Techniques International Journal of Recent Technology and Engineering
(IJRTE) 7 251–3
[8] Wikipedia contributors: Exploratory data analysis, https://en.wikipedia.org/wiki/Exploratory data analysis,
last accessed 2020/11/11.
[9] Ramachandran K. M. and Tsokos C P 2020 Mathematical statistics with applications in R (Academic Press)
[10] Lange D Summer Olympics: number of participating countries 1896-2016 Statista.com
11You can also read