Analyzing the Online Reputation and Positioning of Airlines
←
→
Page content transcription
If your browser does not render page correctly, please read the page content below
sustainability

Article
Analyzing the Online Reputation and Positioning
of Airlines
Ayat Zaki Ahmed           and Manuel Rodríguez-Díaz *
 Department of Economics and Business, University of Las Palmas de Gran Canaria, 35001 LasPalmas, Spain;
 ayatzaki@hotmail.com
 * Correspondence: manuel.rodriguezdiaz@ulpgc.es; Tel.: +34-928-452-805

 Received: 18 December 2019; Accepted: 1 February 2020; Published: 6 February 2020

 Abstract: The aim of this study is to propose a methodology to define the positioning of airlines
 in terms of their online reputation measured with quantitative variables and applied in the airline
 industry. Reviews shared on the Internet give key information about service quality and value as
 perceived by customers. To carry out the empirical study, we obtained the information available on
 TripAdvisor about airlines in Europe, the USA, Canada, and other countries in America, differentiating
 also between airlines that follow a low-cost strategy and those that do not apply it. The results
 show that there is a significant difference in key service quality variables between airlines in the
 different geographical areas studied on the one hand, and the low-cost strategy applied on the other.
 The variables to be used to conduct the positioning analysis in the airlines are determined. They also
 show that the methodology has relevant practical implications and provides tools to further develop
 research related to the online reputation and strategic positioning of airlines.

 Keywords: online reputation; airlines; market positioning; customer value; service quality; online
 customer review

1. Introduction
      Customers’ ratings of a product, service, or brand through different social media on the Internet
constitute its online reputation [1–4]. Currently, the image transmitted through the Internet is a key
factor in the ability to compete. To some extent, it is beyond the control of companies because customers
or users can freely share their opinions. Moreover, unreal or biased opinions aimed at conditioning the
reputation of brands or companies may be expressed [5,6]. All customer messages and evaluations
over the Internet make up the current word-of-mouth or E-WOM communication [7–12]. However,
although some of this information is generated outside companies, they can develop strategies to make
this feedback fit reality. In this context, the analysis of the credibility of sources of online reputation
and E-WOM is essential to define the most reliable communication channels over the Internet [13,14].
Likewise, companies can take advantage of the synergies produced by shared opinions, obtaining high
visibility and impact in different social media [15,16]. The online reputation gap analysis proposed by
Rodriguez-Díaz et al. [17] suggests tools or methods designed to ensure that the online reputation
coincides as closely as possible with the perceptions customers have when they receive a service or
buy a product.
      Kotler and Armstrong [18] consider that positioning is based on designing the company’s
marketing strategy in such a way that it holds a clear and valued place in the minds of consumers.
Thus, the positioning of a brand, product, or service is the place it holds in the minds of consumers
in relation to its competitors. Adequate positioning is essential for the company’s brand image or
goods and services, and it is a fundamental tool to differentiate it from competitors. From a practical
perspective, positioning consists of an association or relationship between a brand or product and a

Sustainability 2020, 12, 1184; doi:10.3390/su12031184                     www.mdpi.com/journal/sustainability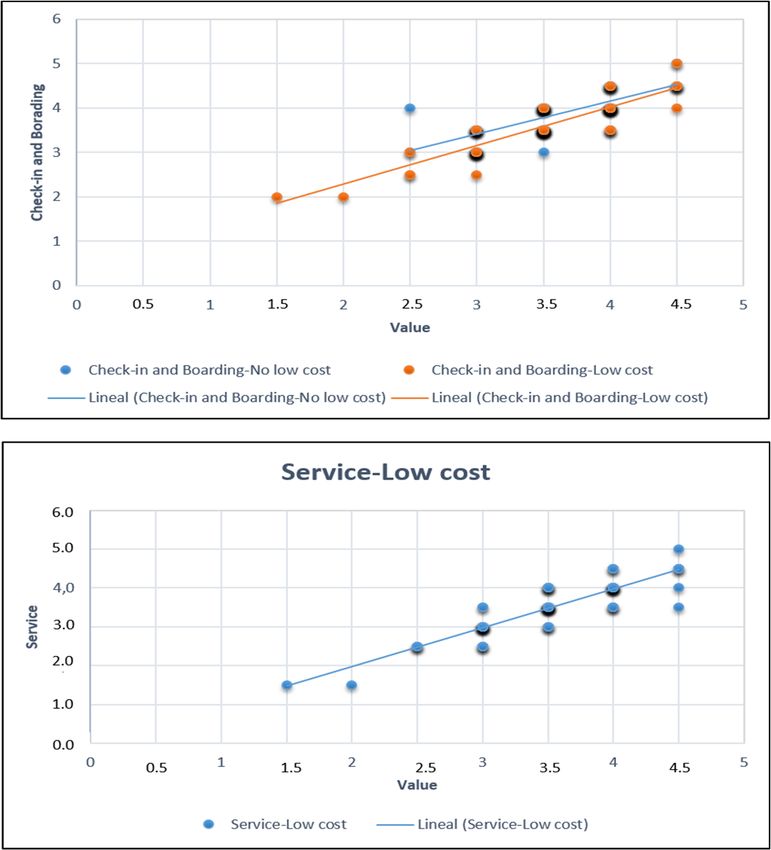
Sustainability 2020, 12, 1184                                                                         2 of 27

series of attributes that customers have the ability to identify and evaluate in relation to competitors.
Based on this approach, the online reputation provides customer assessments of key attributes of
brands, products, or services that compete with each other in the same market [19]. Therefore, it is a
new way to easily obtain information about the position of different competing products or services in
the minds of customers.
      Ratings of online reputation can be quantitative and qualitative, and they are currently a powerful
tool for attracting demand, increasing revenue, and achieving a position ahead of competitors [20–22].
The opinions shared through quantitative variables are usually structured on measurement scales
of attitudes and perceptions. Therefore, customer ratings can be evaluated using conventional
statistical techniques that determine the degree of reliability and validity of the scales [23,24]. Likewise,
these types of variables allow competitive positioning studies to be carried out using a relatively
simple procedure [25]. In this context, positioning is determined through customer ratings of certain
variables that measure key attributes of products, services, or brands that compete directly in the
market [19,26–29].
      Quantitative evaluations on the Internet often measure a small number of variables in order to
encourage clients to fill out surveys [5,15,16,25,30,31]. Generally, scales of less than eight variables are
used to measure the perceived service quality and, in many cases, the perceived value construct [32–34].
By contrast, qualitative assessments are obtained from the opinions written by users. Through content
analysis, firms can measure customer satisfaction, which is more related to experiences, emotions,
and feelings that generate a positive or negative affective state in the customers of the service or product
consumed [15,35,36]. Online reputation has been widely studied in the tourism sector, with a great
impact on capturing the demand for hotels [37]. From the perspective of quantitative research, online
customer ratings have been used preferentially on the specialized websites of TripAdvisor, Booking,
and HolidayCheck [25,38–41]. However, in the airline sector, research has been limited, especially in
the statistical analysis of the scales and competitive positioning studies [42–44].
      The objectives of this study are twofold: (1) to propose a methodology for positioning analysis
based on online reputation measured with quantitative variables and (2) to apply this methodology to
the airline sector in order to demonstrate that, as in the hotel sector, competitive positioning studies can
be carried out based on the online opinions of customers with quantitative variables. TripAdvisor uses
a scale where most of the variables measure the perceived quality of service, using a single variable to
determine the value perceived by users [45]. The value construct is usually measured in different ways
using the variable “value for money” or “ price–quality relationship”. It is quite interesting to analyze
the relationship between the service quality and the perceived value in the online reputation because
as they are related constructs and usually used to establish the predictive validity of service quality
scales. Because value is a concept that involves price, it is very useful in determining the competitive
positioning of brands or companies in the market [19]. Today, positioning is an essential factor in
gaining a competitive advantage through differentiation or cost leadership, by offering relevant Internet
information to determine how an airline is rated by its customers in relation to its competitors.
      The article begins with a review of the literature on online reputation and the importance it has in
different service companies such as airlines. Next, the methodology applied in the empirical study is
explained. Subsequently, the results obtained in the statistical analyses and in the positioning of the
airlines based on the constructs of perceived value and perceived service quality are presented. Finally,
the main conclusions drawn and the most relevant practical and research implications are described.

2. Literature Review
     The reviews clients share on the Internet have been used in various research studies in the services
sector [19,25–29]. Mudambi and Schuff [4] consider online customer opinions to be quantitative
or qualitative evaluations of brands, products, or services that are transmitted to other users and
companies through social media available on a website. From this perspective, online opinions are
becoming a new source of information to measure the quality of the service and the perceived value of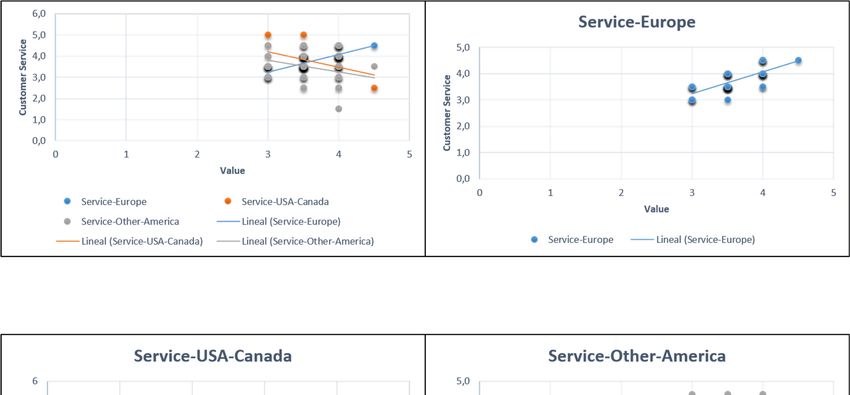
Sustainability 2020, 12, 1184                                                                          3 of 27

the products or services consumed [23,24,33]. In this context, online reputation is a simple and useful
way to measure customer perceptions [20,46–48] and establish the level of satisfaction obtained [49–53].
      Online reputation is generated through an open and dynamic process based on the ratings of a
product, service, brand, or company that customers share on the Internet [2,54], creating an image
that conditions the buying attitude of other potential customers [1,17]. To the extent that the online
reputation is generated through the assessment of scales of variables and opinions, it can be measured
with three essential concepts: perceived service quality, perceived value, and satisfaction. In this
context, Torres [34] points out that service quality is normally measured with specific quantitative
variables, whereas satisfaction is a general appraisal related to experience and emotions. In this regard,
Rust and Oliver [55] establish the differences between service quality and satisfaction by stating that,
whereas the former is usually measured with quantitative variables, satisfaction is usually established
with more generic qualitative evaluations that may also include attributes of service quality.
      Service quality is measured through customers’ perceptions every time they receive a service [32,56–60].
By contrast, satisfaction is the consequence of diverse experiences, where a client determines what he
feels and values about the product or service received [49–51]. Based on these considerations, the scales
of variables used by the specialized TripAdvisor, Booking, and HolidayCheck websites normally
measure service quality attributes or perceived value [23,24]. In addition, the written comments
left by users on these websites gather essential information about the satisfaction obtained. This
study analyzes the online reputation of airlines based on TripAdvisor’s scale of variables. Therefore,
these dimensions quantitatively measure perceived service quality, using a single variable to measure
perceived value [25].
      The quality of service has been studied with various scales of variables [61–65], especially the
SERVQUAL formulated by Parasuraman et al. [56], which is composed of five dimensions or underlying
factors (tangibility, reliability, responsiveness, security, and empathy). However, specialized web pages
tend to use scales with a lower number of variables in order to encourage users to share their evaluations
on the Internet. In this regard, Rodríguez-Díaz and Espino-Rodríguez [23] statistically analyze the
quantitative variable scales of TripAdvisor, Booking, and HolidayCheck, demonstrating their reliability
and validity for measuring perceived service quality. Therefore, reducing the number of variables to
assess service quality requires a careful selection of variables to measure basic attributes [15,16].
      Research carried out by Ye et al. [25] and Rodríguez-Díaz et al. [19] demonstrates that the
TripAdvisor and Booking scales for assessing online reputation actually measure two concepts:
perceived service quality and perceived value. Service quality is determined by most of the scales’
variables, whereas perceived value is measured by a single item. Value is a subjective concept related
to what a customer receives from a product or service in relation to the cost of acquiring it [48,54,65].
Perceived value is usually measured with multiple-item scales [30,66–68]. Nevertheless, according
to Prebensen et al. [45], on certain occasions it is measured with only one item. This is the case of
online reputation, where TripAdvisor, Booking, and HolidayCheck evaluate the perceived value in
the tourism sector with a single variable. For the airlines, TripAdvisor has developed a scale of eight
specific variables to measure online reputation, using a single item (value for money) to measure
perceived value.
      There is a strong relationship between airline image and reputation which influences the processes
of the positioning of airlines. Reputation theory was originally developed in the 1950s when the concept
of corporate image emerged [69,70]; it was also defined as the customer’s accumulated impression
of a company resulting from their interactions with the company [71]. Airline image is built on
communication programs like advertising mechanisms [72] and social media [73]. The airline image is
defined as the immediate mental picture that passengers have of an organization [74]. A favorable
reputation has a positive influence on the company’s success [75] and good airline image may enhance
its reputation. Chen [76] demonstrated that the customer’s general attitudes towards an airline have
a positive effect to their loyalty. In the air travel industry, companies make a lot of efforts to build
powerful brand images aiming to increase passenger trust [77]. Service is one of the important factors
Sustainability 2020, 12, 1184                                                                        4 of 27

for determining the airline image, whereas other attributes like schedules and fare offers have little
influence on corporate image [78]. Airlines can use market brand positioning to identify major strengths
and weaknesses within their services such as comfort of seats, cleanliness, check-in and boarding,
airline image, and travel cost and time [79]. The study conducted by Lucini et al. [80], based on content
analysis of online opinions of airline customers, determines the dimensions of customer satisfaction,
making a prediction of the possibility of recommending the airline or not. It is a very interesting
study because it is based on the qualitative opinions that customers share on the Internet. However,
the analysis of quantitative variables is also of great interest, insofar as it provides generalizable
information that can be a powerful business management tool.
      Kotler and Armstrong [18] state that positioning must be defined on the basis of customers’
assessments of a brand or product in relation to its competitors. Implementing a positioning strategy
requires taking into account that differentiation is a decisive factor in companies’ competitiveness.
Furthermore, the product must be difficult to imitate in the short term, it must bring benefits that the
customer values, and it must be profitable for companies. Therefore, positioning is an essential tool in
marketing in general and, nowadays, in digital marketing, because users increasingly become informed
on the Internet before making their purchase decisions [81]. From this perspective, the competitiveness
that companies obtain through adequate positioning is a means to achieve an economic result that is
sustainable over time in an increasingly dynamic market [82].
      Positioning is a basic tool for defining a company’s competitive strategy. Hooley et al. [26] consider
that the position a company decides to occupy in the market is a combination of the target market
it wants to reach and the differential advantage it wants to develop to guarantee that target market.
This means that competitive positioning must be based on detecting the needs of consumers, in order
to satisfy them under better conditions than competitors. Therefore, the market is what determines
the positioning of companies, and the clients rate them according to a set of variables [27]. In relation
to online reputation, it is evident that it provides key variables to measure the service quality and
value perceived by customers. From this perspective, the online reputation gives market information,
not only about a particular company, but also about its competitors [81]. This information facilitates
the development of companies’ competitive positioning in highly relevant service sectors, such as
hotels or airlines.
      Obviously, Internet positioning studies can be carried out by analyzing different types of variables
from different viewpoints [81,83,84], but in this case it is analyzed from the perspective of competitive
marketing positioning. The online reputation produces information that is immediately transmitted
to any potential client, communicating a mental image of a brand or product in relation to its
competitors [19]. Ratings shared through social media influence customers’ purchasing behavior and,
therefore, their income and competitiveness [85,86].
      This study carries out an analysis of the online reputation of airlines, based on the scale of
quantitative variables used by TripAdvisor. This scale basically measures the perceived service quality
with seven variables, using a question to measure the value perceived by customers [19,25]. With these
data, a study of competitive positioning is undertaken, where perceived value plays an essential role
because it intrinsically incorporates the price of the goods in the rating [67,81].

3. Research Methodology
     The methodology proposed to carry out a positioning analysis based on online reputation
measured with quantitative variables is shown in Figure 1. We propose eight stages that begin
by determining the web or social media from which the information will be extracted to make the
positioning analysis. From this perspective it can be seen that each website has a different scale of
variables with different response alternatives [23]. The second step is to obtain information from a
relevant number of companies competing in the same sector that will guarantee a representation of the
market under study. It is essential to obtain a minimum amount of data that guarantees the reliability
of the statistical analyses that are carried out. The sample must include data from the company or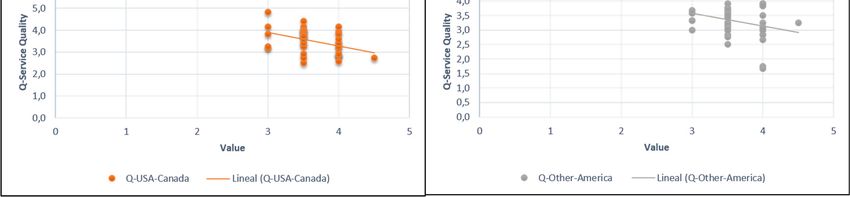
determine the dimensions to be used in the positioning analysis. In this study the variables of
perceived service quality and perceived value are used. Therefore, it must be shown that there is a
significant relationship between both constructs, either at the level of service quality variables or as
a joint factor.
      Once the
Sustainability 2020,information
                     12, 1184   has been tested to be reliable and valid and the key variables and factors
                                                                                                     5 of 27
to perform the positioning analysis have been identified, a new, more specific selection of more direct
competitors can be made in step seven. In this study, the study was carried out both globally and by
brand carrying out the study as well as from the most direct competitors. The next step is to identify
groups of companies. Given that each company must set the selection criteria for the sample in which
the scale of variables that the web uses to measure online reputation. Each of the variables must be
it is most interested, in this study we have proceeded to apply the positioning methodology by
analyzed in order to determine if it really affects specific attributes that depend exclusively on the
categorizing the airlines according to two criteria. On the one hand, they have been classified
management of the companies. For example, Wi-Fi is an essential aspect for the competitiveness of
according to the market in which they operate, differentiating between Europe, the USA, and Canada.
hotels but, in many cases, having good connectivity also depends on external agents that provide
and the rest of the countries in America. A second classification has been made according to if their
the connections. In step four we proceed to analyze the content of the scale of variables in terms
strategy is low-cost or not. The purpose is to monitor more specifically those competitors that can
of the constructs being measured. A characteristic of scales to assess online reputation is that they
have a greater influence on the market segments a company or brand is targeting. Finally, positioning
have a very limited number of quantitative variables that normally measure perceived service quality,
analyses are carried out either at a global level or with more specific competitors depending on the
and sometimes only one variable is included to measure perceived value [45].
variables and key factors identified.

     Figure 1. Methodology for positioning analysis based on online reputation measured with
     quantitative variables.

     The fifth step focuses on analyzing the reliability and validity of the scale of quantitative variables.
This is an essential aspect to demonstrate that the online reputation information collected on the web
can be used to perform competitive positioning analysis. The sixth step identifies the variables and
factors that are significant to use in positioning analysis. To do this, it is necessary to determine the
dimensions to be used in the positioning analysis. In this study the variables of perceived service
quality and perceived value are used. Therefore, it must be shown that there is a significant relationship
between both constructs, either at the level of service quality variables or as a joint factor.
     Once the information has been tested to be reliable and valid and the key variables and factors to
perform the positioning analysis have been identified, a new, more specific selection of more direct
competitors can be made in step seven. In this study, the study was carried out both globally and
by groups of companies. Given that each company must set the selection criteria for the sample in
which it is most interested, in this study we have proceeded to apply the positioning methodology
by categorizing the airlines according to two criteria. On the one hand, they have been classified
according to the market in which they operate, differentiating between Europe, the USA, and Canada.
and the rest of the countries in America. A second classification has been made according to if their
strategy is low-cost or not. The purpose is to monitor more specifically those competitors that can
have a greater influence on the market segments a company or brand is targeting. Finally, positioning
analyses are carried out either at a global level or with more specific competitors depending on the
variables and key factors identified.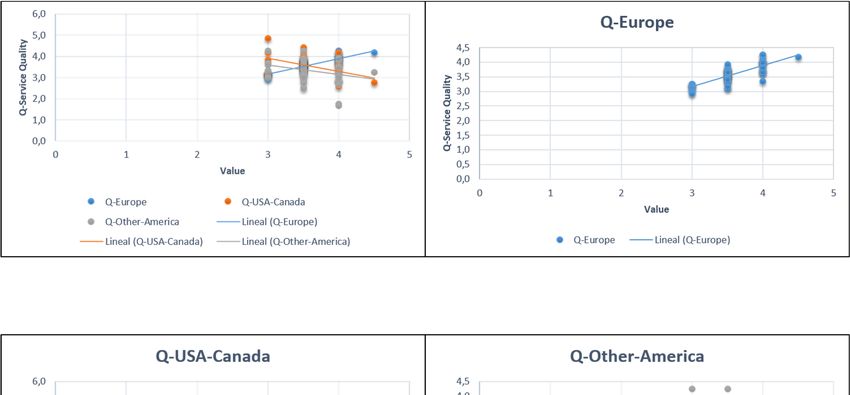
Sustainability 2020, 12, 1184                                                                        6 of 27

      The empirical study was carried out taking into account the TripAdvisor ratings of 134 airlines.
The total number of comments used to obtain online reputation scores was 641,448. Fifty-one airlines
are from Europe, 21 from the United States, 15 from Canada, and 47 from other American countries.
The study can be carried out by grouping the airlines according to different rules. In this case, the
geographical area where the companies are most active is the criterion used. The purpose is to detect
whether there are significant differences between customers depending on where they reside. The aim
of this study is to demonstrate that the methodology proposed to conduct competitive positioning
based on online reputation is feasible and useful for airlines.
      In order to apply the statistic methodology through the factor analyses, regressions, and positioning,
groups of companies were formed according to two criteria: (1) the geographical area where they fly
and (2) the low-cost or non-low-cost strategy followed by the airlines. In relation to the geographical
areas, one cluster was formed with the European airlines (352,277 reviews); one cluster contained the
rest of the American countries (87,268 reviews); and, finally, the airlines from the United States and
Canada were combined in the same cluster containing a total of 36 companies and 202,405 customer
online evaluations (see Table 1). The TripAdvisor scale has five alternatives for rating airlines, where
1 is “terrible”, 2 “poor”, 3 “average”, 4 “good”, and 5 “excellent”. This scale of variables has been
statistically validated in different studies, such as those conducted by Ye et al. [25] and Rodríguez-Díaz
and Espino-Rodríguez [23]. With regard to the strategy implemented, in Table 1 the airlines that follow
a low-cost strategy are marked with an asterisk.

                                         Table 1. Airlines studied.

                 EUROPE                    USA and CANADA             OTHER COUNTRIES IN AMERICA
             Aegean Airlines                Mokulele Airlines                * Andes Lineas Aereas
                 Canaryfly             * Southern Airways Express                   Avianca
                Air Europa                * Tradewind Aviation               Aerolineas Argentinas
                 Air France                  * Avior Airlines                Austral Lineas Aereas
                   Alitalia                  * Laser Airlines                     * Flybondi
            American Airlines                Alaska Airlines                   LATAM Airlines
              Binter Canarias                * Allegiant Air                    * Aruba Airlines
              British Airways               American Airlines                    * Bahamasair
            Caribbean Airlines               Delta Air Lines                    Maya Island Air
               Cathay Pacific               * Frontier Airlines                Tropic Air Belize
                  * Condor                  Hawaiian Airlines                        Azul
            Ethiopian Airlines                   * JetBlue                      * GOL Airlines
              Etihad Airways               * Southwest Airlines            Passaredo Linhas Aereas
                * Eurowings                  * Spirit Airlines                 Cayman Airways
                  * Evelop               * Sun Country Airlines                    * JetSmart
           * Germania Airlines               United Airlines                     * Sky Airline
                    Iberia                      Cape Air                           * EasyFly
              * Iberia Express                Elite Airways                  * SATENA Colombia
          * Japan Airlines (JAL)             * Silver Airways                   * VivaColombia
                 * Jet2.com                     * Via Air                           * Wingo
       KLM Royal Dutch Airlines             * Air Choice One                     * Nature Air
          * LOT Polish Airlines                Air Canada                          * SANSA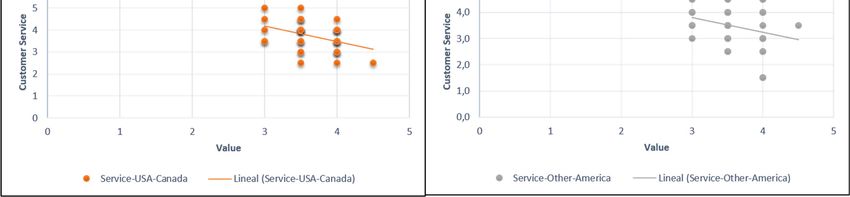
Sustainability 2020, 12, 1184                                                                           7 of 27

                                                  Table 1. Cont.

                 EUROPE                       USA and CANADA            OTHER COUNTRIES IN AMERICA
                 Lufthansa                    * Air Canada Rouge                     Aerogaviota
            Malaysia Airlines                      Air North                  * Cubana de Aviacion
               * Norwegian                        * Air Transat                   * PAWA Dominicana
                Olympic Air                     Bearskin Airlines                      * TAME
                  * Qantas                      Canadian North                      Air Greenland
              Saudia Airlines                * Central Mountain Air                  * Air Antilles
             Brussels Airlines                      First Air                        Air Caraibes
              China Airlines                     * Flair Airlines                  * Aerolineas Sosa
                  * EasyJet                  Pacific Coastal Airlines                CM Airlines
                  * Finnair                          Pascan                            Aeromar
               * Aer Lingus                      Porter Airlines                    * Aeromexico
                 * Aeroflot                       PAL Airlines                     * Calafia Airlines
           * SriLankan Airlines                * Sunwing Airlines                      * Interjet
      Swiss International Air Lines                 * WestJet                      * Magnicharters
               TAP Portugal                                                        * TAR Aerolineas
                 * TAROM                                                               * Volaris
               Thai Airways                                                          Air Panama
     * Thomas Cook Airlines (UK)                                                    * Copa Airlines
 * Thomas Cook Airlines Scandinavia                                               * Peruvian Airlines
                * Transavia                                                           * Star Peru
       * TUI Airlines Netherlands                                                   * Air Flamenco
   * TUI Airways (United Kingdom)                                                 * Seaborne Airlines
 * TUI fly Belgium (formerly Jetairfly)                                           * Vieques Air Link
           * TUIfly (Germany)                                                          * Winair
                 * Tunisair                                                       * Surinam Airways
             Turkish Airlines
     Ukraine International Airlines
            * Vueling Airlines
                 * Wizz Air
                                                * Low-cost airlines.

     Table 2 displays the description of the eight variables on the scale to determine the online
reputation of airlines in TripAdvisor. The variables used to measure the perceived service quality are:
comfort of seats (Cs), check-in and boarding (Cb), food and drink (F), space for legs (Sl), service (Sv),
cleanliness (CL), and entertainment (E). To establish the value perceived by customers, TripAdvisor
uses the variable “value for money” (V). From these evaluations, TripAdvisor calculates the “airline’s
average score” (AAS), which is the mean obtained with this formula:

                                          (Cs + Cb + F + Sl + Sv + Cl + E + V )
                                  AAS =
                                                            8
Sustainability 2020, 12, 1184                                                                                8 of 27

                                      Table 2. Description of variables.

              Variables                                           Description
  Airline’s average score (AAS)            Reviewer’s overall evaluation of the airplane and airline
       Comfort of seats (Cs)           The overall reviewer rating of the comfort of seats of the airplane
                                    The overall reviewer rating of the processes of check-in and boarding
   Check-in and boarding (Cb)
                                                                 the airplane
         Food and drink (F)       The overall reviewer rating of the food and drink served during the flight
         Space for legs (Sl)            The overall reviewer rating of the space for legs in the airplane
                                  The overall reviewer rating of the service received during the flight and by
             Service (Sv)
                                                                   the airline
           Cleanliness (Cl)              The overall reviewer rating of the cleanliness of the airplane
         Entertainment (E)            The overall reviewer rating of the entertainment during the flight
        Value for money (V)       The overall reviewer rating of the perceived value of the airplane and airline

    Ye et al. [25] differentiate between the variables to measure the perceived service quality
and the variable used by TripAdvisor to determine the perceived value. Along the same lines,
Rodríguez-Díaz et al. [19] establish the variable Q, calculated with the average of the service quality
dimensions in the hotel reputation online scales. Adapting the variable Q to the airplane sector, its
value is determined with the following formula:

                                        (Cs + Cb + F + Sl + Sv + Cl + E)
                                  Q=
                                                       7
     The main differences between this research and that carried out by Rodríguez-Díaz et al. should
be highlighted at this point [19]. Firstly, while the research cited focuses on the tourism sector, this one
focuses on airlines. Secondly, the methodology followed for positioning based on online reputation
with quantitative variables is not specified with the same precision and breadth as in the study by
Rodríguez-Díaz et al. Thirdly, tourist accommodations are evaluated on the basis of information
available in Booking, while this is done in TripAdvisor. Fourthly, the scale of variables used by
Booking measures the perceived quality of service of hotels using the variables of location, staff,
comfort, cleanliness, facilities and service, and Wi-Fi, while the scale of variables used by TripAdvisor
to measure the quality of service of airlines is shown in Table 2. Fifthly, among the possible future
investigations raised in the above-mentioned research is that of carrying out positioning studies in
other service sectors, in order to verify whether online reputation is valid for carrying out positioning
studies. Finally, this research, due to its approach, the sector under study, the website used, the scale
of variables used, and the methodology to be followed in depth, represents a novel and significant
advance in this interesting line of research.

4. Analysis of Results
     The analysis of the results consists of three parts. In the first, a factorial analysis is carried out
to determine the dimensions of the scale of variables used by TripAdvisor to measure the online
reputation of airlines. A reliability analysis is also performed using Cronbach’s Alpha. In the second
part, multiple regression analysis is conducted, where the variable to be explained is the perceived
value and the independent variable is the perceived service quality scale. The aim is to determine
which of the seven variables on the service quality scale is most related to the perceived value. This
is a method for determining the predictive validity of the scale, given that perceived service quality
and perceived value are interrelated constructs [23,24]. Finally, the positioning analysis is undertaken,
always using the perceived value as a reference variable because it includes the price paid by customers.
Positioning analysis is carried out in two ways, by variable and by regression. The former is performed
with the variables that are related to the perceived value, whereas the latter is carried out by means of
Sustainability 2020, 12, 1184 9 of 27
a bivariate regression between the perceived value and the perceived service quality factor. All the
statistical analyses were carried out for all the airlines together and for each of the groups individually.
4.1. Factor Analysis
In order to verify the one-dimensionality and reliability of the TripAdvisor service quality scale,
Ye et al. [25] carried out a factorial analysis with the following equation:
Qf = α0 + α1 Cs + α2 Cb + α3 F + α4 Sl + α5 Sv + α6 Cl + α7 E + ε
The factorial analysis was carried out for all the airlines together and for each of the three defined
airline groups (Europe, United States-Canada, and other countries in the Americas) (see Table 3).
The Kaiser-Meyer-Olkin (KMO) test yielded results above 0.8, and all Bartlett’s tests were significant,
whereas the variance explained in all the analyses exceeded 70%. The variance explained for the other
countries in America was 76.53%, whereas all the companies as a whole reached 73.31%. Moreover,
Cronbach’s alpha scores were above 0.9 in all the analyses, confirming the reliability of TripAdvisor’s
perceived service quality scale. Table 3 also shows the results of the factor analysis where the airlines
are differentiated according to their strategy. It can be seen that the low-cost airlines only identify
one factor, which explains 79.21% of the variance with a Cronbach’s Alpha of 0.786. On the contrary,
in the rest of the airlines, two factors are obtained that explain 78.14% of the total variance. In the first
one, the variables of comfort of seats, food and drink, space for legs, and entertainment are assigned,
obtaining a 0.786 of reliability. For its part, the second factor integrates the key variables of check-in
and boarding, service, and cleanliness obtaining a Cronbach Alpha of 0.933.
The results show that the scale of variables used by TripAdvisor to measure the online reputation
of airlines is one-dimensional and reliable in the geographical area classification and in the low-cost
strategy. By contrast, airlines that do not follow a low-cost strategy obtain two factors whose variables
reach a high reliability indicator. This is an analysis that has to be carried out before the positioning
definition, in order to demonstrate that the data and variables to be used are reliable as well as to
determine the factorial structure of the scale of variables.
Table 3. Factor analysis.
All USA and Other Countries
Europe
Companies Canada of America
Variables 1 Factor 1 Factor 1 Factor 1 Factor
Comfort of seats 0.913 0.901 0.927 0.929
Check-in and Boarding 0.899 0.882 0.916 0.913
Food and drink 0.890 0.875 0.903 0.906
Space for legs 0.883 0.853 0.893 0.895
Service 0.869 0.851 0.862 0.888
Cleanliness 0.818 0.814 0.757 0.817
Entertainment 0.703 0.668 0.620 0.763
Factor analysis and reliability indicators
Variance explained 73.31% 70.23% 71.59% 76.53%
Cronbach’s Alpha 0.938 0.928 0.931 0.948
Kaiser–Meyer–Olkin Measure of Sampling
0.860 0.826 0.804 0.867
Adequacy.
Bartlett’s Test of Sphericity Approx. Chi-Square 1021.364 291.524 286.018 357.473
df 21 21 21 21
Sig. 0.000 0.000 0.000 0.000Sustainability 2020, 12, 1184 10 of 27
Table 3. Cont.
All USA and Other Countries
Europe
Companies Canada of America
Low-cost Non-low-cost
Variables 1 Factor 1 Factor 2 Factor
Comfort of seats 0.929 0.843
Check-in and boarding 0.922 0.933
Food and drink 0.859 0.806
Space for legs 0.906 0.846
Service 0.939 0.929
Cleanliness 0.905 0.879
Entertainment 0.756 0.755
Factor analysis and reliability indicators
Variance explained 79.21% 78.14%
Cronbach’s Alpha 0.948 0.786 0.920
Kaiser-Meyer-Olkin Measure of Sampling Adequacy. 0.888 0.709
Bartlett’s Test of Sphericity Approx. Chi-Square 635.677 310.659
df 21 21
Sig. 0.000 0.000
4.2. Multiple Regression Analysis
The results of the multiple regression analyses can be found in Table 4. The table shows that
the six regressions obtained very satisfactory results from a social science perspective because all the
adjusted R squares are above 0.60. This shows that there is a close relationship between the perceived
service quality and perceived value constructs. These results also confirm the predictive validity of
the quality of service scale used by TripAdvisor. However, the results show that a small number
of variables are significantly related to value. Therefore, there is a close relationship between the
perceived service quality and the perceived value, due to obtaining high adjusted R squares, with the
limitation that only a few variables (service, cleaning and check-in, and boarding) have a positive and
significant relationship.
Table 4. Multiple regression analysis.
Regression Analysis by Geographical Areas
Unstandardized Standardized
Coefficients Coefficients t Sig.
Model B Std. Error Beta
All airline companies, dependent variable: value (adjusted R square = 0.761)
(Constant) −0.031 0.197 −0.161 0.872
Space for legs 0.125 0.119 0.119 1050 0.295
Service 0.189 0.089 0.217 2113 0.036
Cleanliness 0.236 0.106 0.213 2224 0.027
Food and drink −0.005 0.052 −0.006 −0.099 0.921
Comfort of seats 0.156 0.148 0.133 1054 0.293
Check-in and boarding 0.327 0.103 0.331 3157 0.001
Entertainment −0.057 0.036 −0.088 −1548 0.123Sustainability 2020, 12, 1184 11 of 27
Table 4. Cont.
Airline companies of the United States and Canada, dependent variable: value
(adjusted R square = 0.788)
Unstandardized Standardized
coefficients coefficients t Sig.
Model B Std. error Beta
(Constant) −0.461 0.404 −1138 0.264
Space for legs 0.313 0.330 0.311 0.948 0.351
Service 0.168 0.196 0.176 0.855 0.399
Cleanliness 0.778 0.337 0.644 2308 0.028
Food and drink 0.037 0.079 0.053 0.467 0.643
Comfort of seats −0.190 0.440 −0.170 −0.431 0.669
Check-in and boarding −0.011 0.282 −0.011 −0.040 0.968
Entertainment −0.030 0.070 −0.041 −0.426 0.673
Airline companies of Europe, dependent variable: value (adjusted R square = 0.788)
(Constant) 0.139 0.398 0.349 0.728
Space for legs 0.226 0.182 0.240 1246 0.219
Service 0.383 0.165 0.421 2320 0.025
Cleanliness 0.110 0.165 0.105 0.663 0.510
Food and drink −0.072 0.142 −0.093 −0.510 0.612
Comfort of seats 0.298 0.237 0.262 1257 0.215
Check-in and boarding 0.067 0.208 0.061 0.323 0.748
Entertainment −0.074 0.068 −0.141 −11012 0.277
Airline companies of other countries of America, dependent variable: value
(adjusted R square = 0.800)
(Constant) 0.076 0.345 0.222 0.824
Space for legs 0.172 0.235 0.143 0.730 0.469
Service 0.203 0.156 0.239 1298 0.201
Cleanliness 0.074 0.176 0.067 0.423 0.674
Food and drink 0.007 0.107 0.008 0.070 0.944
Comfort of seats −0.060 0.263 −0.045 −0.230 0.818
Check-in and boarding 0.637 0.187 0.614 3404 0.001
Entertainment −0.099 0.090 −0.115 −1100 0.277
Regression analysis by low-cost or non-low-cost strategy
Low-cost airlines (adjusted R square = 0.832)
Unstandardized Standardized
coefficients coefficients t Sig.
Model B Std. error Beta
(Constant) 0.012 0.221 0.054 0.956
Space for legs 0.078 0.153 0.073 0.509 0.611
Service 0.398 0.113 0.451 3.519 0.001
Cleanliness 0.158 0.127 0.146 1.238 0.219
Food and drink −0.073 0.073 −0.090 −1.007 0.317
Comfort of seats 0.202 0.193 0.166 1.050 0.297
Check-in and boarding 0.273 0.127 0.271 2.152 0.034
Entertainment −0.067 0.054 −0.086 −1.243 0.218Sustainability 2020, 12, 1184 12 of 27
Table 4. Cont.
Non-low-cost airlines (adjusted R square = 0.662)
Unstandardized Standardized
coefficients coefficients t Sig.
Model B Std. error Beta
(Constant) −0.668 0.408 −1.636 0.107
Space for legs 0.214 0.183 0.185 1.167 0.248
Service 0.058 0.158 0.059 0.368 0.713
Cleanliness 0.232 0.179 0.185 1299 0.199
Food and drink 0.023 0.072 0.031 0.319 0.750
Comfort of seats 0.168 0.229 0.135 0.733 0.466
Check-in and boarding 0.475 0.174 0.460 2.729 0.008
Entertainment −0.035 0.053 −0.062 −0.658 0.513
With regard to the regression carried out with all the airlines together, the adjusted R square was
0.761. The variables that have a significant (p < 0.05) and positive relationship with the perceived value
are “service”, “cleanliness”, and “check-in and boarding”. The rest of the variables on the service
quality scale are not related to the perceived value. This shows that the measurement of value by
customers can be determined from the assessments made of the service received, the cleaning of the
aircraft, and the passenger check-in and boarding processes. Therefore, these three attributes are
critical for customers and have a relevant impact on the online reputation.
The group of European airlines achieved the lowest adjusted R square, with a value of 0.622.
Despite being the lowest result of all the regressions conducted, the value obtained is quite relevant
in social sciences. Therefore, it can be stated that the model explains the relationship between the
perceived service quality and the perceived value. Analyzing the level of significance of each variable
on the service quality scale in greater detail, Table 4 shows that “service” is the only significant variable
(p < 0.05). This result assumes that the value perceived by customers of European airlines is basically
related to the service received, whereas the other variables are not significantly related.
For USA and Canadian airlines, the adjusted R square is very high at 0.788. In this case, there is
also only one variable from the quality of service scale that has a significant and direct relationship
with the perceived value. This variable is cleanliness, which, with a level of significance of 0.03 and a
coefficient of 0.78, stands out as the main attribute that customers assess in perceived value.
Airlines from other American countries obtained the highest adjusted R square, with a value of
0.80. In this case, again, only one variable on the quality of service scale obtained a significant result.
Unlike the other two groups analyzed, it was “check-in and boarding”, which obtained a value of 0.637
with a significance level of 0.001. The results obtained in the multiple regressions carried out show
significant differences in the perceptions of airline users depending on the geographical areas in which
they operate. Whereas customers in Europe mainly value the service provided by the airlines, users in
the United States and Canada mainly consider the cleanliness of the aircraft, and customers in other
American countries evaluate the check-in and boarding processes to a greater extent.
On the other hand, the regression conducted for airlines with a low-cost strategy obtained an
adjusted R square of 0.832, being directly and positively related to the perceived value the service
(p < 0.01) and check-in and boarding (p < 0.05) variables. The rest of the airlines have obtained an
adjusted R square of 0.662, with check-in (p < 0.01) and boarding being the only variable that is directly
and significantly related to the perceived value. In this case, the predictive validity of the TripAdvisor
scale is also verified with the same limitation of the small number of significant variables. However,
these variables are validated to perform the positioning analysis.adjusted R square of 0.832, being directly and positively related to the perceived value the service (p
< 0.01) and check-in and boarding (p < 0.05) variables. The rest of the airlines have obtained an
adjusted R square of 0.662, with check-in (p < 0.01) and boarding being the only variable that is
directly and significantly related to the perceived value. In this case, the predictive validity of the
TripAdvisor scale is also verified with the same limitation of the small number of significant
Sustainability 2020, 12, 1184 13 of 27
variables. However, these variables are validated to perform the positioning analysis.
4.3. Positioning Analysis by Variables
The positioning
positioning analysis
analysiscarried
carriedout
outininthis
thisstudy
study is is
based
basedononthetheelaboration
elaborationof plots, where
of plots, the
where
airlines
the are are
airlines fixed according
fixed according to to
thethe
scores
scores obtained
obtained bybypairs
pairsofofvariables
variables[19].
[19]. The
The variable
variable that
that is
repeated in all the analyses is the perceived value, and so it is a key variable where service quality
[57,87–89]. There are four other variables used in positioning.
and price are related [57,87–89]. positioning. The first is the
average quality of service (Q), which, as previously specified in the methodology section, is obtained
by calculating the average of the seven variables used to measure the perceived service quality on
TripAdvisor. The other three variables were selected from the multiple regression analysis, where
TripAdvisor.
the variables that had a significant relationship with the perceived quality of service service were
were identified:
identified:
“service”, “cleanliness”,
“service”, “cleanliness”, andand “check-in
“check-inand andboarding”.
boarding”.
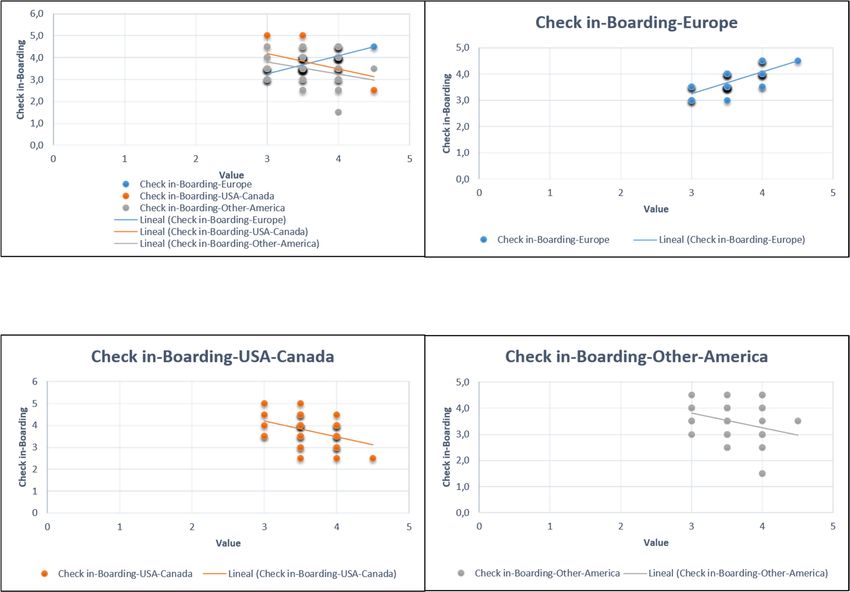
Figure 22 depicts
Figure depictsthethefour
fouranalyses
analysesconducted
conducted with
with regard
regard to the
to the average
average quality
quality of service
of service (Q)
(Q) and
andperceived
the the perceived value.
value. The The
firstfirst includes
includes all airlines.
all airlines. In the
In the remaining
remaining three,
three, each
each of the
of the three
three groups
groups of
of airlines
airlines is analyzed
is analyzed individually.
individually. Thegraph
The first first graph
shows shows thatis there
that there a highisconcentration
a high concentration
of customerof
customer
ratings ratings
with with
respect to respect to value.
value. Thus, the Thus,
minimum the minimum
rating is 3,rating is 3, the
whereas whereas
maximumthe maximum
value givenvalue
by
given by customers
customers is 4.5. On is
the4.5. On hand,
other the other
the hand,
onlinethe online reputation
reputation of the averageof the average
quality quality(Q)
of service of service
shows
(Q) shows differences
significant significant differences
because some because some obtain
companies companies obtain
a rating a rating
of less than 2,ofwhereas
less thansome
2, whereas
almost
some almost
reach reach the
the maximum maximum
value of 5. value of 5.
Figure 2. Positioning
Figure 2. Positioning of
of airlines
airlines as
as aa function
function of
of the
the value
value and service quality
and service quality average
average (Q).
(Q).
An analysis of the positioning by group of airlines by geographical areas shows that European
airlines show less dispersion in the average quality of service (Q). The minimum value is around
3, whereas the highest value is 4.5. An increasing function is also observed; that is, the higher the
perceived quality of service, the higher the value perceived by the customer. These data are of great
interest because the perceived value tends to decrease as quality is offered [19].
In many cases, when companies increase their quality of service, they tend to increase the price.
With this strategy, customers can decrease their perceived value because they can consider that the
price increase is higher than the increase in the quality of the service offered [35,90]. In this case,Sustainability 2020, 12, 1184 14 of 27
the clients positively evaluate the increase in the quality of service in relation to what it costs them.
This result demonstrates a high competitive capacity of European airlines, insofar as they transmit to
their customers the benefits they receive for a reasonable price.
In the USA and Canada group, the results are more disperse because some airlines have an online
reputation of 2.5, compared to others that almost reach the maximum score of 5. This is a typical
strategy of low-cost airlines, which significantly lower the price by reducing services. As Figure 2
shows, there are many customers in these areas who value this low-price strategy positively.
A similar situation is seen in airlines from other American countries, although the dispersion in
the average quality of service (Q) is somewhat greater. There is also evidence of customer recognition
for lowering prices by reducing the quality of service offered. This strategy leads customers to give a
higher score to the perceived value than to the average perceived quality of service (Q). According to
Rodríguez-Díaz et al. [19], this type of strategy normally obtains a positive added value.
The other three variables included in the positioning analysis showed a significant relationship
with the perceived value. Figure 3 depicts the results of the “service” variable, which were significant
for European airlines. These results confirm that European customers value the quality of the service
offered positively, insofar as the function that explains the relationship between this variable and the
perceived value is growing. This is not the case in the other two groups. In the USA and Canada
markets, “cleanliness” is a differentiating element that shows a moderately decreasing function.
Sustainability 2020, 12, 1184 14 of 27
Figure
Figure 3.
3. Positioning
Positioning of
of airlines
airlines as
as aa function
function of
of the
the value
value and
and service
service (geographical
(geographical areas).
areas).
Figure 4 shows that the function begins at a value close to 4.5 and ends at a value close to 3.5,
whereas in the group of other American countries, it begins at 4 and ends at 3.5. With regard to
“check-in and boarding”, Figure 5 shows that in Europe the trend continues to increase, whereas in the
other two groups it is decreasing. Even though the slopes of the airlines from the USA and Canada and
the other countries in America are similar, there is greater dispersion in the average in the latter group.
This shows that a significant number of airlines have serious problems with this strategic aspect of
service quality, obtaining a share of airline values equal to or less than 3.Sustainability 2020, 12, 1184 15 of 27
Figure 3. Positioning of airlines as a function of the value and service (geographical areas).
Figure
2020,4.
Figure
Sustainability Positioning
Positioning
4.12, 1184 of
of airlines
airlines as
as aa function
function of
of the
the value
value and
and cleanliness
cleanliness (geographical
(geographical areas).
areas). 15 of 27
Figure
Figure 5.
5.Positioning
Positioningofof
airlines as as
airlines a function of the
a function value
of the and and
value check-in and boarding
check-in (geographical
and boarding areas).
(geographical
areas).
Figure 6 shows the positioning analysis according to the airlines’ strategy. With respect to the
check-in and boarding variables, it can be seen that there are no significant differences between the
low-cost airlines and the rest. Moreover, both groups follow an increasing function, whereas the low-
cost airlines obtain the lowest values to a greater extent. Regarding service, this has only been
performed for low-cost airlines because this variable is significant only in this group. Figure 6 shows
that the function obtained is increasing. It starts with airlines that do not reach a score of 2 either in
service or in perceived value, and reaches its maximum values with airlines that obtain scores up toSustainability 2020, 12, 1184 16 of 27
Figure 6 shows the positioning analysis according to the airlines’ strategy. With respect to the
check-in and boarding variables, it can be seen that there are no significant differences between the
low-cost airlines and the rest. Moreover, both groups follow an increasing function, whereas the
low-cost airlines obtain the lowest values to a greater extent. Regarding service, this has only been
performed for low-cost airlines because this variable is significant only in this group. Figure 6 shows
that the function obtained is increasing. It starts with airlines that do not reach a score of 2 either in
service or in perceived value, and reaches its maximum values with airlines that obtain scores up to 4.5
in service and value.
Sustainability 2020, 12, 1184 16 of 27
Figure
Figure 6.
6. Positioning
Positioningofofairlines as as
airlines a function of the
a function value
of the and and
value check-in and boarding
check-in or service
and boarding (low-
or service
cost or non-low-cost
(low-cost strategy).
or non-low-cost strategy).
Positioning by Regression Analysis
4.4. Positioning
The positioning analysis is obtained through a bivariate regression between the perceived value
and the
theperceived
perceivedservice
servicequality
qualityfactor. This This
factor. method has the
method advantage
has that it isthat
the advantage possible
it istopossible
determine
to
the type of function that best defines the relationship between the dimensions
determine the type of function that best defines the relationship between the dimensions analyzed. analyzed. This has
stronghas
This practical
strongimplications because each company
practical implications because caneachdetermine
companyitscan competitive
determine positioning from its
its competitive
own evaluations
positioning fromofitsitsown
online reputationof
evaluations as its
well as that
online of its competitors.
reputation as well asHowever,
that of there has to be a
its competitors.
significantthere
However, relationship
has to bebetween the dimensions
a significant relationship analyzed
between inthe
order for the results
dimensions analyzedto beinreliable.
order for the
Therefore,
results bivariate regressions were carried out in order to analyze the type of function that best
to be reliable.
matches the relationship
Therefore, bivariate between
regressionsperceived serviceout
were carried quality and perceived
in order to analyzevalue.
the typeIn order to perform
of function that
this statistical
best matches the analysis, the perceived
relationship betweenvalue was used
perceived as the
service variable
quality and to be explained,
perceived value.whereas
In orderthe
to
dependent
perform thisvariable was
statistical the factorial
analysis, load saved
the perceived in the
value wasfactorial analysis.
used as the Table
variable to be5 presents
explained, the results
whereas
obtained
the for airlines
dependent grouped
variable was the by factorial
geographical
load areas,
saved highlighting
in the factorialthe analysis.
adjusted Table
R square of 0.700 the
5 presents for
linear, quadratic,
results obtained for andairlines
cubic regressions,
grouped bywhereas the inverse
geographical areas, function,
highlightingwiththe
an adjusted
adjusted R R square of
0.002, for
0.700 does not explain
linear, the relationship
quadratic, between the
and cubic regressions, dimensions
whereas studied.function, with an adjusted R
the inverse
square of 0.002, does not explain the relationship between the dimensions studied.
Analyzing the results according to the groups of airlines, it can be seen that European airlines
obtain the lowest adjusted R square, 0.578 for the linear, quadratic, and cubic functions, whereas the
inverse is not a model that can be applied. The airlines from the USA and Canada increase their
adjusted R square to 0.754 in the linear function, 0.761 in the quadratic function, and 0.762 in the cubic
function. The result for the inverse function was 0.000; that is, it is not a useful model for determining
the relationship between the variables studied.Sustainability 2020, 12, 1184 17 of 27
Table 5. Positioning by regressions with value as dependent variable and service quality factor as
independent variable (geographical areas).
Model Summary Parameter Estimates
Equation
R Square F df1 df2 Sig. Constant b1 b2 b3
All airline companies
Linear 0.694 312.382 1 138 0.000 3.546 0.441
Inverse 0.002 0.303 1 138 0.583 3.549 0.002
Quadratic 0.700 159.612 2 137 0.000 3.571 0.426 −0.025
Cubic 0.700 105.770 3 136 0.000 3.575 0.435 −0.030 −0.003
Airline companies from Europe
Linear 0.578 65.652 1 48 0.000 3.485 0.401
Inverse 0.015 0.718 1 48 0.401 3.581 0.005
Quadratic 0.578 32.217 2 47 0.000 3.478 0.394 0.016
Cubic 0.578 21.022 3 46 0.000 3.477 0.397 0.019 −0.003
Airline companies from the United States and Canada
Linear 0.754 104.444 1 34 0.000 3.586 0.472
Inverse 0.000 0.000 1 34 0.994 3.597 −8.956E-05
Quadratic 0.761 52.491 2 33 0.000 3.631 0.473 −0.036
Cubic 0.762 34.201 3 32 0.000 3.621 0.508 −0.028 −0.013
Airline companies from other countries in America
Linear 0.728 120.708 1 45 0.000 3.626 0.484
Inverse 0.000 0.016 1 45 0.900 3.460 0.001
Quadratic 0.737 61.668 2 44 0.000 3.646 0.433 −0.030
Cubic 0.741 41.068 3 43 0.000 3.677 0.456 −0.076 −0.015
Analyzing the results according to the groups of airlines, it can be seen that European airlines
obtain the lowest adjusted R square, 0.578 for the linear, quadratic, and cubic functions, whereas the
inverse is not a model that can be applied. The airlines from the USA and Canada increase their
adjusted R square to 0.754 in the linear function, 0.761 in the quadratic function, and 0.762 in the cubic
function. The result for the inverse function was 0.000; that is, it is not a useful model for determining
the relationship between the variables studied.
Finally, the airlines from the rest of the American countries also achieve very high results.
The adjusted R square for the linear function was 0.728, 0.737 for the quadratic function, and 0.741 for
the cubic function. The inverse function again shows no significant relationships between the variables.
As can be observed in the previous regressions, any of the three functions can be used to determine
the relationship between the perceived quality of the service and the perceived value because they all
have similar results. This can be verified in Figure 7, where the analyzed functions are graphically
displayed, verifying that they practically form a straight line.You can also read