Annex 1. Case Studies - International Monetary ...
←
→
Page content transcription
If your browser does not render page correctly, please read the page content below
Annex 1. Case Studies

Costa Rica: Tourism in the Post-COVID‑19 Normal
           Background

           Since the late 1980s, Costa Rica has established itself as a prime destination
           for green and sustainable tourism. Many tourists are drawn to Costa Rica’s
           varied national parks and protected areas—which cover about 25 percent
           of the national landmass—and provide opportunities for a wide range of
           activities, including beach holidays, ecotourism, and adventure trips (Annex
           Figure 1.1). In 2019 the country attracted more than 3 million interna-
           tional visitors, mainly from North America (53.1 percent), Central America
           (22.3 percent), and Europe (15.9 percent). While leisure accounts for the
           largest share of tourism revenues (66 percent), tourism for health (13.4 per-
           cent), business (12.7 percent), and education purposes (7.7 percent) also play
           an important role, according to 2016 survey data.

           Tourism contributes significantly to employment and economic activity. The
           tourism sector is a leading source of jobs and—directly and indirectly—
           supported an estimated 12.9 percent of total employment in Costa Rica
           in 2019. Informal employment in the tourism sector has been increasing,
           accounting for 59 percent of all jobs in 2019 (compared to about 46 percent
           in other sectors of the economy). More than half of the sector’s employees
           are women. Tourism’s direct and indirect contribution to GDP has increased
           over the past decade, from 12.1 percent of GDP in 2010 to an estimated
           13.2 percent in 2019 (Annex Figure 1.1). It is also a large component of
           trade, accounting for about 20 percent of the country’s exports.

                                        45

           ©International Monetary Fund. Not for Redistribution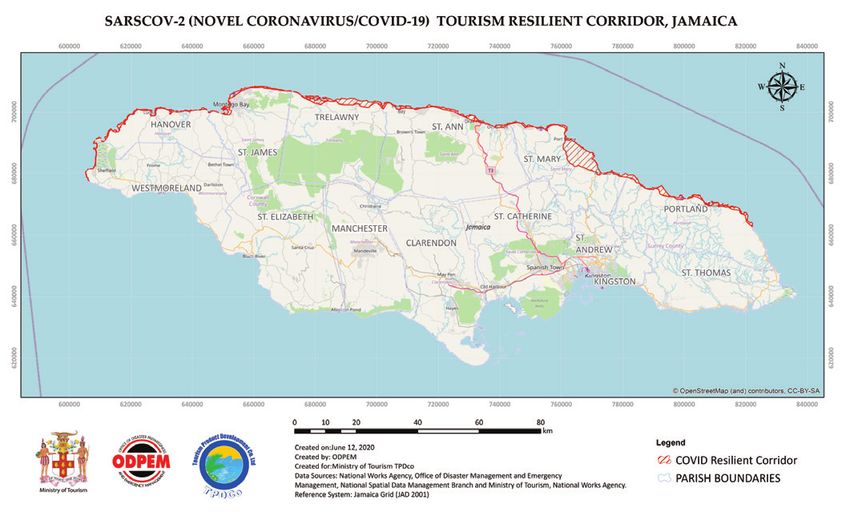
Tourism in the Post-Pandemic World

Annex Figure 1.1. Costa Rica: Type of Tourism and Contribution to Economic Activity

1. Activities during Touristic Stays                                                2. Contribution of Tourism
   (Percent of visitors, 2017–19)                                                      (Percent)
80                                                                                                                                                             14
                                                                                                Contribution to GDP          Contribution to employment

70
                                                                                                                                                               13
60

50
                                                                                                                                                               12

40

                                                                                                                                                               11
30

20
                                                                                                                                                               10
10

0                                                                                                                                                              9
      Beach      Ecotourism Adventure       Culture    Wellness      Sports           2010     11      12     13      14     15         16   17   18      19

Sources: Banco Central de Costa Rica; Instituto Costarricense del Turismo; World Travel and Tourism Council; and IMF staff estimates.

                                 The Impact of COVID‑19 on the Tourism Sector

                                 The COVID‑19 pandemic and necessary containment measures have caused
                                 an unprecedented decline in tourism activity. International tourist arrivals
                                 dropped by 98.7 percent year over year in the third quarter of 2020. As a
                                 result, direct employment in the tourism sector declined by 28.0 percent year
                                 over year (up from a decline of 51.6 percent year over year in the second
                                 quarter 2020), driven by restaurants and hotels, which generate the largest
                                 share of jobs in the sector (Annex Figure 1.2). Overall, economic activ-
                                 ity in the tourism sector is estimated to decline by 40 percent in nominal
                                 terms in 2020.

                                 Costa Rica has begun to open its borders to international visitors, but restric-
                                 tions remain in place. Following the closure of its borders in March 2020 to
                                 contain the spread of the virus, Costa Rica has since August 2020 gradually
                                 relaxed entry restrictions for foreign visitors. As of November 2020, tourists
                                 from 44 countries, including from the United States, have been authorized
                                 to visit. While entry requirements—such as health insurance coverage from
                                 local or international providers—as well as domestic containment measures
                                 remain in place, quarantine restrictions have been removed to support the
                                 tourism sector.

                                                                                46

                                 ©International Monetary Fund. Not for Redistribution
Annex 1. Case Studies
Annex Figure 1.2. Costa Rica: Impact of the Pandemic on the Tourism Sector
1. International Tourist and Flight Arrivals 2. Employment in Tourism
(Number of jobs)
400,000 5,000 240,000
Tourist arrivals Flight arrivals (right scale) Restaurants Accommodation
4,500 Sports and recreation Cultural activities 220,000
350,000 Transport Travel agencies 200,000
4,000 Car rentals
300,000 180,000
3,500
160,000
250,000
3,000 140,000
200,000 2,500 120,000
2,000 100,000
150,000
80,000
1,500
100,000 60,000
1,000
40,000
50,000
500 20,000
0 0 0
Feb. 2019 July 19 Dec. 19 May 20 Oct. 20 2019:Q4 20:Q1 20:Q2 20:Q3
Sources: Banco Central de Costa Rica; FlightRadar24; Instituto Costarricense del Turismo; and IMF staff estimates.
Policy Responses to Support the Tourism Sector
Costa Rica’s tourism sector is well‑positioned to accommodate new travel
habits and protocols. Considerable natural attractions and accommodation
in resort destinations—rather than urban centers—provide an opportunity to
attract visitors with preferences for outdoor activities and social distancing.
Costa Rica’s growing high-end ecotourism and wellness niche can benefit
from post‑COVID‑19 travel habits favoring outdoor activities and increas-
ing demand for sustainable travel. In this context, the country has been able
to create crucial synergies between its efforts to preserve forests to promote
climate change mitigation and adaptation and the ecotourism sector. Another
factor that might draw tourists to Costa Rica, compared to other destinations
in the tropics, is its high-quality healthcare system, which can cater to visitors
in need of medical assistance and thereby partly mitigate health concerns
during the pandemic.
Costa Rica has launched a roadmap to reactivate the sector and adjust to
the new normal. The roadmap contains several initiatives to restore travelers’
confidence and attract visitors:
• The Costa Rican Tourism Institute (ICT), in collaboration with the private
sector, has launched 16 health and hygiene protocols for tourism-related
activities. Adopting these protocols allowed Costa Rica to earn the World
47
©International Monetary Fund. Not for RedistributionTourism in the Post-Pandemic World
Travel and Tourism Council’s Safe Travels Seal in July. The ICT has also
provided tourists with good practice guides and a mobile app to share rele-
vant information and enhance contact tracing on a voluntary basis.
• To initiate the reactivation of the sector, the ICT launched national and
international campaigns. The national campaign Vamos a Turistear (let’s
go sightseeing) aims at incentivizing domestic tourism through attractive
offers, discounts, and financing options until the end of December 2020.
In July 2020, Congress also approved a law that moved several national
holidays to Mondays to extend weekends during 2020–24, thereby boost-
ing domestic tourism. To promote international tourism, Costa Rica
launched its campaigns Only the Essentials in the United States and Can-
ada, and in Costa Rica Un Sanctuaire de Vie (a sanctuary of life) in France,
embodying the country’s pura vida or “full of life” mindset.
• Other measures concentrate on improving the tourism experience, for
example, through offering services for small groups with a mandatory
local guide and a focus on sustainable tourism. In addition, the road-
map reinforces efforts to attract foreign direct investment in the tourism
sector, transform the Guanacaste area into a tourism hub, and promote
maritime tourism.
Jamaica: Tourism in the Post-COVID‑19 Normal
Background
Jamaica’s successful “all-inclusive” “sun, sand, and sea” tourism model has
flourished, especially among North American tourists (Annex Figure 1.3).
Nearly 80 percent of foreign nationals visiting Jamaica are leisure and holi-
day travelers, predominantly from three English-speaking countries (Canada,
United Kingdom, United States). About one-third of Jamaica’s tourists are
older than 50, with relatively higher levels of disposable income. Jamaica has
thus excelled in the all-inclusive tourism model, with all-inclusive hotels rep-
resenting 60 percent of the total accommodation infrastructure. Stopover vis-
itors and the average per-person daily expenditure have grown by an annual
average of 3.9 percent and 3 percent, respectively, over the last 20 years,
in spite of Jamaica’s relatively low-price competitiveness based on the 2019
Travel and Tourism Competitiveness Index (T&TCI).
Tourism, a critical driver of the Jamaican economy, has long benefited from
active prioritization by the government. According to the World Tourism
and Travel Council, tourism and travel together represented 31 percent of
GDP in 2019. Net tourism receipts account for 56 percent to total exports
and are a critical source of foreign exchange. The share of employment in
sectors with direct or indirect interlinkages to tourism is more than 30 per-
48
©International Monetary Fund. Not for RedistributionAnnex 1. Case Studies
Annex Figure 1.3. Jamaica: Tourism Model and Tourist Flows
1. Total Stopover Arrivals by 2. Room Inventory by Type of 3. Number of Visitors and Average
Country of Residence Accommodation Daily Expenditure per Person
(Percent, 2019) (Percent, 2018) (Growth rates, percent)
80 70 18
No. of visitors, (stop-overs,
non-nationals)
70 60 Average daily expenditure
per person, (stop-overs, 13
60 non-nationals)
50
50
8
40
40
30
3
30
20
20
–2
10 10
0 0 –7
US
Canada
UK
Europe
Caribbean
Other
Hotels
(All-inclusive)
Hotels
(Non-all inclusive)
Guest houses
Resort villas
Apartments
2001
02
03
04
05
06
07
08
09
10
11
12
13
14
15
16
17
18
19
Sources: Jamaica Tourist Board; and IMF staff calculations.
Annex Figure 1.4. Jamaica—Average Share of Employment
cent (Annex Figure 1.4). by Sector, 2012–20
Tourism and entertainment (Percent of total labor force)
sectors constitute 7 percent
of the commercial banks’
loans portfolio. The 2019
T&TCI ranks Jamaica Hotels and
Other, 42.1 restaurants, 8.4
second globally in terms of
the government’s prioriti- Transport, 3.0
Sectors with
zation of the sector in its direct and
indirect linkages
policy matrix. Key initia- to tourism, 30.0 Agriculture, 15.5
tives include the worldwide
marketing campaign by Construction,
8.6
the Jamaica Tourist Board, Manufacturing, 3.1
Wholesale and
the tourism sector plan retail, 19.4
included in the Vision 2030
National Development
Sources: Statistical Institute of Jamaica; and IMF staff calculations.
Plan, a national strategy to Note: Labor data are only available until January 2020; Figures for transport and
stimulate community-based manufacturing estimate the direct linkages between those sectors and tourism.
49
©International Monetary Fund. Not for RedistributionTourism in the Post-Pandemic World
tourism, the establishment of tourism linkages network, and the lower VAT
rate relative to other sectors.
The Impact of COVID‑19 on the Tourism Sector
The COVID‑19 pandemic has significantly impacted Jamaica’s tourism
sector. A near-total shutdown of the sector between April and June 2020,
largely associated with the halt in North American travel, led to a 66 percent
decline in tourist arrivals as of the end of October 2020. As a result, the real
value added of the hotels and restaurants sector declined by 14 percent in the
first quarter of 2020, by 86 percent in the second quarter of 2020, and by
65.2 percent in the third quarter of 2020. The output of the recreational
activities sector has also significantly contracted due to the drop in foreign
tourist arrivals, while the transport sector has been impacted by the sharp
reduction in air flights and absence of cruise passenger arrivals. The closure of
hotels has negatively affected the agricultural sector, especially sales of coffee
and cocoa, as well as food processing, manufacturing, and air transport.
Policy Responses to Support the Tourism Sector
The Jamaica authorities’ COVID‑19 response has aimed at limiting the eco-
nomic fallout and ensuring that Jamaica remains a safe tourism destination:
• The Government of Jamaica reopened its borders to all international
travelers on June 15, 2020. COVID‑19 travel protocols, that include
prior-to-departure travel authorization for international visitors, fol-
lowed by the risk-based quarantines and movement limitations, received
the World Travel and Tourism Council (WTTC) Safe Travels stamp of
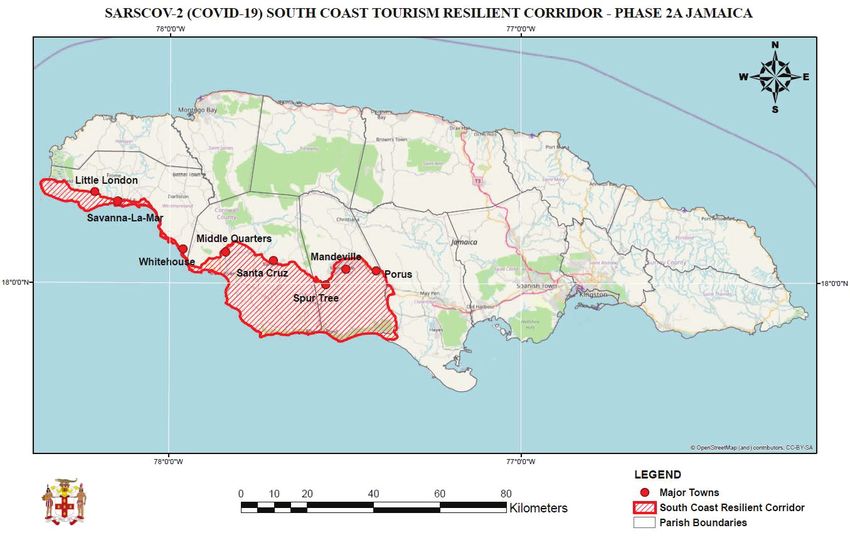
approval. The authorities have established two Resilient Corridors—
special zones in which tourism operators have been trained and certified
for adherence to COVID−19 protocols—where all tourists assessed as
low risk are required to stay. The two Resilient Corridors cover the most
popular tourism destinations within Jamaica on the north and south coasts
Motivated by the successful implementation of COVID‑19 protocols by
the tourism sector, the Jamaica Hotel and Tourism Association launched
training for local communities, to help prevent the spread of the virus.
Despite the travel restrictions, Jamaica staged virtually its premier tourism
industry marketplace, JAPEX, attracting a record number of participants.
The Jamaican authorities leveraged the lower tourism arrival numbers to
increase skills and qualifications of 10,000 tourism workers, via free online
training certification classes. In November 2020, the authorities also intro-
duced a first-of-its-kind traveler protection and emergency service program,
50
©International Monetary Fund. Not for RedistributionAnnex 1. Case Studies
Annex Figure 1.5. Jamaica—Resilient Corridors
1. SARSCOV-2 (Novel Coronavirus/COVID-19) Tourism Resilient Corridor, 2. SARSCOV-2 (COVID-19) South Coast Tourism Resilient Corridor—
Jamaica Phase 2A Jamaica
COVID resilient corridor Parish boundaries Major towns South coast resilient corridor Parish boundaries
700,000
680,000
660,000
18°0'0"N
640,000
620,000
620,000 660,000 700,000 740,000 780,000 820,000 78°0'0"W 77°0'0"W
0 10 20 40 60 80 km 0 10 20 40 60 80 km
Source: Jamaica Tourism Board: https://www.visitjamaica.com/travelauthorization/resilient-corridors.
Jamaica Cases, that includes field rescue and repatriation for medical emer-
gencies, including COVID‑19 and natural disasters.
• The Jamaican authorities also implemented policies to avoid bankruptcies
and sustain jobs in the tourism sector. These include programs to help
retain tourism workers through temporary cash transfers and safety nets for
lower earning dismissed workers as well as grants for smaller tourism oper-
ators and informal businesses supporting the sector. In parallel, the Jamaica
Tourist Board’s Rediscover Jamaica campaign is encouraging discounted
domestic travel, although, according to the WTTC, domestic spend-
ing contributed to only 21 percent of total tourism and travel spending
in 2019. In addition, commercial banks have provided temporary morato-
ria on loan repayments to tourism operators.
The recovery of the Jamaica’s tourism sector could be complicated by a shift
in preferences, and key pre-existing factors. The older-age profile of Jamai-
ca’s tourists could result in a slower recovery in arrivals as travelers rebuild
confidence only gradually in international travel. The concentration of room
capacity in large hotels, the high crime and weak infrastructure outside the
resorts, and low‑price competitiveness may reduce Jamaica’s attractiveness
to North American travelers who will be demanding more competitive and
social-distancing friendly destinations.
The post-COVID‑19 new normal in tourism presents opportunities to
increase resilience and boost inclusive economic growth. According to the
Compete Caribbean‑Caribbean Tourism Organization, 79 percent of US
tourists are interested in community-based tourism (CBT). The Jamaican
51
©International Monetary Fund. Not for RedistributionTourism in the Post-Pandemic World
authorities announced a plan to encourage the development of CBT with
a special focus on rural communities, including the establishment of a spe-
cial Community Tourism Unit within the Ministry of Tourism. Developing
Jamaica’s CBT—as envisioned in the authorities’ 2015 National Community
Tourism Policy and Strategy—would usefully complement Jamaica’s domi-
nant beach tourism and increase the resilience of the sector by allowing the
health- and wellness-minded tourist to leverage Jamaica’s rich and unique
culture and varied geographical features. Moreover, CBT would also allow
for greater community participation, generating new employment oppor-
tunities across a broader segment of the population. However, this will
require addressing structural challenges, including the high level of crime and
poor road and water infrastructure, to make remote communities accessi-
ble to tourists.
Fiji and Vanuatu: Tourism in the Post-COVID‑19 Normal
Background
Fiji and Vanuatu are two Pacific island countries heavily dependent on tour-
ism. In 2019, Fiji and Vanuatu received about 900,000 and 120,000 visitors
by air, respectively, with tourism contributing to more than a third of GDP
and employment in both countries (Annex Figure 1.6). About 70 percent of
visitors to both countries come from Australia and New Zealand, predom-
inantly for leisure. While Fiji offers mid-range to luxury tourism, Vanuatu
relies more on mass tourism at the mid-range:
• Fiji consists of 333 islands, with tourism concentrated on the largest two,
Viti Levu and Vanua Levu. Fiji is known for its beautiful beaches, friendly
people, and year-round warm climate. Attractions include lagoons, coral
coasts and ancient archeological sites.
• Vanuatu consists of 83 islands, with tourism concentrated on Efate with
the capital Port Vila, along with unique islands such as Tanna (volcano),
Espiritu Santo (wreck diving), Pentecost (cultural experience), and Aneitym
(cruise ships).
Both countries are highly vulnerable to shocks impacting tourism, including
natural disasters. For example, tourism arrivals in Fiji fell during 2012–13
due to Tropical Cyclone (TC) Evan and tourism plunged in Vanuatu in 2015
due to TC Pam. Most recently, Fiji and Vanuatu were hit by TC Har-
old in April 2020.
52
©International Monetary Fund. Not for RedistributionAnnex 1. Case Studies
Annex Figure 1.6. Tourism Contribution to the Economy
1. Contribution of Tourism and Number of Arrivals—Fiji 2. Contribution of Tourism and Number of Arrivals—Vanuatu
(Percent - left scale; thousands - right scale) (Percent - left scale; thousands - right scale)
42 900 60 120
Contribution Contribution to Number of arrivals Contribution Contribution to Number of arrivals
to GDP employment (right scale) to GDP employment (right scale)
115
40 850 50
110
38 800 40
105
36 750 30 100
95
34 700 20
90
32 650 10
85
30 600 0 80
2010 11 12 13 14 15 16 17 18 2010 11 12 13 14 15 16 17 18
Source: UN World Tourism Organization, Yearbook of Tourism Statistics.
The Impact of COVID‑19 on the Tourism Sector
In response to the COVID‑19 pandemic, both countries enacted strict
border controls in late March and remain closed to most international travel.
These stringent measures have enabled both countries to keep COVID‑19
at bay, with only 38 confirmed cases recorded in Fiji and one in Vanuatu
as of November 2020. Nonetheless, the suspension of commercial air travel
has decimated the tourism sector (Annex Figure 1.7). Since April 2020, Fiji’s
tourism revenue has been minimal. Vanuatu has received no revenue from
foreign visitors, with 70 percent of employees in its tourism sector estimated
to have lost their jobs by May 2020. Real GDP is estimated to have con-
tracted by 19 percent (Fiji) and 9.2 percent (Vanuatu) in 2020.
Cruise ships are a significant source of revenue for both countries. In 2018,
Fiji received 188,000 cruise arrivals while Vanuatu had 235,000 cruise arriv-
als, with average passenger spending estimated at US$44 and US$85, respec-
tively. With the COVID‑19 pandemic and border closures, there have been
no cruise ship landings since March. The recovery of the cruise industry is
likely to be protracted, clouding Vanuatu’s and Fiji’s prospects for a recovery
in tourism as well, especially for small private businesses that cater to visitors
from cruise ships.
53
©International Monetary Fund. Not for RedistributionTourism in the Post-Pandemic World
Annex Figure 1.7. Visitor Arrivals Policy Responses to Support the
(12-month percent change)
Tourism Sector
60
Both governments have imple-
Fiji Vanuatu
40 mented bold fiscal stimulus mea-
sures to support their tourism
20
industries and position them for an
0 eventual recovery. Fiji’s fiscal support
includes tax cuts, transfer payments,
–20
and a subsidy to Fiji Airways to
–40 incentivize the first 150,000 tour-
ists in the new fiscal year. Vanu-
–60 atu’s package included reimbursing
–80
registered employers 30,000 vatu per
employee (US$266) for four months
–100 to help retain their workforce,
–120
along with some business tax relief
and SME grants, with the tourism
June 2019
July 19
Aug. 19
Sep. 19
Oct. 19
Nov. 19
Dec. 19
Jan. 20
Feb. 20
Mar. 20
Apr. 20
May 20
June 20
July 20
Aug. 20
Sep. 20
industry being a prime target of all
the measures. Both countries have
also drawn on their national pension
Sources: Country authorities; and IMF staff estimates.
funds to support affected house-
holds in all sectors of the economy,
but at the cost of reducing future
retirement income. The Fiji National Provident Fund (NPF) paid out an
estimated US$24 million (0.5 percent of GDP) to its members by early July
while the Vanuatu NPF paid out US$12.5 million (1.5 percent of GDP).
However, with the borders still largely closed and fiscal space limited, it is
increasingly challenging for businesses to survive and for workers to support
their families.
Both Fiji and Vanuatu are eager to join travel bubbles, but none have yet
materialized. Initially, when Australia and New Zealand were discussing a
potential Trans-Tasman travel bubble, Fiji and Vanuatu expressed interest
to join. Fiji tried launching its own Bula bubble and Vanuatu proposed a
Tamtam bubble that would allow for entry of tourists from some countries
with limited restrictions. However, with local outbreaks in key source coun-
tries, Australia and New Zealand have delayed the prospects for a functioning
international travel bubble. In August 2020, Fiji launched a Blue Lanes ini-
tiative that allows yachts to berth in its marinas after meeting strict quaran-
tine and testing requirements. Fiji has received more than 90 yachts through
this initiative.
54
©International Monetary Fund. Not for RedistributionAnnex 1. Case Studies
Fiji and Vanuatu Annex Figure 1.8. Thailand: Tourist Arrivals by Country
(Millions of persons)
are well positioned
to cater to new 40
China
tourism demands, East Asia excl. China
with some forms Europe
of tourism having Americas
30 South Asia
more potential than Oceania
others. Having Middle East
Africa
successfully kept the
virus in check, both 20
countries could
benefit from the
diversion of visitors
10
that would other-
wise travel to other
destinations, such
as the United States 0
1997 99 2001 03 05 07 09 11 13 15 17 19
or the ASEAN
region. Moreover, Sources: Haver Analytics; and Ministry of Tourism and Sports.
many tourists
from key sources
countries would
prefer to remain within their region in the near term due to accessibility and
familiarity. Both Vanuatu and Fiji have direct flights to Australia and New
Zealand, mostly within four hours. Bubbles could be set up to enable tour-
ism without significant risk of outbreaks in the islands. Over the medium
term, island nations such as Fiji and Vanuatu may be better placed than
others in offering socially distanced vacations. For example, Vanuatu offers
an off-the-beaten-path experience with low-density tourism where families
can find it easier to isolate in nature. It also has the potential to expand on
ecotourism to attract more visitors.
Potential challenges to a recovery of tourism in Fiji and Vanuatu relate to
their remoteness and relatively weak health infrastructure. Both countries
have their own national airlines, which have been hard hit by the COVID‑19
crisis. This may also be true of international air carriers from Australia and
New Zealand and international cruise lines. Even if tourists are ready to
return, there may be limited access, given the severe disruption to airline and
cruise operations. Another potential challenge is that health considerations
may gain in importance for potential visitors in the wake of the pandemic. In
the Global Health Security Index, Fiji and Vanuatu rank in bottom quartile,
which could hold back some visitors in the future.
55
©International Monetary Fund. Not for RedistributionTourism in the Post-Pandemic World
Thailand: Tourism in the Post-COVID‑19 Normal
Background
Tourism has grown to play a pivotal role in Thailand’s externally oriented
economy. Thailand is a leading global tourist destination, ranking ninth for
tourist arrivals and fourth for tourism receipts in 2018 (UNWTO 2019).
At the end of 2019, tourism comprised 12 percent of Thailand’s GDP, and
nearly a fifth of the economy, once accounting for related services. Supported
by investment in accommodation and transportation infrastructure, Bangkok
is now one of the world’s most visited cities, and a gateway point tourist hub
in Thailand, including tropical beaches (such as Phuket, Samui, and Pattaya)
as well as cultural heritage sites.
The tourism industry employees are about 15 percent of Thailand’s total
employment, though the number is likely larger once accounting for sea-
sonal and informal workers. In addition, it is estimated that nearly a fifth of
workers in the tourist industry are rural domestic migrants who return to
farms once the tourist season is over. As real wages have risen in Thailand,
the tourism industry has also increasingly employed migrant workers from
neighboring countries (Cambodia, Lao PDR, Myanmar, Vietnam), estimated
at 5 percent of total workers, though given the high degree of informality
suggests this number may be larger. Women comprise 65 percent of employ-
ment in the accommodation and food services sector, earning about 80 per-
cent of men’s wages in the sector, a larger wage gap compared to the rest of
the economy (where women’s wages are 99.5 percent of that of men).
Incoming tourists are mainly mass-market tourists, with smaller luxury
component. Nearly 40 million tourists visited Thailand in 2019, mainly
for leisure, followed by business and conferences, and a growing market for
medical and wellness tourism (of which Thailand is 4th ranked globally).
Most tourists are mass-market tourists (historically supported by a favorable
exchange rate), as the average spend per tourist in Thailand remains below
countries with higher or similar arrivals numbers, though the luxury market
has been growing. International tourists come mainly from China, ASEAN,
and Russia; the domestic tourism market has generally been small by both
trip size and value. The main tourist centers are Bangkok (with a large retail
centers and cultural sites), the beach resort areas (Phuket, Samui), and more
recently, mountainous areas.
The tourist sector is closely linked to the retail sector. In addition to the
accommodation and transportation sectors, the tourist sector is closely linked
to several high-end shopping malls, real estate (particularly for long staying
and/or frequent tourists), entertainment, and dining. The tourist sector also
56
©International Monetary Fund. Not for RedistributionAnnex 1. Case Studies
supports intracoun- Annex Figure 1.9. COVID-19 Impact on Tourist Arrivals and
try remittances from Accommodation
seasonal workers 100
to rural areas.
80
60
The Impact of
COVID‑19 on the 40
Tourism Sector 20
0
The tourism sector has
faced a collapse from –20
the unprecedented
–40
COVID‑19 shock.
Thailand was the –60 Hotel occupancy rate (percent)
Tourist arrivals (y/y change)
first country outside –80 Avg room rate (y/y change)
of China to register
–100
a COVID−19 case,
Jan. 2019
Feb. 19
Mar. 19
Apr. 19
May 19
June 19
July 19
Aug. 19
Sep. 19
Oct. 19
Nov. 19
Dec. 19
Jan. 20
Feb. 20
Mar. 20
Apr. 20
May 20
June 20
July 20
Aug. 20
Sep. 20
Oct. 20
and the country was
adversely affected
in the outbreak’s
early stages due to Sources: Haver Analytics; and Ministry of Tourism and Sports.
restrictions on Chi-
nese tourists. Once
the pandemic spread, the authorities quickly declared a state of emergency,
putting in place stringent containment measures and strict travel restrictions.
As a result, tourist arrivals, hotel occupancy, and average room rates have
fallen dramatically – tourist arrivals are expected to decline to just 6.7 million
tourists by the end of 2020.
There was a large dislocation in labor markets. In the first quarter of 2020,
there were 139,000 job losses related to the tourism sector, and the Thai
Chamber of Commerce estimates up to 6 million could be lose employment
by the end of the year given ongoing restrictions. Given the high rate of
informality, informal and migrant workers, particularly women, are likely
to suffer disproportionately, as they are unlikely to have access to safety nets
if they to fall ill or lose employment. As a result, the shock can exacerbate
already rising poverty rates and inequality. The Thai authorities have also
closed borders to neighboring countries to prevent infections, which contrib-
uted to slowing external migrant flows and outward remittances. The shock
has also financially strained airlines in the region, including Thai Airways, the
country’s leading carrier, as well as several budget airlines.
Nevertheless, the infections curve was quickly flattened, particularly
when compared with other countries in the region, in part due to strin-
57
©International Monetary Fund. Not for RedistributionTourism in the Post-Pandemic World
gent lockdown measures, followed by a cautious reopening in the back-
drop of a robust and integrated public health response. Cases plateaued
by April 2020, and Google-based mobility indicators suggest foot traffic
has quickly recovered as the economy reopened. Although this would sup-
port the resumption of tourism, including through confidence effects, the
authorities have remained generally cautious about the risk of a second
wave of infections, which materialized in late December 2020.
Policy Responses to Support the Tourism Sector
Thailand can be thought of having several comparative advantages prior to
COVID‑19. According to the World Economic Forum Global Competitive-
ness Index, Thailand scores well in the quality and availability of infrastruc-
ture, has a high quality of medical facilities and a pre-existing reputation for
medical tourism, has available capacity for high end tourists, and has experi-
ence in prior epidemic outbreaks, such as SARS. The sector has also proved
resilient in the past, weathering episodes of political unrest and natural
disasters. It is also supported by longstanding accommodative visa policies, a
well-connected airport hub, and strong strategic oversight through the Tour-
ism Authority of Thailand (TAT) under the Ministry of Tourism and Sports.
The Thai authorities have taken proactive measures to support the tourism
sector. Together with a program of providing soft financing to tour operators
of US$3 million, as part of their COVID‑19 fiscal package response, in the
near term, these centered on:
• Promoting domestic tourism. In June 2020, following the easing of
lockdown restrictions, the government swiftly approved three programs
worth US$700 million (about 0.14 percent of GDP) to support domestic
tourism. These include funds for: subsidizing travel for healthcare workers,
subsidizing accommodation, food and other travel expenditures for qualify-
ing domestic tourists, and subsidizing transportation costs for long distance
domestic trips. The incentives covered domestic travel undertaken between
July and October.
• Phased reopening for international tourists. The authorities have consid-
ered several ways to resume international tourist arrivals:
o Travel bubbles involve exclusive travel between countries that have
COVID‑19 infections under control. However, reciprocal market size is
an important consideration. Travel bubbles, aimed for Summer 2020,
were postponed after second wave breakouts in several candidate coun-
tries (Australia, Vietnam), while designing the needed travel insurance
policy to support it remains elusive.
58
©International Monetary Fund. Not for RedistributionAnnex 1. Case Studies
o Long-term stay with mobility restrictions have been rolled out, with
the Thailand Special Tourist Visa (STV) for long-stay visitors, introduced
and made effective in October 2020. This scheme requires visitors from
countries with low COVID‑19‑incidence, with adequate medical insur-
ance and proof of accommodation for the visit period, to be quarantined
for 14 days upon arrival at a certified quarantine facility, and upon com-
pletion of the quarantine, receive a negative COVID‑19 test, and they
must have a mobile phone app to use an application that tracks their
location during their stay. The scheme is valid for stays up to 90 days
and renewable twice. As of the end of November 2020, the scheme drew
825 visitors from 29 different countries (mainly China). In early Decem-
ber 2020, the authorities approved the expansion of the STV to visitors
from every country.
• Encouraging mixed use of physical and human resources. Some hotels
have switched to provide quarantine facilities and accommodation for med-
ical workers, though occupancy rates still remain at historically low levels.
With an eye toward the post-pandemic new normal while alleviating the
extent of economic scarring due to the shock, the authorities are also explor-
ing other areas to support a more robust tourist sector, including:
• Shift from mass tourism to low-density high-end tourism. This is in line with
the authorities’ intended long-term goal of promoting more sustainable
tourism with a lower ecological footprint.
• Further strengthening the healthcare system, for rapid and responsive preven-
tion, detection, and treatment, including via access for tourists.
• Investments in digital/mobile resources and connectivity to support touchless
service delivery (hotel check-ins, temperature monitoring). In addition,
with the spread of the coronavirus pandemic, digital technologies have
become more crucial than ever before. The travel industry and various tech
companies are increasingly experimenting with ways to use virtual reality
tourism to give people the same basic experience of tourism. In addition,
technology can facilitate a shift toward digitally self-guided tourism, that
does not require group travel and is therefore consistent with social distanc-
ing norms that are likely to persist for a long period.
59
©International Monetary Fund. Not for RedistributionThis page intentionally left blank ©International Monetary Fund. Not for Redistribution
Annex 2. Applying A Gravity Model to
Predict Post-Pandemic Tourism Flows

The gravity model framework is widely used in the economic literature to
analyze the patterns of international trade and capital movements, as well as
migration and tourism flows (Anderson and van Wincoop 2003; Bergstrand
and Egger 2007; Gil-Pareja, Llorca‑Vivero, and Martínez‑Serrano 2007;
Head and Ries 2008; Santana‑Gallego, Ledesma‑Rodríguez, and
Pérez‑Rodríguez 2010). But there is scarce research on modeling bilateral
tourist movements in a gravity framework, especially taking into account the
effect of infectious diseases. Most studies in this context look at the impact
of disease outbreaks, such as the SARS and avian flu epidemics, on tourism
in a specific country or region over a short period of time (Zeng, Carter, and
De Lacey 2005; Cooper 2006; Wilder-Smith 2006; Kuo and others 2008).
Using dummy variables infectious diseases, Roselló, Santana‑Gallego, and
Awan (2017) show that the eradication of infectious diseases benefits coun-
tries in terms of tourism flows and revenues. More recently, using a data set
of 38,184 pairs of countries over the period 1995–2017, Cevik (2020) finds
strong evidence that infectious diseases have a significant negative effect on
international tourism flows.

The empirical analysis is based on an unbalanced panel of annual observa-
tions for 38,184 pairs of countries during the period 1995–2017. Bilateral
tourism flows for 172 countries of origin and 222 countries of destina-
tion are taken from the WTO database, yielding a data set of more than
261,488 observations over the sample period. The main explanatory variable
of interest is the number of confirmed infectious-disease cases, including
Ebola, malaria, SARS, and yellow fever, which is obtained from the WHO
database. Following the literature, real GDP, population and the real effective
exchange rate (REER) are introduced as control variables, drawn from the
IMF World Economic Outlook (WEO) database and the World Bank World
Development Indicators (WDI) database.

                              61

©International Monetary Fund. Not for Redistribution
Tourism in the Post-Pandemic World
Standard gravity variables such as bilateral distance between countries, com-
mon official language, colonial history, and geographical contiguity are taken
from the Centre d’Etudes Prospectives et d’Informations Internationales
(CEPII) database, as presented in Mayer and Zignago (2011). Geographic
distance is measured as the great-circle distance in kilometers between the
capital cities of each country pair. Binary variables for language, colonial
history and geographical contiguity are assigned a value of 1 if a country pair
share a common official language, a colonial tie, and an adjacent border and
a value of 0 otherwise.
Bilateral flows between two countries tend to increase with per capita income
and decline with transportation costs as proxied by physical distance between
the countries. This gives a simple gravity model, in which the number of
tourists traveling in one direction between two countries depends on the
economic sizes of the countries and the geographical distance between them.
Building on Santos Silva and Tenreyro (2006), the baseline gravity specifica-
tion takes the following form in a panel data context:
ln(Tijt ) 5 b 1 a ln(GDPit ) 1 g ln(GDPjt ) 1 ln(Distij ) 1 i 1 j 1
t 1 ijt (1)
in which T ijdenotes international tourist flows between countries i (origin)
and j (destination); GDPis the level of per capita income in origin and desti-
nation country, respectively; Dist ijis the physical distance between countries i
(origin) and j (destination); theη i, φ j and μ t coefficients designate the coun-
try fixed effects capturing all time-invariant factors in origin and destination
country and the time fixed effects controlling for common shocks that may
affect international tourism across all countries in a given year, respectively.
ε ijtis an idiosyncratic error term that meets the standard assumptions of zero
mean and constant variance.
Since the objective is to understand the effect of infectious diseases on
international tourism, the parsimonious gravity model is augmented
with additional control variables along with the number of confirmed
infectious-disease cases:
ln(Tijt ) 5 b 1 aln(GDPit ) 1 gln(GDPjt ) 1 ln(Distij ) 1 Xijt 1
ln(Virijt ) 1 i 1 j 1 t 1 ijt (2)
where Xijt
denotes a vector of control variables, including the logarithm of
population in origin and destination countries, the REER in destination
62
©International Monetary Fund. Not for RedistributionAnnex 2. Applying A Gravity Model to Predict Post-Pandemic Tourism Flows
country, binary variables for common language, colonial history and geo-
graphical contiguity, and life expectancy and government effectiveness in
destination countries; Vir
ijtdenotes the number of confirmed cases of Ebola,
malaria, SARS, and yellow fever scaled by population in origin and destina-
tion countries. To account for possible heteroskedasticity, robust standard
errors are clustered at the country-pair level.1
We compare the out-of-sample forecasting performance of alternative gravity
models of bilateral tourism flows by partitioning the original sample period
(1995–2017) into two subsamples: (1) the estimation sample (1995–2014)
and the forecasting sample (2015–17). To evaluate forecast accuracy of these
alternative models, the mean absolute error (MAE), the root mean squared
error (RMSE) and the Theil Inequality Coefficient (U-Theil), the most
commonly used metrics in the literature, are employed as defined by the
following equations:
MAE 5 __n1 nt 51 | Ât,c 2 At,c | (3)
_______________
RMSE 5 √__1 n
2
n t 51 (Ât,c 2 At,c ) (4)
_______________
U 2 Theil 5
√ 1 n
__
n t 51 (Ât,c 2 At,c )2
__________ __________ (5)
√ __n1 nt 51 (Ât,c )2 1 √ __n1 nt 51 (Ât,c )2
in which A ˆ t,c and A
t,c
are the predicted and actual bilateral tourism flows at
time t, respectively, and n is the number of observations in the sample. The
model with the lowest MAE, RMSE, and U-Theil values is considered to
better forecast accuracy. These computations, presented in Annex Table 2.4,
confirm the relevance of infectious-disease episodes in several out-of-sample
forecasting exercises—lowering the RMSE of bilateral tourism flow forecasts
by as much as 7 percent compared to the standard model without the num-
ber of infectious-disease cases.
1The results remain broadly unchanged when standard errors are clustered at the country level.
63
©International Monetary Fund. Not for RedistributionTourism in the Post-Pandemic World
Annex Table 2.1. Infectious Diseases and International Tourism—PPML Estimations
(Dependent variable: Bilateral tourism flows)
[1] [2] [3] [4] [5]
Real GDP, origin 0.129*** 0.127*** 0.127*** 0.127*** 0.131***
[0.006] [0.006] [0.006] [0.006] [0.006]
Real GDP, destination 0.129*** 0.129*** 0.129*** 0.129*** 0.132***
[0.007] [0.008] [0.008] [0.008] [0.008]
Distance 0.228*** 0.232*** 0.231*** 0.232*** 0.229***
[0.004] [0.004] [0.004] [0.004] [0.004]
Common language 0.176*** 0.174*** 0.174*** 0.174*** 0.180***
[0.007] [0.007] [0.007] [0.007] [0.007]
Colonial history 0.080*** 0.083*** 0.083*** 0.083** 0.076***
[0.016] [0.016] [0.016] [0.016] [0.016]
Geographical contiguity 0.034 0.035 0.035 0.035 0.031
[0.019] [0.016] [0.016] [0.016] [0.016]
Population, origin 0.063*** 0.065*** 0.059*** 0.063*** 0.066***
[0.011] [0.011] [0.011] [0.011] [0.011]
Population, destination 0.080*** 0.078*** 0.082*** 0.078*** 0.084***
[0.012] [0.012] [0.012] [0.013] [0.012]
REER, destination 0.000*** 0.000*** 0.000*** 0.000*** 0.000***
[0.000] [0.000] [0.000] [0.000] [0.000]
Life expectancy, destination 0.097 0.103 0.113 0.091 0.088
[0.043] [0.043] [0.044] [0.044] [0.043]
Ebola
Origin 0.013***
[0.001]
Destination 0.010***
[0.002]
Malaria
Origin 0.001
[0.000]
Destination 0.001
[0.000]
SARS
Origin 0.003***
[0.02]
Destination 0.040***
[0.02]
Yellow fever
Origin 0.003
[0.000]
Destination 0.001
[0.001]
Number of observations 224,019 215,589 215,589 215,589 219,132
Origin FE Yes Yes Yes Yes Yes
Destination FE Yes Yes Yes Yes Yes
Year FE Yes Yes Yes Yes Yes
Adjusted R2 0.77 0.84 0.80 0.83 0.80
Note: The dependent variable is bilateral tourism flows (in log form). Robust standard errors, clustered at the country level, are
reported in brackets. A constant is included in each regression, but not shown in the table. *, **, and *** denote significance at the
10%, 5%, and 1% levels, respectively.
64
©International Monetary Fund. Not for RedistributionAnnex 2. Applying A Gravity Model to Predict Post-Pandemic Tourism Flows
Annex Table 2.2. Infectious Diseases and International Tourism—2SLS-IV
Estimations
(Dependent variable: Bilateral tourism flows)
[1] [2] [3] [4]
Real GDP, origin 0.933*** 0.935*** 0.959*** 0.957***
[0.012] [0.012] [0.014] [0.012]
Real GDP, destination 0.865*** 0.856*** 0.861*** 0.896***
[0.013] [0.013] [0.015] [0.013]
Distance 1.717*** 1.717*** 1.716*** 1.717***
[0.015] [0.015] [0.015] [0.015]
Common language 1.241*** 1.241*** 1.241*** 1.272***
[0.034] [0.034] [0.034] [0.034]
Colonial history 0.849*** 0.850*** 0.850*** 0.832***
[0.086] [0.086] [0.086] [0.084]
Geographical contiguity 1.210*** 1.207*** 1.208*** 1.163***
[0.067] [0.067] [0.067] [0.066]
Population, origin 0.523*** 0.517*** 0.514*** 0.498***
[0.022] [0.023] [0.023] [0.022]
Population, destination 0.526*** 0.562*** 0.514*** 0.576***
[0.023] [0.024] [0.024] [0.022]
REER, destination 0.001*** 0.001*** 0.001*** 0.001***
[0.000] [0.000] [0.000] [0.000]
Life expectancy, destination 0.097 0.039 0.214 0.209
[0.070] [0.078] [0.081] [0.068]
Ebola
Origin 0.065***
[0.005]
Destination 0.089***
[0.008]
Malaria
Origin 0.001
[0.001]
Destination 0.007
[0.001]
SARS
Origin 0.387***
[0.092]
Destination 0.078***
[0.104]
Yellow fever
Origin 0.004
[0.012]
Destination 0.017
[0.104]
Number of observations 210,221 210,221 210,221 213,645
Origin FE Yes Yes Yes Yes
Destination FE Yes Yes Yes Yes
Year FE Yes Yes Yes Yes
Pseudo R2 0.83 0.83 0.83 0.84
Note: The dependent variable is bilateral tourism flows (in log form). Robust standard errors, clustered at the
country level, are reported in brackets. A constant is included in each regression, but not shown in the table.
*, **, and *** denote significance at the 10%, 5%, and 1% levels, respectively.
65
©International Monetary Fund. Not for RedistributionTourism in the Post-Pandemic World
Annex Table 2.3. Infectious Diseases and Tourism—Robustness Checks
(2SLS-IV)
(Dependent variable: Bilateral tourism flows)
Truncated sample Sub-sample (1995–2007) Additional controls
Real GDP, origin 0.961*** 1.259*** 1.023***
[0.013] [0.028] [0.018]
Real GDP, destination 0.808*** 0.751*** 0.967***
[0.015] [0.028] [0.019]
Distance 1.632*** 1.688*** 1.704**
[0.015] [0.021] [0.018]
Common language 1.202*** 1.170*** 1.233***
[0.033] [0.046] [0.039]
Colonial history 0.755*** 0.919*** 0.864***
[0.089] [0.106] [0.093]
Geographical contiguity 1.116*** 1.232*** 1.261**
[0.072] [0.084] [0.074]
Population, origin 0.478*** 1.224*** 0.554***
[0.022] [0.057] [0.033]
Population, destination 0.478** 0.305*** 0.625***
[0.023] [0.057] [0.032]
REER, destination 0.001** 0.001** 0.001**
[0.000] [0.000] [0.000]
Life expectancy, destination 0.151 0.060 0.711***
[0.078] [0.136] [0.194]
Hospital beds, destination 0.027***
[0.010]
SARS
Origin 0.224*** 0.281*** 0.224***
[0.085] [0.041] [0.095]
Destination 0.028*** 0.016*** 0.011***
[0.091] [0.050] [0.103]
Number of observations 176,489 96,416 111,591
Origin FE Yes Yes Yes
Destination FE Yes Yes Yes
Year FE Yes Yes Yes
Adjusted R2 0.79 0.83 0.83
Note: The dependent variable is bilateral tourism flows (in log form). Robust standard errors, clustered at the
country level, are reported in brackets. A constant is included in each regression, but not shown in the table.
*, **, and *** denote significance at the 10%, 5%, and 1% levels, respectively.
66
©International Monetary Fund. Not for RedistributionAnnex 2. Applying A Gravity Model to Predict Post-Pandemic Tourism Flows
Annex Table 2.4. Infectious Diseases and Tourism—Estimations by Income Group and Region
(2SLS-IV)
(Dependent variable: Bilateral tourism flows)
Latin Middle
Advanced Developing Africa Asia Europe America East
Real GDP, origin 1.008*** 0.935*** 0.860*** 1.044*** 0.754*** 0.889*** 1.169***
[0.017] [0.020] [0.044] [0.054] [0.044] [0.035] [0.052]
Real GDP, destination 1.083*** 0.744*** 0.304*** 1.201*** 0.575*** 0.744*** 0.371***
[0.044] [0.024] [0.040] [0.077] [0.045] [0.047] [0.060]
Distance 1.351*** 1.821*** 1.512** 1.932*** 1.518*** 1.737*** 1.482***
[0.026] [0.019] [0.053] [0.077] [0.085] [0.051] [0.072]
Common language 0.584*** 1.404*** 1.170*** 0.697*** 0.863 1.451*** 0.781***
[0.054] [0.040] [0.058] [0.112] [0.406] [0.064] [0.126]
Colonial history 1.164*** 0.848*** 0.231 1.116** 0.109 0.541 0.526
[0.082] [0.146] [0.499] [0.409] [0.208] [0.529] [0.388]
Geographical contiguity 0.480*** 1.307*** 1.126** 0.936*** 1.525*** 0.970*** 1.662***
[0.106] [0.079] [0.148] [0.185] [0.167] [0.150] [0.198]
Population, origin 0.219*** 0.660*** 1.010*** 0.824*** 0.860*** 0.797*** 0.156
[0.030] [0.031] [0.065] [0.084] [0.068] [0.060] [0.084]
Population, destination 0.231*** 0.433*** 0.398*** 0.393 0.316 0.729*** 0.885***
[0.063] [0.031] [0.133] [0.179] [0.148] [0.114] [0.065]
REER, destination 0.006*** 0.000*** 0.000 0.002*** 0.000 0.000*** 0.000
[0.000] [0.000] [0.000] [0.001] [0.000] [0.000] [0.000]
Life expectancy, 5.847*** 0.585*** 0.366* 1.668** 3.911*** 0.745 0.887
destination [0.528] [0.087] [0.146] [0.554] [1.264] [0.420] [0.659]
SARS
Origin 0.472 0.556*** 0.362 0.993*** 0.144 0.455** 0.850*
[0.136] [0.120] [0.221] [0.315] [0.322] [0.219] [0.331]
Destination 0.246 0.243*** 0.207 0.311*** 0.761 0.204 0.229
[0.110] [0.091] [0.544] [0.191] [1.505] [0.630] [0.371]
Number of observations 70,721 139,500 36,232 23,922 23,794 33,750 21,802
Origin FE Yes Yes Yes Yes Yes Yes Yes
Destination FE Yes Yes Yes Yes Yes Yes Yes
Year FE Yes Yes Yes Yes Yes Yes Yes
Adjusted R2 0.88 0.85 0.81 0.86 0.85 0.85 0.81
Note: The dependent variable is bilateral tourism flows (in log form). Robust standard errors, clustered at the country level, are reported in brackets.
A constant is included in each regression, but not shown in the table. *, **, and *** denote significance at the 10%, 5%, and 1% levels, respectively.
Annex Table 2.5. Out-of-Sample Forecast Performance
(Dependent variable: Bilateral tourism flows)
Standard Ebola SARS
PPML models
MAE 5.103 5.086 4.954
RMSE 5.806 5.791 5.675
U-Theil 0.625 0.624 0.613
2SLS-IV models
MAE 1.168 1.165 1.096
RMSE 1.675 1.652 1.561
U-Theil 0.118 0.116 0.111
Note: Each model is trained with the data covering the period 1995–2014, then tested in fore-
casting on the period 2015–2017. The model with the lowest MAE, RMSE, and U-Theil values
is considered to better forecast accuracy, which is shown in bold.
67
©International Monetary Fund. Not for RedistributionThis page intentionally left blank ©International Monetary Fund. Not for Redistribution
Annex 3. Analyzing Macroeconomic
          Scenarios Using GIMF

Summary of New Features in the Theoretical Model
           The IMF’s Global Integrated Monetary and Fiscal model (GIMF) is an
           annual, multi-region, micro-founded general equilibrium model of the global
           economy. Readers are pointed to the documentation for the core model in
           Kumhof and others (2010) and Anderson and others (2013).

           The tourism sector is a special feature of this application of GIMF. It is not
           documented in the two aforementioned papers. While tourism is a service, a
           tourism bundle is produced in the same manner as consumption and invest-
           ment goods from a combination of tradable and nontradable goods, with
           one added feature—there is also a term for productivity, which is used in
           this paper to capture the costs incurred from the pandemic, including health
           costs, social distancing requirements, new technologies, and the like. The
           bundle of tourism services can be consumed by domestic households or by
           foreigner visitors, in which case it registers as tourism exports for the region
           and as imported tourism for the visitor’s region. Consequently, households
           have a two‑item consumption bundle made up of tourism services and other
           goods and services. The tourism portion consists of domestic tourist services
           produced (visiting within the region), and imports from foreign markets
           (visiting a foreign region). As with consumption goods, based on its produc-
           tion and consumption structure, tourism has a price, and forms part of the
           consumption basket, thereby having a role in determining consumer price
           index (CPI) inflation. Trade in tourism services is tracked bilaterally between
           all regions, just like consumption, investment, and intermediate goods.

           Because of the tourism sector, this version of the model has more detail
           in trade overall. Unlike in the standard GIMF, consumption and invest-
           ment goods are always treated separately, and not just as a single imported
           final good. Non-tariff barriers (NTBs) are also present, where country A

                                         69

          ©International Monetary Fund. Not for Redistribution
Tourism in the Post-Pandemic World
imposes the NTB, but country B will bear the cost in its production pro-
cesses, and then have to pass it back to the importing consumers through
higher prices. This is unlike tariffs, which would be imposed by country A
on country B, and country A’s government then collects the tariff revenues
which it can then redistribute. Country B facing the tariff only experiences
shifts in demand from the importing consumers in country A who bear the
cost of the tariff.
Summary of the Calibration of the Asia-Pacific and Western Hemisphere
Versions of GIMF
Two structurally identical eight-regions versions of GIMF are used, with
some overlap in the regions used. One is focused on Asia-Pacific regions
(ASEAN‑5, Pacific Island 5, Australia and New Zealand, China and the other
Asia-Pacific block), along with Europe, the United States, and the remain-
ing countries. The other is focused on the Western Hemisphere (Caribbean,
Central America, Latin America, and the other western hemisphere block)
along with Canada, Europe, the United States, and the remaining countries
to round out the model.1
Structurally, each country/regional block is close to identical, but with dif-
ferent key steady-state ratios and behavioral parameters (Annex Table 3.1).
These are drawn from stylized data set consistent with 2018, and assump-
tions on long-term values for certain stocks, such as the capital-to-output
and government debt-to-GDP ratios. There are data also for tourism services,
for exports, imports and consumption, from which its production data are
derived. The tourism economies vary markedly in their share of global GDP,
as does the size of tourism exports and the balance between consumption and
production of tourism services. As a share of their own GDP, tourism exports
1The more precise definitions of the regions are as follows: ASEAN‑5 (ASE) comprises Indonesia, Malaysia,
Philippines, Thailand, and Vietnam; Australia and New Zealand (ANZ) comprises Australia and New Zealand;
the Pacific Islands (PIC) comprises Fiji, Palau, Samoa, Tonga, and Vanuatu; the Caribbean (CRB) comprises
the Eastern Caribbean Currency Union (ECCU—Antigua and Barbuda, Dominica, Grenada, St. Kitts and
Nevis, St. Lucia, and St. Vincent and the Grenadines), Bahamas, Barbados, Belize, Dominican Republic,
and Jamaica; Central America (CAM) comprise Costa Rica, El Salvador, Guatemala, Honduras, Nicaragua,
and Panama; Latin America (LAM) comprises Argentina, Brazil, Chile, Colombia, Mexico and Peru; Other
Asia-Pacific (OAP) comprises India, Japan, Korea, the rest of South and Southeast Asia and the other Pacific
island states; Other Western Hemisphere (OWH) comprises Bolivia, Ecuador, Guyana, Paraguay, Surinam,
Trinidad and Tobago, Uruguay, Venezuela, and the remaining Caribbean islands; Europe (EUR) comprises
the European Union, Albania, Iceland, Montenegro, North Macedonia, Norway, Serbia, Switzerland, and the
United Kingdom; the Remaining Countries for the Asia-Pacific model (RC1) comprises any countries not in
ASE, ANZ, China (CHN), PIC, OAP, EUR, and the United States (USA); and the Remaining Countries for
the Western Hemisphere model (RC2) comprises any countries not in CRB, CAM, LAM, OWH, Canada
(CAN), EUR, and USA.
70
©International Monetary Fund. Not for RedistributionAnnex Table 3.1. Key National Accounts Ratios in GIMF
(Percent of a region’s GDP, unless otherwise stated)
Pacific Central Australia/ Latin United
Caribbean Islands ASEAN-5 America New Zealand Canada China Europe America States
Share of Global GDP (%, US$) 0.15 0.01 3.04 0.31 1.91 2.01 15.74 21.79 5.26 24.23
Domestic Demand
Household Consumption 63.9 51.1 61.0 65.3 57.4 56.8 47.5 57.0 65.6 65.2
Private Investment 21.0 24.8 22.6 18.5 18.9 18.6 27.5 20.7 16.0 17.4
Government Absorption 15.1 24.1 16.4 16.2 23.7 24.6 25.0 22.3 18.4 17.4
Tourism
Consumed 5.0 8.0 6.0 4.0 5.0 5.0 3.6 5.5 2.6 2.0
Produced 18.3 28.9 7.8 9.6 5.3 3.9 2.0 7.3 1.9 2.8
Annex 3. Analyzing Macroeconomic Scenarios Using GIMF
Trade
Goods Exports 12.6 20.7 171.2 17.9 18.8 30.5 18.7 18.5 22.8 12.1
71
Consumption 7.9 16.2 143.8 13.8 7.4 11.6 8.7 8.6 7.5 5.4
Investment 0.7 3.0 6.8 0.6 0.6 4.2 4.9 4.2 1.5 2.0
Intermediate 4.0 1.5 20.6 3.5 10.8 14.7 5.1 5.7 13.8 4.7
Tourism Service Exports 18.7 28.4 6.1 8.8 3.6 2.4 0.7 3.2 2.3 1.7
Goods Imports 26.9 43.1 44.4 23.8 19.2 29.6 17.1 20.4 19.5 12.9
Consumption 12.9 25.0 11.1 10.0 9.5 12.9 3.5 8.6 6.7 6.5
Investment 3.9 9.6 10.2 3.9 4.3 7.4 2.5 3.7 4.5 2.6
Intermediate 10.1 8.5 23.1 9.9 5.4 9.3 11.1 8.1 8.3 3.8
Tourism Service Imports 4.5 6.4 4.0 2.8 3.1 3.3 2.4 1.3 1.7 0.9
Sources: National statistical agencies; UN Comtrade database; and IMF staff calculations.
AQ1 Note: GIMF 5 ; ASEAN 5 Association of Southeast Asian Nations.
©International Monetary Fund. Not for RedistributionYou can also read