Annex 3.2 Internet Penetration and Macroeconomic Impacts1
←
→
Page content transcription
If your browser does not render page correctly, please read the page content below
Annex 3.2 Internet Penetration and Macroeconomic Impacts 1
This annex provides an overview of the data and econometric approach underpinning the
analysis of the impact of internet penetration on macroeconomic outcomes.

Digitalization holds the potential to promote economic growth and structural transformation. It
reduces asymmetric information, transaction costs, and promotes economies of scale. Empirical
work has widely corroborated the positive effect of digitalization on growth (Qiang and others,
2009; Czernich and others, 2011; Zaballos and López-Rivas, 2012), on services and non-routine 2
employment (Houngbonon and Liang, 2018; Autor and Dorn, 2009), and on female employment
(Klonner and Nolen, 2008; Sovbetov, 2018). Micro-level analysis has also confirmed the
productivity and employment gains from digitalization in sub-Saharan Africa (SSA) (Hjort and
Poulsen, 2019).

We contribute to the literature by estimating the impact of digitalization (proxied by internet
penetration) on macroeconomic outcomes by exploring the arrival of submarine cables in SSA as
an exogenous source of variation for internet penetration at the country level.

Data and Sample

The data on internet penetration (percent of population with access to the internet) is obtained
from the International Telecommunication Union. The macroeconomic variables of interest are
obtained from the International Monetary Fund (real per capita GDP, PPP 2011 international
dollar), United Nations (sector value added, constant 2010 prices), International Labor
Organization (sector employment shares) and Penn World Tables 9.1 (total employment
measured as number of persons engaged). The largest sample used in the regression analysis
covers 33 SSA countries over 2005–17. The average internet penetration rate for the full sample
increases from 5.0 percent in 2008 to 24.9 percent in 2017. Penetration rates in 2017 range from
1.3 percent to 62 percent, with a higher average for treatment countries (28.3 percent) than
control countries (18.2 percent). Between 2008 and 2017 treatment countries experienced a faster
increase in penetration (22 percentage points) than control countries (15.2 percentage points). 3

Empirical strategy

We estimate the effect of internet penetration on real per capita income growth, sector value
added, and employment shares. A key challenge in doing so is that higher internet penetration
itself could be driven by higher income growth. To address this endogeneity, we explore a
natural experiment—the large-scale arrival of internet submarine cables in SSA during 2009-12

1
 This online annex was prepared by Felix Simione and Yiruo Li, and is based on a forthcoming IMF working paper “Macroeconomic
impacts of Internet penetration in SSA: evidence from submarine cables.”
2
 Non-routine jobs comprise tasks that are generally not codifiable through computers (see Autor and Dorn 2009 for details).
3
 See next paragraph on the definition of “treatment” and “control”.
REGIONAL ECONOMIC OUTLOOK: SUB-SAHARAN AFRICA

 —which affected the pace of internet penetration across countries in different ways through
 faster speed and lower cost. 4

 The experiment we explore relates to the work of Hjort and Poulsen (2019), modified to account
 for the country- and macro-level setting of our analysis. Whereas Hjort and Poulsen’s analysis
 focused on whether a given firm is located near a terrestrial (inland) cable that is connected to a
 submarine cable in a landing (coastal) city, we focus on whether a given country is directly
 connected to a submarine cable. Hjort and Poulsen explore how their experiment affects
 employment rates across firms in 12 countries, whereas ours explore the effects on growth and
 employment shares across 33 countries. Moreover, Hjort and Poulsen estimate the effect of firms
 being located near a terrestrial cable, whereas we estimate the effect of countries’ level of
 internet penetration (instrumented by whether they are directly connected to a submarine cable).

 We define as “treated” those countries that became directly connected to a submarine cable. The
 “non-treated” (control) countries are by exclusion those that are not directly connected. Treated
 countries are mostly coastal 5, while control countries are landlocked. We construct two
 instrumental variables capturing (i) if a country is directly connected to submarine cable after
 2009, 6 and (ii) the data capacity of the submarine cables.

 The analysis builds on two identification assumptions. First, absent the arrival of submarine
 cables, the difference in internet penetration rates between coastal and landlocked countries
 would have remained broadly unchanged. Second, the timing of the arrival of the submarine
 cables and their capacity depends little on macroeconomic conditions in countries they connect.
 A few confounders could challenge the identification strategies. We control for them in the
 regression analysis (see robustness analysis below). The model specification follows two-stage
 least square (2SLS):

 , = 0 + 1 + 2 2009 + 3 ( ∗ 2009) , + 4 ,
 + , (1)

 , = 0 + 1 , + ∅ + + 3 , + , (1′)

 � , + 2 , + ,
 , = 0 + 1 (2)

 Equation (1) is the first-stage equation of the 2SLS, and is given by a fuzzy difference-in-
 differences specification (Duflo 2001) where , is internet penetration in country at
 time , is a dummy variable taking the value 1 if country is directly connected to a

 4
 Submarine cables are a network of fiber cables, placed under the sea, which connect different countries and continents. They move
 internet traffic with greater efficiency (faster speed and lower cost) compared to satellite networks that prevailed in the past.
 5
 The exceptions are Rwanda and Uganda that, although being landlocked, are directly connected to a submarine cable.
 6
 From now onwards, the expression “after 2009” includes the year 2009.

2 INTERNATIONAL MONETARY FUND | APRIL2020
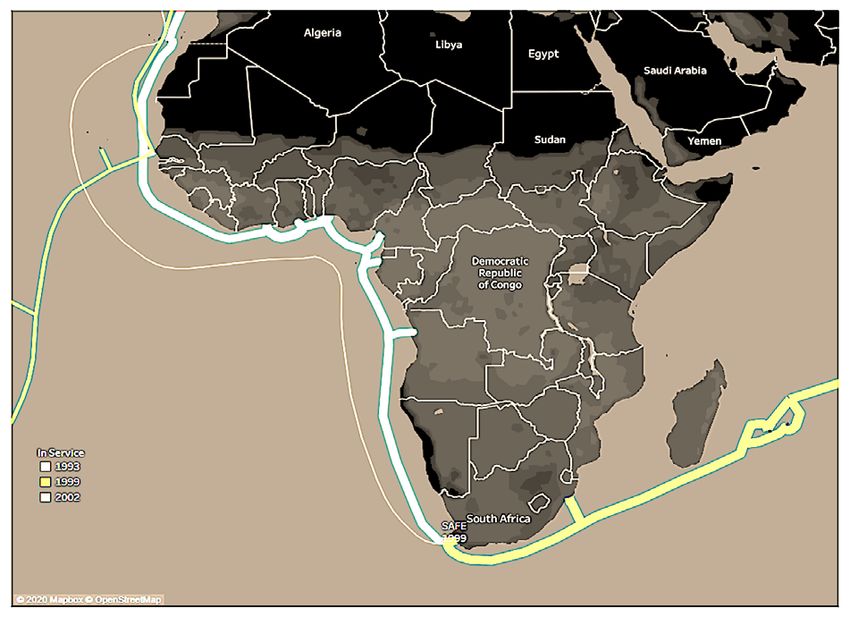
3. ANNEX—DIGITALIZATION IN SUB-SAHARAN AFRICA

submarine cable and zero otherwise. 2009 is a dummy variable taking the value 1 if the
time period is 2009 onwards and zero otherwise, ( ∗ 2009) , is an interaction
term, , is a vector of control variables, and , is the error term. Equation (1) by design
removes country- and time-fixed effects as it features two groups of countries that are observed
in two time periods under a difference-in-differences setting. The parameter 3 is the difference-
in-differences effect on internet penetration of being directly connected to the submarine cables
after 2009. 7

Equation (1’) explores an alternative instrumental variable where , is the data traffic
capacity of submarine cables. This specification controls for time- and country-fixed effects
(∅ and ) and other variables ( , ). Equation (2) is the second-stage equation. ,
captures selected macroeconomic indicators (real GDP per capita growth, and sector shares in
 � , is the fitted internet penetration
value added, and sectoral shares in employment).
rate from the first stage equations (1) and (1’). , is a vector of the same control variables used
in the relevant first-stage equation. They include lagged per capita income, public investment,
trade openness, terms of trade, population density, institutional quality, human capital, private
investment and fiscal position. All equations are estimated with robust standard errors (clustered
at the country level).

Assumptions

Relevance (first-stage regression)

Internet penetration increased substantially after 2009, and the increase is more rapid among the
treatment countries (see Figure 3.6 in main text of SSA REO chapter). This coincides with the
large-scale arrival of submarine cables (Figure 3.2.1). To investigate the varying pace of increase
in internet penetration between the treatment and control group, we further perform the
difference-in-differences analysis in a regression framework controlling for potential
confounders. The difference-in-difference estimate is statistically significant and suggests that
internet penetration increased by 3.2 percentage points more in treatment countries than in
control countries in 2009-17 (Table 3.2.1, column 1). This finding is similar to the evidence in
Cariolle (2018). A key reason why the control countries experienced a slower increase is the
limited network spillovers from neighboring coastal countries. Each SSA country is typically
covered by a single backbone network, so the transmission of internet content between two
countries’ networks is subject to existing legal and collaboration agreements, in the absence of
which significant transit fees apply (Hjort and Poulsen, 2019).

7
 Under this fuzzy difference-in-differences specification (Duflo, 2001), control countries also get exposed to the “treatment” (i.e., at
some point landlocked countries also connect to submarine cables indirectly through coastal countries), but the treatment outcome
(internet penetration) is less pronounced than in treatment countries.

 INTERNATIONAL MONETARY FUND | APRIL 2020 3
REGIONAL ECONOMIC OUTLOOK: SUB-SAHARAN AFRICA

 Annex Figure 3.2.1 The Arrival of Submarine Cables
 Before 2009 2009 Onwards

 Internet penetration also responds to the installed capacity of submarine cables. The estimated
 coefficient is positive and highly statistically significant (Table 3.2.1, column 2). These findings
 suggest that the timing of arrival of submarine cables and the capacity of submarine cables
 available in each country are relevant instrumental variables for internet penetration.

 Exogeneity

 We also present evidence that both the arrival of the submarine cables and their capacity are
 quasi-exogenous to macroeconomic variables such as income. A scatterplot of income and cable
 capacity and a chart of country’s income by cable do not show a systematic relationship
 (Figure 3.2.2). This is not surprising as submarine cables are typically deployed regionally to
 take advantage of economies of scale (so it is rare that a cable would skip a low-income country
 along its route) and are usually funded internationally by large consortia that includes private and
 other non-government agencies. This weakens the connection, if any, between a county’s income
 level and being connected to a submarine cable. Furthermore, the most deterministic factor of
 submarine cable capacity is technology available at the time.

4 INTERNATIONAL MONETARY FUND | APRIL2020
3. ANNEX—DIGITALIZATION IN SUB-SAHARAN AFRICA

 Annex Figure 3.2.2 Exogeneity of Instrumental Variables
 Income Distribution by Submarine Cables Correlation between Income and Cable Capacity

Results

Estimates of the impact of internet penetration are shown in Table 3.2.1. Based on OLS-fixed
effects regression results, we find that each percentage point increase in internet penetration is
associated with 0.13 percentage point increase in the growth rate of real per capita GDP. The
estimate is larger when we address endogeneity by employing as instrumental variable the
capacity of the submarine cables: each percentage point increase in internet penetration is
associated with 0.37 percentage point increase in growth, all else equal (column 6). 8

We further look at the impact of internet penetration on the sectoral composition of output. The
findings suggest that internet penetration boosts the share of services in total value added (column
7), while reducing the share of industry (column 9). The impact is insignificant for agriculture
(columns 11 and 12).

Table 3.3.2 focuses on the impact of internet penetration on total employment, and its sectoral and
gender composition. The findings are overall similar whether we use as instrumental variable the
timing of arrival or the capacity of the submarine cables. There is no impact on the level of total
employment (columns 1 and 2), but there are notable sectoral dynamics. Internet penetration does
not have a significant impact on industry employment as a share of total employment (columns 3
and 4), but it does have a significant impact on services employment. The estimates suggest that
each percentage point increase in internet penetration leads to an increase of 0.3-0.4 percentage
points in the share of services employment (columns 5 and 6). We further find that the impact on
services employment is higher for female than for male (columns 7, 9 and 10).

8
 Several studies estimate the relationship between growth and broadband internet penetration. The estimated coefficients range between
0.05 and 0.2, with very few exceptions of negative coefficients. However, most of the studies rely on a broader country sample (mostly
non-SSA), and do not address the endogeneity between income and internet penetration. The ITU (2012) and World Bank (2016)
provide an extensive review of the empirical work. The estimated large effect potentially reflects the fact that our sample consists fully of
SSA countries (where growth returns to digitalization are arguably higher than in advanced economies), whereas other studies consider
mostly advanced economies.

 INTERNATIONAL MONETARY FUND | APRIL 2020 5
REGIONAL ECONOMIC OUTLOOK: SUB-SAHARAN AFRICA

 Robustness

 The difference-in-differences impact of cable arrival on internet penetration is statistically
 insignificant in the pre-treatment period (2000-2008), which supports the identification strategy.
 The treatment period (post-2009) coincides with two external shocks that might have affected
 growth differently across treated and control countries: (1) the 2014-15 terms of trade shock and
 (2) the 2008-09 financial crisis. We addressed the potential bias from (1) by including terms of
 trade as a control variable in the regressions. To address (2), we run alternative regressions
 excluding countries heavily affected by the financial crisis, and find that the results still hold.
 The results are also robust to the inclusion of access to electricity (an input to growth correlated
 with internet penetration) as an additional control variable, and to the exclusion from the sample
 of outlier top performers on internet penetration. The results also hold when adjusting the sample
 end-year to different years in 2013-2017.

 Annex Table 3.2.1 Internet Penetration, GDP Growth, and Sector Share of Total Value-added
 First Stage Second Stage
 Services and trade Manuf. and similar Agriculture
 Dependent variable: Internet Penetration Real per capita GDP growth
 (% of GDP) (% of GDP) (% of GDP)
 (1) (2) (3: FE1) (4: FE2) (5: IV1) (6: IV2) (7: IV1) (8: IV2) (9: IV1) (10: IV2) (11: IV1) (12: IV2)
 3.1707**
 Treatment*Post2009
 (1.3288)
 -1.5677
 Treatment
 (1.0563)
 3.6847***
 Post2009
 (1.1272)
 0.0008***
 Cable Capacity
 -0.0002
 0.1344* 0.1054 0.0530 0.3749** 0.1634* 0.0162 -0.3233** -0.0796 0.0365 0.0626
 Internet use (% pop.)
 (0.0680) (0.0905) (0.0628) (0.1661) (0.0875) (0.1763) (0.1359) (0.2226) (0.1176) (0.1205)
 4.7816*** 15.3078** -16.1115*** -19.2055*** -0.8094 -23.6526*** 1.4160 1.7902 7.7093* 11.0699** -6.7858*** -8.5469**
 Lagged Real Per capita GDP (log)
 (0.6177) -7.4566 (3.7979) (5.2539) (0.6866) (5.3957) (1.6148) (3.5898) (4.1317) (4.5717) (2.3792) (3.8618)
 -0.0770* -0.0509 0.0920 0.0311 0.0655*** 0.0484 -0.0284 0.0680*** 0.0186 -0.1275*** 0.0915 0.0473
 Investment
 (0.0398) -0.12867 (0.0621) (0.0684) (0.0215) (0.0748) (0.0997) (0.0199) (0.1145) (0.0487) (0.1084) (0.0333)
 0.9560*** 4.2246 -1.2587 -1.0246 0.0215* 0.1212*** -0.0055 -0.0325 0.1343*** 0.0453 -0.1613*** -0.0284
 Years of schooling
 (0.2238) -6.5026 (1.7438) (1.6105) (0.0112) (0.0298) (0.0296) (0.0219) (0.0515) (0.0426) (0.0339) (0.0253)
 -0.0319** -0.0917* 0.0632*** 0.0865*** 0.0020 -0.0058 0.9403 -0.5990 -4.5714 0.2175 -3.0569 -2.0673**
 Trade openness (% GDP)
 (0.0137) -0.0506 (0.0213) (0.0283) (0.0024) (0.0393) (1.8348) (0.9941) (2.7859) (1.4045) (2.1557) (0.9546)
 2.8751*** 1.0618 2.8133** 2.5739** 2.1367*** 1.8312 0.1823 -0.2663 0.8988 2.3146 -2.0119** 1.0066
 Institutional quality
 (0.7938) -2.8658 (1.3279) (1.1814) (0.6999) (1.2742) (0.6427) (1.5653) (1.1629) (2.1766) (0.9646) (1.1473)
 -0.0205 -0.0119 0.0059 0.0150 0.0331 -2.2996 -0.0077 -0.0056 0.0199 0.0149 -0.0140 -0.0172***
 Terms of trade, change
 (0.0199) -0.0177 (0.0113) (0.0106) (0.1594) (2.8593) (0.0151) (0.0069) (0.0202) (0.0109) (0.0157) (0.0061)
 0.0046 -0.0028 -0.0132 -0.0219 0.0207* 0.0185
 Population density (people per square Km)
 (0.0032) -0.0794 (0.0290) (0.0373) (0.0117) (0.0115)
 0.2773*** 0.3369 -0.2013** -0.1306 -0.0716** -0.1920
 Private credit
 (0.0363) -0.3204 (0.0940) (0.0912) (0.0301) (0.1569)
 -0.0066 -0.0168 0.0920** 0.0664 0.0967*** 0.0823*
 Fiscal balance
 (0.0549) (0.0579) (0.0452) (0.0473) (0.0327) (0.0443)
 Sample 2005-17 2005-17 2005-17 2005-17 2005-17 2005-17 2005-17 2005-17 2005-17 2005-17 2005-17 2005-17
 Year/Country fixed effects Yes1 Yes Yes Yes No1 Yes No1 Yes No1 Yes No1 Yes
 Observations 395 265 395 265 395 265 406 268 406 268 406 268
 R-squared 0.5792 0.824 0.313 0.416 0.1119 0.3174 0.1345 0.9495 0.4454 0.9406 0.5755 0.9736
 No. of countries 32 21 32 21 32 21 33 21 33 21 33 21
 Source: Authors' estimates
 ***, ** and * denote statistical significance at 1%, 5% and 10% level, respectively. Standard errors are in parenthesis and are clustered at the country level. The IV is defined as being directly connected to a
 submarine cable in post-2009 (IV1) and total installed capacity of submarine cables (IV2). Fixed effects (non-IV) estimates are shown in columns 3 (whole sample) and 4 (coastal + Rwanda and Uganda).
 1/ Two-period two-group difference-in-differences specification in the first stage removes fixed effects

6 INTERNATIONAL MONETARY FUND | APRIL2020
3. ANNEX—DIGITALIZATION IN SUB-SAHARAN AFRICA

 Annex Table 3.2.2 Internet Penetration and Sector Employment Shares
 Percent of total employment
 Dependent variable: Total employment (log)
 Industry Services Services, Male Services, Female
 (1: IV1) (2: IV2) (3: IV1) (4: IV2) (5: IV1) (6: IV2) (7: IV1) (8: IV2) (9: IV1) (10: IV2)
 0.0150 0.0003 0.0629 -0.0305 0.3377** 0.3627** 0.1968* 0.2431 0.4944*** 0.4962***
Internet use (% pop.)
 (0.0124) (0.0036) (0.0821) (0.0768) (0.1321) (0.1556) (0.1106) (0.1579) (0.1752) (0.1632)
 -0.3503 0.1080 3.2641** 3.6296* 13.7796*** -2.1886 11.2349*** -2.7987 16.8909*** -1.6997
Lagged Real Per capita GDP (log)
 (0.4557) (0.0795) (1.5109) (2.1618) (2.6638) (4.6890) (2.2891) (4.4350) (3.7181) (5.1854)
 0.0257 -0.0005 -0.0319 0.0012 -0.2781** -0.0365 -0.2336** -0.0469 -0.3456** -0.0250
Investment
 (0.0164) (0.0007) (0.0706) (0.0191) (0.1184) (0.0441) (0.1149) (0.0402) (0.1433) (0.0565)
 0.2031* 0.0051 0.0420 0.0088 0.0515 0.0562** 0.0278 0.0450* 0.0839 0.0628**
Years of schooling
 (0.1135) (0.0284) (0.0312) (0.0113) (0.0580) (0.0248) (0.0616) (0.0234) (0.0658) (0.0289)
 -0.0163 -0.0009* 0.9652 -1.4338** 2.1187 -1.4920 0.3203 -1.1813 4.8166 -1.6220
Trade openness (% GDP)
 (0.0099) (0.0005) (2.1154) (0.5890) (3.3216) (1.3153) (2.7491) (1.2457) (4.3954) (1.4242)
 -0.1706 -0.0443*** -0.3556 -0.2901 -0.8498 -3.8713** -0.0610 -3.0809** -1.8883 -4.8883*
Institutional quality
 (0.6315) (0.0168) (0.7198) (0.5447) (1.0119) (1.8852) (0.9113) (1.5527) (1.2781) (2.5561)
 0.0050** 0.0000 -0.0151 0.0017 -0.0289 -0.0051 -0.0329** -0.0069 -0.0257 -0.0026
Terms of trade, change
 (0.0025) (0.0001) (0.0120) (0.0031) (0.0182) (0.0071) (0.0160) (0.0064) (0.0270) (0.0081)
Sample 2005-17 2005-17 2005-17 2005-17 2005-17 2005-17 2005-17 2005-17 2005-17 2005-17
Year/Country fixed effects No1 Yes No1 Yes No1 Yes No1 Yes No1 Yes
Observations 401 268 406 268 406 268 406 268 406 268
R-squared 0.1295 0.9997 0.2269 0.9774 0.5840 0.9761 0.5192 0.9670 0.5858 0.9815
No. of countries 32 21 33 21 33 21 33 21 33 21
Source: Authors' estimates
***, ** and * denote statistical significance at 1%, 5% and 10% level, respectively. Standard errors are in parenthesis and are clustered at the country level. The IV is
defined as being directly connected to a submarine cable in post-2009 (IV1) and total installed capacity of submarine cables (IV2).
1/ Two-period two-group difference-in-differences specification in the first stage removes fixed effects.
The underlying data of employment is from Penn World Tables 9.1 (columns 1 and 2) and ILO (remaining columns).

 INTERNATIONAL MONETARY FUND | APRIL 2020 7
REGIONAL ECONOMIC OUTLOOK: SUB-SAHARAN AFRICA

 References

 Autor, D. H., & Dorn, D. (2009). Inequality and Specialization: The Growth of Low-skill
 Service Jobs in the United States. NBER Working Paper Series, 15150.

 Cariolle, J. (2018), Telecommunication Submarine-Cable Deployment and the Digital Divide in
 Sub Saharan Africa. Ferdi Working Paper P241, May 2019.

 Czernich, N., Falck, O., Kretschmer, T., & Woessmann, L. (2011). Broadband infrastructure and
 economic growth. The Economic Journal, 121(552), 505-532. Cite 801

 Duflo, E. (2001), Schooling and Labor Market Consequences of School Construction in
 Indonesia: Evidence from an Unusual Policy Experiment. American Economic Review.
 September.

 Hjort J. and Poulsen J. (2019), The Arrival of Fast Internet and Employment in Africa. American
 Economic Review, 109 (3): 1032-79.

 Houngbonon, Georges V.; Liang, Julienne (2018) : The Impact of Broadband Internet on
 Employment in France, 29th European Regional Conference of the International
 Telecommunications Society (ITS): "Towards a digital future: Turning technology into
 markets?", Trento, Italy, 1st - 4th August 2018, International Telecommunications Society
 (ITS), Trento

 Nolen, P. (2008). Does ICT Benefit the Poor? Evidence from South Africa. Working paper.

 Qiang, C. Z. W., Rossotto, C. M., & Kimura, K. (2009). Economic Impacts of Broadband.
 Information and Communications for Development 2009: Extending reach and increasing
 impact, 3, 35-50.

 Sovbetov, Y. (2018). Impact of Digital Economy on Female Employment: Evidence from
 Turkey. International Economic Journal, 32(2), 256-270.

 World Bank. 2018. Innovative Business Models for Expanding Fiber-Optic Networks and
 Closing the Access Gaps.

 Zaballos, A. G., & López-Rivas, R. (2012). Socioeconomic Impact of Broadband in Latin
 American and Caribbean Countries. Inter-American Development Bank, 220.

8 INTERNATIONAL MONETARY FUND | APRIL2020
3. ANNEX—DIGITALIZATION IN SUB-SAHARAN AFRICA

 Annex 3.3. Digital Connectivity and Firm Performance in sub-Saharan Africa 9
This annex provides an overview of the data and econometric approach underpinning the
analysis of the impact of digitalization on firm performance.

Digital connectivity creates opportunities for improving firms’ performance. Yet, the literature
on the effects of internet use on firms’ outcomes in sub-Saharan Africa (SSA) is embryonic.
Using worldwide firm-level data, Clarke and others (2015) find that internet use increases firms’
growth and labor productivity, particularly for small firms. Tackling a different angle, Hjort and
Poulsen (2019) show that increased broadband internet penetration has stimulated job creation by
increasing firms’ entry, exports and productivity. Recently, Cariolle, Le Goff, and Santoni
(2019) analyze the impact of email use on firm performance using a larger sample of developing
countries and find positive effects on firms’ sales and the number of full-time workers. We
contribute to the literature by focusing on firms located in SSA countries.

Our analysis uses the World Bank Enterprise Surveys (WBES), a rich database covering a
representative sample of firms operating in the formal manufacturing and services sectors. Since
sending/receiving emails is the most basic way of accessing the internet, we measure firms’
digital connectivity by the use of email to communicate with clients or suppliers. We find that
57.2 percent of firms in SSA use email for business purposes, which is below the world average
of 71 percent, but comparable to take-up by firms in the Middle East and North Africa. In SSA,
email user tends to be more prevalent among large and experienced firms, as well as firms that
are foreign-owned and export to international markets (Annex Figure 3.3.1).

 Annex Figure 3.3.1. Email Use by sub-Saharan African Firms
 Email Use in SSA and the World Email Use in SSA by Firm Characteristics

9
 This online annex was prepared by Sampawende Jules Tapsoba and Martha Tesfaye Woldemichael based on a forthcoming IMF
working paper “Digital Connectivity and Firm Performance in sub-Saharan Africa,” co-authored with Joël Cariolle (FERDI) and Maëlan
Legoff (Banque de France), with the collaboration of Olivier Santoni (FERDI).

 INTERNATIONAL MONETARY FUND | APRIL 2020 9
REGIONAL ECONOMIC OUTLOOK: SUB-SAHARAN AFRICA

 We formally assess the impact of digital connectivity on private-sector performance by
 estimating the following model using an instrumental variables (IV) approach:

 , ,s, = 0 + 1 , ,s, + 2 , ,s, + ( × ρs × ) + + , ,s,

 where subscripts j, s, l, t refer to the country, sector, location, and survey year, respectively. , ,s,
 is the dependent variable measuring either annual sales or the number of workers in firm
 operating in sector s. For the latter, we also distinguish between permanent and temporary
 workers, and, for the sub-sample of manufacturing firms, (i) between permanent production and
 non-production workers and (ii) skilled and unskilled production workers. , ,s, is a dummy
 equal to one if firm in sector s reports using email to communicate with its clients or suppliers
 at the time of the survey. , , s, is a vector of control variables. It includes the firm’s age, size
 (number of full-time permanent employees when the firm started operations), foreign ownership,
 exporting status, experience of the top manager, access to bank financing, and distance to the
 closest submarine cable landing station or internet exchange point. We also include country-
 sector-year ( ×ρs× ) and location ( ) fixed effects. , ,s, is a random error term.

 The identification strategy borrows from Cariolle, Le Goff and Santoni (2019). It is built on the
 assumption that (i) firms’ digital connectivity via the internet is directly affected by the country’s
 submarine cables network exposure to seismic risks, and (ii) firms are heterogeneously affected
 by such vulnerability to internet disruptions based on their distance to international
 telecommunications infrastructure nodes. Studies have shown that maritime seismic events can
 cause submarine cable wear and breaks (Carter and others, 2009; Carter and others, 2014; Clark,
 2016; Aceto and others, 2018), and that locations distant from key infrastructure nodes are more
 vulnerable to telecommunications disruptions (Grubesic and Murray, 2006; Grubesic and others,
 2003; Cariolle, 2019). Therefore, the variable used to instrument email use is the interaction
 between the annual frequency of seaquakes and the firm’s distance to the closest connectivity
 infrastructure defined as either a submarine cable landing station or internet exchange point. 10

 Instrument , ,s, = , × j, ,s,

 While the IV strategy precludes testing the exclusion restriction due to the availability of a single
 instrument, we calibrate the latter such that the likelihood of meeting the exclusion restriction is
 maximized. Specifically, we only consider seaquakes whose epicenter is located at least 100 km
 but less than 1,000 km away from the submarine cable landing station to ensure a reasonable
 probability of disruption to the submarine cables network without a direct damage to the coast. In
 addition, we only consider seaquakes of medium intensity, i.e., those with a magnitude below

 10
 While firms in the same location share the same nodes, each survey round from WBES is administered to a
 nationally representative sample of firms, usually covering businesses operating in different cities within the same
 country, thus providing sufficient variation for running regressions.

10 INTERNATIONAL MONETARY FUND | APRIL2020
3. ANNEX—DIGITALIZATION IN SUB-SAHARAN AFRICA

6.5 on the Richter scale to avoid a direct devastating impact on coastal areas that would violate
the exclusion restriction.

The analysis covers more than 18,000 observations from 39 SSA countries. Standard errors are
clustered at the country-location-sector level. Geographical coordinates of submarine cable
landing stations and internet exchange points are culled from Telegeography, PCH and Peering
DB, while data on seaquakes are taken from the Northern California Earthquake Data Center of
the University of Berkeley.

Annex Table 3.3.1 summarizes the results. First-stage regressions confirm a negative and
statistically significant relationship between email use and digital vulnerability to seaquakes. We
find that firms using email for business record sales 2.6 times higher than non-users’ and employ
eight times more workers than non-users. They create jobs by hiring more permanent, full-time
employees while cutting their demand for temporary workers. The results also show that email
use shifts the composition of the manufacturing workforce in favor of non-production workers
(e.g., administrative and support staff) and skilled production workers.

Our results suggest that email use boosts firms’ sales and employment performance. Digitally
connected firms hire more workers on permanent positions, hence expanding the job-secure
workforce. However, digitally connected manufacturing firms tend to increase less rapidly the
size of their production workforce, and only hire skilled production workers, suggesting a skill-
biased effect of digitalization. These results emphasize the importance of addressing the skills
shortages and mismatch that typically characterize labor markets in sub-Saharan Africa so that
countries can fully reap the digital dividend.

 INTERNATIONAL MONETARY FUND | APRIL 2020 11
REGIONAL ECONOMIC OUTLOOK: SUB-SAHARAN AFRICA

 Annex Table 3.3.1. Impact of Email Use on Firms’ Sales and Employment

 All Firms Manufacturing Firms
 (1) (2) (3) (4) (5) (6) (7) (8)
 Log # Log # Log # Log #
 Log # Log #
 Log real Log # perm. non- perm. skilled unskilled
 temporary permanent
 sales workers production production production production
 workers workers
 workers workers workers workers

 Email use 0.965* 2.100*** -2.140*** 2.229*** 2.555*** 1.160*** 3.795*** -8.877***
 (0.567) (0.554) (0.315) (0.565) (0.708) (0.326) (0.883) (2.333)
 Log age 0.345*** 0.159*** 0.100 0.149*** 0.191*** 0.195*** 0.148** 0.288*
 (0.039) (0.029) (0.065) (0.029) (0.051) (0.032) (0.075) (0.152)
 Log inital # employees 0.683*** 0.371*** 0.459*** 0.334*** 0.291*** 0.451*** 0.123 1.361***
 (0.085) (0.058) (0.060) (0.059) (0.063) (0.044) (0.110) (0.232)
 Foreign ownership 0.589*** 0.084 0.332*** 0.067 0.216** 0.139*** 0.062 0.772***
 (0.141) (0.055) (0.086) (0.057) (0.085) (0.045) (0.115) (0.273)
 Direct exporter 0.716*** 0.032 0.894*** -0.044 -0.029 0.164** -0.415 1.554***
 (0.181) (0.108) (0.195) (0.110) (0.155) (0.078) (0.335) (0.599)
 Log manager experience 0.111*** 0.049* 0.079 0.043 0.014 0.092*** 0.038** 0.243***
 (0.034) (0.026) (0.080) (0.027) (0.038) (0.013) (0.017) (0.046)
 Bank loan 0.430*** 0.014 0.575*** -0.033 -0.051 0.096* -0.507*** 1.782***
 (0.114) (0.073) (0.112) (0.076) (0.125) (0.051) (0.187) (0.493)
 Log distance to telecom node 0.030 0.004 -0.071 0.002 -0.098*** -0.006 -0.038 0.203**
 (0.025) (0.022) (0.058) (0.026) (0.030) (0.037) (0.088) (0.095)
 First-stage regressions

 Seaquake freq. X log distance -0.702*** -0.781*** -0.655*** -0.702*** -0.384*** -0.384*** -0.385*** -0.385***
 (0.112) (0.117) (0.117) (0.112) (0.093) (0.093) (0.101) (0.101)

 Number of observations 16,501 18,614 17,794 18,403 7,681 7,716 7,090 7,581
 Number of countries 38 39 39 39 30 30 26 30
 RMSE 1.392 0.974 1.453 1.001 1.114 0.723 1.573 3.757
 Kleibergen-Paap F-stat 39.48 44.75 31.31 44.37 17.21 17.22 14.53 14.65
 Country-sector-year FE Yes Yes Yes Yes Yes Yes Yes Yes
 Location FE Yes Yes Yes Yes Yes Yes Yes Yes

 Impact, rel. to non-email users1 2.6 8.2 0.1 9.3 12.9 3.2 44.5 0.0
 Impact, in percent 162% 717% -88% 829% 1,187% 219% 4,348% -100%

 Sources: World Bank Enterprise Surveys, Telegeography, PCH, PeeringDB, Northern California Earthquake Data Center, and IMF staff calculations.
 Notes: ***, ** and * indicate statistical significance at 1, 5 and 10 percent level, respectively. Standard errors are clustered at the country-location-
 year level. Instrumental variable is the interaction between the frequency of seaquakes and the log distance of the firm to the closest connectivity
 infrastructure.
 1
 Impact obtained by exponentiating the coefficient on the binary variable for email use.

12 INTERNATIONAL MONETARY FUND | APRIL2020
3. ANNEX—DIGITALIZATION IN SUB-SAHARAN AFRICA

 References

Aceto, G., Botta, A., Marchetta, P., Persico, V. and A. Pescapé (2018). A Comprehensive
 Survey on Internet Outages. Journal of Network and Computer Applications, in Press.

Cariolle, J. (2019). Telecommunication Submarine-Cable Deployment and the Digital Divide
 in sub-Saharan Africa. Ferdi Working Paper P241, May 2019 (Revised).

Cariolle, J., Le Goff, M., and O. Santoni (2019). Digital Vulnerability and Performance of
 Firms in Developing Countries. Banque de France Working Paper, February 2019, WP
 #709.

Cariolle, J., Legoff, M., Tapsoba, S. J. and M. T. Woldemichael (Forthcoming). Digital
 Connectivity and Firm Performance in sub-Saharan Africa.

Carter, L., Burnett, D., Drew, S., Marle, G., Hagadorn, L., Bartlett-McNeil, D. and N. Irvine
 (2009). Submarine Cables and the Oceans – Connecting the World. UNEP-WCMC
 Biodiversity Series No. 31. Cambridge: UNEP-WCMC.

Carter, L., Gavey, R., Talling, P.J. and J.T. Liu (2014). Insights into Submarine Geohazards
 from Breaks in Subsea Telecommunication Cables. Oceanography 27(2): 58-67.

Clark, B. (2016). Undersea Cables and the Future of Submarine Competition. Bulletin of the
 Atomic Scientists, 72(4):234-237.

Clarke, G., Qiang, C. Z., and L. C. Xu (2015). The Internet as General-Purpose Technology:
 Firm-Level Evidence from around the World. Economics Letters, 135(C): 24–27.

Grubesic, T. H. and A.T. Murray (2006). Vital Nodes, Interconnected Infrastructures, and the
 Geographies of Network Survivability. Annals of the Association of American
 Geographers, 96(1): 64-83.

Grubesic, T.H., O’Kelly, M. E., and A.T. Murray (2003). A Geographic Perspective on
 Commercial Internet Survivability. Telematics and Informatics, 20(1): 51-69.

Hjort, J., and J. Poulsen (2019). The Arrival of Fast Internet and Employment in Africa.
 American Economic Review, 109(3), 1032-1079

.

 INTERNATIONAL MONETARY FUND | APRIL 2020 13
REGIONAL ECONOMIC OUTLOOK: SUB-SAHARAN AFRICA

 Annex 3.4. Impact of Digitalization on Fiscal Revenues11
 This annex provides an overview of the data and empirical approach underpinning the
 analysis of the impact of digitalization on government revenue.

 We use the proportion of households with internet access and the share of mobile cellular
 subscriptions per 100 people to capture the level of digitalization. The following regression
 equation is estimated:

 , =∝ + , −1 + ′ , −1 + + + ,

 Where , is government revenue as a percentage of GDP for country in time .
 We use two fiscal variables: total government revenue excluding grants, and tax revenue.
 The data are from the IMF’s World Economic Outlook (WEO). , −1 is the
 digitalization variable of interest-either the proportion of households with internet access and
 the share of mobile cellular subscriptions per 100 people extracted from UN’s International
 Telecommunication Union database, ′ , −1 is a vector of other controls, and and are
 country and time effects. The control variables include traditional determinants of
 government revenue such as the level of development captured by the logarithm of GDP per
 capita, economic growth, trade openness measured by the sum of imports and exports in
 percentage of GDP, terms of trade, the size of the agriculture sector (in percentage of GDP),
 the index of corruption, the inflation rate and education. All these variables are from the
 IMF’s WEO and the World Bank’s World Development Indicators.

 To estimate the equation, we use an instrumental variable approach (two-stage least squares)
 to deal with the issue of endogeneity stemming from the reverse causality, the omission of
 variables and the measurement errors. To this end, we exploit the exogeneous deployment of
 submarine cables to instrument for the level of fixed broadband subscriptions. As explained
 in Section II, the arrival of submarine cables has significantly contributed to expanding the
 use of the internet and mobile phones on the African continent. We define a binary variable
 taking the value of 1 if the country is connected to a submarine cable and 0 otherwise.

 The results are reported in Annex Table 3.4.1. The estimates are performed on a sample of
 37 sub-Saharan African countries over the period 2000-18. Columns 1-4 estimate the impact
 of digitalization on government revenue excluding grants, and tax revenue in sub-Saharan
 Africa using the traditional panel fixed-effects model. Columns 5-8 employ the two-stage
 least squares method.

 The results show that digitalization is associated with an increase in government revenue as
 the coefficient associated with digitalization is positive and significant in all columns. A
 move from the 25th to 75th percentile of the level of digitalization is associated with an
 increase in government revenue excluding grants by up to 2.1 percent of GDP (column 3).

 11
 This online annex was prepared by Rasmane Ouedraogo, with Mehmet Cangul and Nadia Esham.
14 INTERNATIONAL MONETARY FUND | APRIL2020
3. ANNEX—DIGITALIZATION IN SUB-SAHARAN AFRICA

 Annex Table 3.4.1. Impact of Digitalization on Government Revenue
 (1) (2) (3) (4) (5) (6) (7) (8)
 OLS, Panel fixed-effects IV
 Access to internet Mobile phone subscription Access to internet Mobile phone subscription
 Total revenue Total revenue Total revenue Total revenue
 Tax revenue Tax revenue Tax revenue Tax revenue
VARIABLES excluding excluding excluding grants excluding grants

Digitalization, t-1 0.0411*** 0.0269** 0.3781* 0.2645* 0.0814* 0.1240*** 0.6743** 0.5740***
 (0.011) (0.012) (0.209) (0.155) (0.042) (0.030) (0.271) (0.184)
GDP per capita, Log, t-1 2.5190* 2.0205 4.9805*** 2.7499** -1.0787 2.8826*** -0.1223 1.4574***
 (1.368) (1.251) (1.561) (1.120) (0.992) (0.596) (0.784) (0.537)
GDP growth, t-1 0.0553 0.0504 -0.0085 0.0164 0.0995 0.1324 -0.0273 0.0721
 (0.054) (0.049) (0.042) (0.040) (0.104) (0.083) (0.082) (0.068)
Terms of trade, t-1 0.0146 0.0096 0.0151 0.0106 0.0294 0.0307 0.0337* 0.0206
 (0.009) (0.009) (0.010) (0.010) (0.020) (0.020) (0.018) (0.017)
Trade oppenness, t-1 0.0595*** 0.0477*** 0.0458*** 0.0456*** 0.0937*** 0.0953*** 0.0850*** 0.0891***
 (0.020) (0.016) (0.016) (0.014) (0.014) (0.013) (0.011) (0.010)
Agriculture sector, t-1 -0.1478*** -0.1427*** 0.0024 -0.0863* -0.2881*** -0.3421*** -0.2387*** -0.2817***
 (0.057) (0.053) (0.073) (0.050) (0.058) (0.041) (0.045) (0.035)
Corruption, t-1 -1.4141* 0.5019 -1.3318* 0.9085 -2.7948*** -2.7211*** -2.3246*** -2.2582***
 (0.800) (0.852) (0.706) (0.846) (0.883) (0.752) (0.762) (0.655)
Inflation, Log, t-1 0.4951 0.7385 0.0251 0.0152 -2.3929*** -2.5326*** -2.3916*** -2.5242***
 (0.497) (0.481) (0.667) (0.602) (0.656) (0.519) (0.509) (0.385)
Education, t-1 0.4348** 0.4887*** 0.5387** 0.5070** 1.2218*** 1.1170*** 1.1988*** 1.0950***
 (0.171) (0.163) (0.266) (0.243) (0.314) (0.221) (0.287) (0.209)
Constant -4.9756 -5.3501 -26.1061** -9.3483 30.0943*** 43.6770*** 20.7919*** 30.8840***
 (10.982) (9.001) (12.828) (8.311) (10.256) (6.438) (7.364) (5.293)
First stage
Submarine cable 1.3871*** 1.3871*** 0.0484*** 0.0511***
 (0.383) (0.383) (0.014) (0.013)

Observations 321 321 393 390 321 321 374 371
Number of countries 37 37 37 37 37 37 37 37
R-squared 0.374 0.401 0.378 0.418 0.519 0.589 0.549 0.616
Hansen, p-value 0.743 0.933 0.589 0.319
Cragg-Donald Wald F statistic 18.129 18.129 132.251 130.356
Anderson-Rubin Wald test, p-value 0.015 0.011 0.052 0.026
Robust standard errors in parentheses. *** p
REGIONAL ECONOMIC OUTLOOK: SUB-SAHARAN AFRICA

 Annex 3.5. Mobile Phone Ownership and Welfare: Evidence from South Africa’s
 Household Surveys 12
 Household surveys provide a potential “window” into understanding whether digitalization
 has positive effects on welfare. Variations in the structure and the still evolving coverage of
 variables related to digitalization in household surveys for sub-Saharan African countries
 limit the scope for cross country analysis. Consequently, this analysis is based on one country
 with relatively large survey data—South Africa 13—and a level of mobile phone ownership
 that was most suited for the analysis.

 Greater mobile phone ownership Annex Figure 3.5.1. Cellphone Ownership in 2008 and 2017
 has likely had positive effects on by Expenditure Decile
 welfare in South Africa. Household
 surveys show that mobile phone
 ownership over the past decade has
 grown faster among less affluent
 individuals (Figure 3.5.1).
 Moreover, individuals who owned a
 mobile phone in 2008 were more
 likely to move up the expenditure
 distribution by 2017 (Figure 3.5.2).

 The literature suggests mobile
 phone ownership could increase
 households’ welfare through several
 channels. Mobile phones help Annex Figure 3.5.2. Excess Probability for Cellphone Owners
 save on travel time and costs of Moving to Higher Expenditure Deciles from 2008 to 2017
 (76 percent), in finding work
 (around 40 percent), and
 accessing free education content
 (8 percent), according to surveys
 in Africa (World Bank 2016).
 Mobile phones provide greater
 and more affordable access to
 information, which can increase
 market efficiency (e.g., by sharing
 information on agricultural prices
 and labor markets), facilitate
 networking and starting a
 business, and increase disposable

 12
 This online annex was prepared by Ken Miyajima.
 13
 South Africa’s National Income Dynamic Survey data include 5 waves in about 2-year increments (2008–17)
 with unique individual IDs.

16 INTERNATIONAL MONETARY FUND | APRIL2020
3. ANNEX—DIGITALIZATION IN SUB-SAHARAN AFRICA

income, particularly for the most vulnerable. Mobile money fosters risk sharing but direct
evidence of the promotion of welfare and savings is less robust (Aron 2018).

Empirical analysis suggests that mobile phone ownership tends to be associated with
increases in consumption. Analyzing the impact of mobile phone ownership on the log of
real expenditure level, using South Africa’s household surveys and controlling for
macroeconomic conditions and individuals’ characteristics, shows that having a mobile
phone would lead to a rise in real expenditure by about 10 percent over two years. The
positive impact appears to accrue more for less affluent mobile phone owners. Different
specifications were tried for this analysis, including gender, ethnicity, employment status,
access to finance (store card, credit card, access to different types of loans), per capita GDP
(log level), location, location-by-time, and time. Lagged real expenditure (log level) was
included in a bid to control for the potential reverse causality that mobile phone ownership
may be motivated by resource availability.

 Reference

Aron, J. 2018. “Mobile Money and the Economy: A Review of the Evidence.” The World
 Bank Research Observer. Volume 33, Issue 2, August, 135–88.

 INTERNATIONAL MONETARY FUND | APRIL 2020 17
REGIONAL ECONOMIC OUTLOOK: SUB-SAHARAN AFRICA

 Annex 3.6. Role of Central Bank Digital Currencies14
 The role of central bank digital currencies (CBDC) in sub-Saharan Africa is in its very early
 stages. A CBDC is a currency issued digitally by the central bank to serve as legal tender.
 Some research points to the potential for CBDCs to lower the cost of cash, increase financial
 inclusion, make payment systems more stable, improve market competition, and enhance
 monetary policy transmission.

 Several operational challenges could emerge with the full-fledged implementation of
 CBDCs. In these circumstances, central banks would have a significant increase in their
 responsibilities, including performing customer due diligence, offering or vetting wallets,
 developing underlying technology, offering a settlement platform, managing customer data,
 monitoring transactions, and interacting with customer requests, complaints, and questions
 (Adrian 2019). Implementation of CBDCs would come with large exposure to risks of
 glitches and cyberattacks and put central banks’ credibility at risk. There are also risks to
 financial stability due to the potential disintermediation of the banking sector, a higher
 potential for bank-runs, and changes in central banks’ balance sheet and liquidity provision
 functions.

 Alternatively, central banks could opt for synthetic CBDCs. Such a system could rely on the
 existing e money infrastructure, building on a public-private partnership between e money
 providers and the central bank. This could provide broadly similar benefits but with relatively
 lower operational challenges than CBDCs (Adrian 2019) as some operational issues would
 be outsourced to the private sector (e.g., customer management and screening and
 monitoring). Central banks would be responsible for settlement between trust accounts and
 for regulation and supervision including on e-money issuance (Annex Figure 3.6.1).

 Annex Figure 3.6.1. E-money with Trust to Protect Client Funds

 Source: Adrian and Mancini-Griffoli (2019)

 Synthetic CBDCs could help with regulation and supervision of e-money. First, central banks
 can ensure the interoperability of payments, and thus protect consumers from risks associated
 with the growth of e money monopolies and enhance its supervisory role. Second, the system
 would allow mobile network operators to overcome market and liquidity risks, as they would
 rely on the central bank. Third, monetary policy transmission could be more effective if

 14
 This online annex was prepared by Pranav Kumar Gupta.
18 INTERNATIONAL MONETARY FUND | APRIL2020
3. ANNEX—DIGITALIZATION IN SUB-SAHARAN AFRICA

central banks opt to set an interest rate on the reserves held by e money providers and e-
money providers pass on interest received on their reserve accounts to their customers.
Finally, central banks should establish supervision and oversight rules to e money providers.

 References

Adrian, Tobias, and Tommaso Mancini-Griffoli. 2019. “The Rise of Digital Money.” Fintech
 Notes, IMF, July 2019.

Adrian, Tobias. 2019. “Stablecoins, Central Bank Digital Currencies, and Cross-Border
 Payments: A New Look at the International Monetary System.” speech given at the IMF-
 Swiss National Bank Conference, Zurich, May 2019.

Mancini-Griffoli, Tommaso, Maria Soledad Martinez Peria, Itai Agur, Anil Ari, John Kiff,
 Adina Popescu, and Celine Rochon. 2018. “Casting Light on Central Bank Digital
 Currency.” IMF Staff Discussion Note, November.

 INTERNATIONAL MONETARY FUND | APRIL 2020 19
REGIONAL ECONOMIC OUTLOOK: SUB-SAHARAN AFRICA

 Annex 3.7. Selected Country Experiences with Digital Reforms 15
 Many countries in sub-Saharan Africa are pursuing policy reforms to advance digitalization.
 Among these efforts, the experiences of Burkina Faso, Côte d’Ivoire, Ghana, Kenya, Niger,
 Rwanda, and Sierra Leone demonstrate the range of actions and progress across the region.

 Burkina Faso has adopted several digital initiatives, including its 2013 Digital Development
 Strategy. The authorities acknowledge the role of ICTs, including cellular phones to which
 access quadrupled between 2008 and 2016 and in turn contributed to the growth in the use of
 mobile money services. The number of mobile money agent outlets increased by five-fold
 during 2014–17, opening an alternative opportunity to financial inclusion at a time when
 security shocks posed operational risks for traditional banking in remote areas. Looking
 forward, the authorities’ commitments in digitalization include connecting all public
 agencies, schools, and health facilities and setting up a unique digital identification for each
 citizen and company.

 Côte d’Ivoire launched “E-impôts” in 2018, a digital tax payment platform for corporate
 taxpayers to enable about 80 percent of taxes to be paid online. A second initiative, supported
 by IMF technical assistance, is digitalizing the Directorate General for Taxation to
 (i) facilitate fulfillment of taxpayers’ tax obligations through online declarations and
 payments; (ii) develop interoperability of information systems to enable interactions with
 third parties to identify corporate taxpayers; and (iii) strengthen data collection and analysis
 capacity using blockchain and artificial intelligence. Through this new system, the authorities
 are implementing an e-invoicing process to improve value-added tax (VAT) performance
 using connected object technologies (IOT) to enable real-time acquisition of information. A
 pilot phase will be deployed in supermarkets in 2020.

 Ghana’s digitalization strategy aims to (i) reduce informality and (ii) enhance delivery and
 targeting of public services through improved governance. 16 Led by the Ministry of
 Communications, its key initiatives include:

 • National Digital Property Addressing System (Ghana PostGPS). Tagging locations with
 unique digital addresses to support growth in online and financial services, enhance
 property and credit registries, and facilitate tax collection.

 • Paperless port system. Streamlined customs procedures to cut administration costs and
 clearance times, and facilitate cross-border trade.

 15
 This online annex was prepared by Mehmet Cangul, M. Astou Diouf, Jose Gijon, Frederico Lima, Monique
 Newiak, Felix Simione, and Martha Tesfaye Woldemichael.
 16
 See, for example, Ghana’s 2020 Budget Speech: https://www.mofep.gov.gh/budget-statements/2020.

20 INTERNATIONAL MONETARY FUND | APRIL2020
3. ANNEX—DIGITALIZATION IN SUB-SAHARAN AFRICA

• Biometric national ID cards (Ghana cards) linked to the provision of public services and
 are part of a larger effort to create an integrated database with passport, tax ID, driver’s
 license, and pension data.

• Government e-services, including vehicle registration, driver’s license and passport
 renewal, and a digital 2020 census to facilitate access to government services, reduce
 waiting times, and eliminate bribery.

Kenya’s Digital Economy Blueprint launched in May 2019 by the Ministry of Information,
Communications and Technology, covers five pillars: (i) digital government, (ii) digital
business, (iii) infrastructure, (iv) innovation-driven entrepreneurship, and (v) digital skills
and values.

Digital solutions implemented include creating online services platforms for citizens
(Huduma, G2C) businesses (Keninvest, KenTrade), and government (e-tax), and promoting
the creation of digital companies. This has been facilitated by enabling policies in key areas:

• Investment in connectivity (the National Optic Fiber Backbone Infrastructure) and
 electricity—the government vowed to expand the national energy grid from its current
 70 percent coverage.

• Training in digital skills, including technology, software development, and
 entrepreneurship, offered by several local universities and private institutions (Moringa
 school, AkiraChix, Andela, Tupanda Institute).

Strengthening of the legal framework to enforce contracts, resolve disputes, and protect
consumers, including with data protection and consumer protection bills.

Niger’s digitalization strategy, launched in July 2017 and led by the National Agency of
Information Society , is anchored around three pillars: (1) smart villages; (2) a new tech
center, and (3) e-government.

• The smart villages initiative aims, with support from the World Bank, to digitally connect
 more than 80 percent of the population to reliable internet powered by off-grid solutions,
 including solar panels.

• The tech center includes a coding academy to help develop information, communication,
 and technology (ICT) solutions to local problems. It aims to eventually integrate a drone
 academy and a tablet assembly line; consolidate tech startups in the same location; and
 connect with existing innovative agricultural solutions on site.

• Finally, the e-government project aims to introduce digital services to a limited set of
 government agencies, including e-declarations and e-payment of select taxes, by the end
 of 2020.

 INTERNATIONAL MONETARY FUND | APRIL 2020 21
REGIONAL ECONOMIC OUTLOOK: SUB-SAHARAN AFRICA

 Rwanda has adopted several strategies since 2000, including three national information and
 communications infrastructure plans and two ICT Sector Strategic plans—sought to create an
 enabling environment for ICT, expand digital infrastructure and services, and promote digital
 skills.

 The SMART Rwanda 2020 Masterplan, adopted in 2015, focuses on: (i) business and
 innovation; (ii) national economic digital transformation (digitalize government by 2018,
 broadband for all by 2020, digital literacy); (iii) planning (research and development for
 exports and digital transformation in big data analytics, drone technology, and cyber
 security). These strategies enabled Rwanda to:

 • enhance digital connectivity, including increased Internet broadband and mobile phone
 penetration, which has benefited mobile money adoption and furthered financial
 inclusion;

 • create a one-stop portal for e–government services (e.g., e–visa, online application for
 national IDs and birth and marriage certificates); and

 • use drone technology for blood delivery in remote areas or spraying insecticides to fight
 malaria.

 Sierra Leone launched its National Innovation and Digitization Strategy in November 2019,
 aimed at leveraging technology to tackle policy challenges and support the government’s
 National Development Plan. The strategy is led by the Directorate of Science Technology
 and Innovation. Key initiatives include:

 • Tackling infrastructure gaps, with the launch of a new drone corridor in November 2019,
 the first in West Africa, to monitor agricultural conditions and enable rapid delivery of
 medicines.

 • Addressing data and information gaps, especially in rural areas, through a new Integrated
 Geographic Information System portal to support more effective policies and
 interventions.

 • Strengthening Public Finance Management by using online systems. For example, a new
 Teacher Application, Approval, and Allocation Portal upgrades the paper-based teacher
 recruitment processes.

 • Combatting corruption by digitalizing the recording and analysis of public officials’ asset
 declarations, and applying artificial intelligence to trace suspicious transactions.

22 INTERNATIONAL MONETARY FUND | APRIL2020
You can also read