Annex A: Evidence on the general economic outlook
←
→
Page content transcription
If your browser does not render page correctly, please read the page content below
Annex A: Evidence on the general economic outlook

Economic context and outlook for the economy
The Government’s economic strategy set out in the June Budget 2010 is designed to
protect the economy through the period of global uncertainty and support the process of
recovery. This strategy is restoring the public finances to a sustainable path and the deficit
is forecast to be halved by the end of 2014-15. The UK is seen as a relative safe haven,
with low market interest rates helping keep interest payments lower for households,
businesses and the taxpayer. This strategy has helped the Government equip the UK to
compete in the global race.

UK economy is now on the path of recovery with positive growth since the second quarter
of 2013. The UK economy grew by 0.8 per cent in each quarter of 2014 and the Office for
Budget Responsibility (OBR) forecast the UK economy to grow by 2.7 per cent in 2014.

The Government remains committed to reducing the deficit and addressing the permanent
structural deterioration in the public finances caused by the lasting impact of the financial
crisis. Implementation of the fiscal consolidation plans is well underway. By the end of
2013-14, around 70 per cent of the annual fiscal consolidation planned for the Spending
Review 2010 period had been achieved, with around 65 per cent of the spending and all of
the tax consolidation in place. 80 per cent of the total consolidation in 2015-16 is expected
to be delivered through lower spending.

While a significant amount of fiscal consolidation has already been achieved, the deficit and
debt remain at unsustainable levels. The public sector net debt is forecast to continue to
rise this year and reach its peak in 2015-16. Despite the positive economic growth
significant risks remain to the structural position of the public finances. These include risks
from external economic shocks (including ongoing weakness in the Euro area, financial
instability in the emerging markets, situation in Russia and Ukraine) and weak receipts
growth due to slow earnings growth (affected by low pick up in productivity as well as shift
in employment pattern towards more self-employed).

The OBR forecast inflation of 1.9 per cent in 2014 and 2.0 per cent in 2015 and forecast it
to continue to remain at target in 2016. The Bank of England’s latest inflation forecast,
published in the August Inflation Report is little changed compared to the May report. The
Monetary Policy Committee (MPC) expect inflation to be about 1.8 per cent from fourth
quarter of 2014 onwards.

Labour market figures continued to strengthen in the first half of 2014. The OBR expects
employment to continue to rise over the forecast period although with slower growth than
that seen over 2013. Unemployment rate has fallen by 0.9 percentage points since the end
of 2013, and is now 6.4 per cent down from the peak of 8.4 per cent in the final quarter of
2011. Wage growth remains weak with regular pay growth slowing to 0.6 per cent in the
second quarter of 2014 compared to the same period last year. While private sector pay
growth has recovered somewhat from its large decline in 2009, it is growing at only about 1-
2 per cent p.a. compared with the pre- recession trend of about 4 per cent p.a.

Public sector pay restraint has been a key part of the fiscal consolidation so far. Budget
2013 announced that public sector pay awards in 2015/16 will be limited to an average of
up to 1 per cent.
Growth

  A1 The UK has been hit by the most damaging financial crisis in generations and the
     government inherited the largest deficit since the Second World War. The
     government’s long-term economic plan has protected the economy through a
     period of uncertainty, and provided the foundations for the UK’s economic recovery
     which is now well established.
  A2 The government’s long-term economic plan is restoring the public finances to a
     sustainable path. The deficit has fallen by over a third as a percentage of GDP
     since 2009-10 and is forecast to have halved by the end of 2014-15. The
     government’s plan has ensured economic stability and provided the foundations for
     the recovery. In order to safeguard the economy in the long term, the government
     continues to take decisive action through monetary activism and credit easing;
     deficit reduction; reform of the financial system; and a comprehensive package of
     structural reforms.
  A3 UK GDP growth has been positive since the second quarter of 2013 and growth
     has exceeded forecasts. The UK economy grew by 0.8 per cent in the second
     quarter of 2014, following 0.8 per cent growth in the first quarter. The level of UK
     GDP has surpassed its pre-recession peak for the first time in the second quarter of
     2014. The recovery is also balanced across all the main sectors of the economy,
     with manufacturing, services and construction all growing by over 3 per cent in the
     second quarter on a year earlier.
  A4 Reflecting this increased momentum, the Office for Budget Responsibility’s (OBR)
     Budget 2014 forecast revised up UK GDP growth in 2014 to 2.7% compared to
     2.4% from the Autumn Statement 2013 forecast. GDP growth in 2015 was revised
     up to 2.3% from 2.2%.
  A5 However, external risks remain, reinforcing the case for stability in the
     government’s long term economic plan. These include slowing growth and financial
     instability in some emerging markets, and ongoing weakness in the euro area. The
     situation in Russia and Ukraine is a new risk, and further deterioration is likely to
     have some impact on the UK. Abandoning the government’s long-term economic
     plan and the path of fiscal credibility would represent the most significant risk to the
     recovery.
  A6 The Government is delivering ambitious structural reforms to enable the UK to
     compete in a rapidly changing global economy. These reforms are a key part of the
     Government’s economic strategy, alongside fiscal consolidation, monetary
     activism, and reform of the financial system.
  A7 To help equip the UK to succeed in the global race the government is implementing
     the most radical programme of economic reform in a generation. These reforms
     include making the tax system more competitive, equipping the UK’s young people
     for the future, reforming the welfare system, increasing the income tax personal
     allowance and delivering improvements in the UK’s infrastructure.

                                             2
Table 1A: Forecasts for GDP growth 2014 to 2016
Forecasts for GDP growth (per cent) 2014 2015 2016
OBR (March Budget 2014) 2.7 2.3 2.6
IMF WEO (July 2014 update) 3.2 2.7 2.4
Avg. of independent forecasters (August 2014) 3.1 2.6 2.4
Inflation
A10 Inflation has fallen significantly since its peak in September 2011. CPI inflation
peaked at 5.2 per cent in September 2011 but fell back in 2012 as past rises in
commodity and energy prices and VAT dropped out of the twelve month
comparison. Inflation has been below the 2.0% target for the last seven months and
over the second quarter of 2014 was 1.7 per cent.
A11 Compared to the Bank of England’s May 2014 Inflation Report, the outlook for
inflation in the August report is largely unchanged. In the central case, inflation falls
back a little in the near term as the appreciation of sterling bears down on import
prices and, in turn, prices in the shops. The Bank of England expects inflation to
remain around 1.8 per cent from Q4 2014 onwards.
The OBR expects the rate of inflation to remain close to the 2.0% target for the rest
of 2014, before settling at target in the second half of 2015. The OBR states in its
March 2014 Economic and fiscal outlook that “anchored expectations are assumed
to help keep inflation around target”.
Table 2A: Forecasts for CPI Inflation 2014 to 2016
Forecasts for CPI Inflation
2014 2015 2016
(per cent change on a year earlier)
OBR (March Budget 2014) 1.9 2.0 2.0
IMF WEO (April 2014) 1.9 1.9 1.9
Avg. of independent forecasters* (August 2014) 1.7 2.1 2.1
*Fourth quarter
3Affordability
A12 The Government inherited the largest deficit in post-war history due to the financial
crisis and unsustainable pre-crisis increases in public spending. The historically
high level of borrowing risked undermining fairness, growth and economic stability
in the UK. In 2010 the Government set out clear, credible and specific medium-term
fiscal consolidation plans to return the public finances to a sustainable path.
A13 The Government’s fiscal strategy has been effective in providing protection against
a challenging backdrop of global uncertainty and fiscal vulnerabilities. This has
restored fiscal credibility, and allowed activist monetary policy and the automatic
stabilisers to support the economy through the headwinds it faced in 2011 and
2012, consistent with the approach recommended by international organisations.
A14 The Government remains committed to reducing the deficit and addressing the
permanent structural deterioration in the public finances caused by the lasting
impact of the financial crisis. Substantial progress has been made, and the deficit
has fallen by more than a third as a percentage of GDP since its peak (from 11.0%
in 2009-10, to 6.5% of GDP in 2013-14). By the end of 2013-14, around 70% of the
annual consolidation planned for this parliament had been achieved, with around
65% of the spending and all of the tax consolidation in place. 80% of the total
consolidation in 2015-16 will be delivered by lower spending.
A15 The improved economic outlook supports the public finances, with the ‘underlying
deficit’ now expected to be around £95 billion lower over the forecast period than
forecast at Budget 2013. However, although the structural deficit continues to fall
year on year, the OBR judges that it has not been improved by stronger economic
growth over the past year, which the OBR has judged represents an improvement
in the economic outlook rather than than an improvement in the economy’s growth
potential. Substantial risks remain to the structural position of the public finances.
These risks include external economic shocks, such as those set out in paragraph
A5, public spending pressures and weak receipts growth driven by disappointing
earnings growth. Therefore, the balance of fiscal risks argues strongly for sticking
to the government’s long-term economic plan.
A17 The deficit and debt remain at unsustainable levels. This year, the deficit is forecast
to be £95.5 billion (5.5% of GDP), and public sector net debt is forecast to continue
to rise to peak at 77.3% of GDP next year (2015-16), at which point the government
is forecast to be spending around £59 billion on servicing its public debt – more
than is planned to be spent on the Department for Education. With the deficit and
debt still at these unsustainable levels, deviating from the long-term economic plan
as set out in 2010 would be the biggest risk to the recovery. Maintaining a clear and
credible path of deficit reduction, which is based on continued public sector
spending control and public sector pay restraint, is essential to ensuring market
confidence in the government’s ability to get the public finances back to a
sustainable position.
A18 The international fiscal context argues strongly in favour of maintaining a credible
pace of deficit reduction. Despite significant progress since 2010, the European
4Commission forecasts that this year the UK will have the third largest deficit and
the largest structural deficit in the European Union. Given this context, maintaining
the current clear and credible path of deficit reduction is necessary in order to
maintain the confidence of international bond markets.
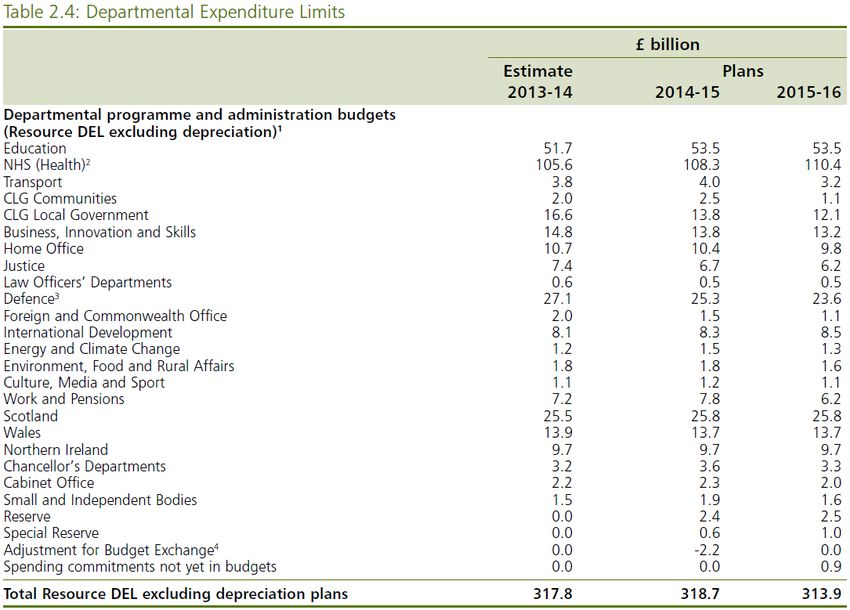
A19 The implication of fiscal consolidation for departmental spending levels can be seen
in table 3A below, which shows resource DEL budgets for each department from
the Public Expenditure Statistical Analyses 2013. An estimated £164.3 billion in
2013-14 was spent on public sector pay, around 50% of departmental resource
spending.
Table 3A: Departmental Expenditure Limits
Source: HM Treasury, March 2014
Labour market
A20 Headline labour market figures continued to strengthen in the first half of 2014.
Employment has risen by 451,000 since the end of 2013 bringing the employment
level to 30.6m. The employment rate rose 0.9 percentage points to 73.0 over the
the same period, in-line with its pre-recession peak. The OBR expects employment
to continue to rise over the forecast period, but at a slower pace than the increase
over 2013. Unemployment fell by 264,000 over the first half of 2014 and is down
437,000 over the year. The unemployment rate has fallen by 0.9 percentage points
since the end of 2013, by 1.4 percentage points compared to the same period last
year and down from the peak of 8.4% in the final quarter of 2011. At 6.4% the
5unemployment rate is 0.4 percentage points lower than forecast than the OBR
forecast at budget.
A21 In the second quarter of 2014, the overall LFS employment level was 1.03 million
above its pre-recession peak in the three months to May 2008. The number of
vacancies increased by 119,000 over the year to 656,000 in the three months to
July 2014, and is at its highest level since the three months to May 2008.
A22 However, while employment growth remains robust and unemployment is falling
wage growth remains weak. Regular pay growth (excluding bonuses) in the second
quarter of 2014 slowed to 0.6% on the year.
Employment and unemployment
A23 The increase in the level of employment of 820,000 over the year to the second
quarter of 2014 continues to see employment grow strongly and outpace forecasts
for the OBR. Employment over the last year increased faster in the UK than in any
other G7 country. The composition of the labour market has also changed over the
last year with an increase in the share of total employment accounted for by self-
employment, to 15 per cent from 14 per cent a year earlier. The composition of the
labour market can have important implications for tax receipts with the self-
employed typically paying less tax than employees.
A24 The ILO unemployment rate, which rose from a low of 5.2% in the first quarter of
2008 to peak at 8.4% (2.66m people) in the final quarter of 2011, has subsequently
fallen to 6.4% in the second quarter of 2014. Unemployment is down 437,000 on
the year, the fastest annual decline since 1988.
A25 Long term unemployment (unemployment of 12 months or more) stands at 738,000
in the second quarter of 2014, down by 171,000 over the year. Long-term
unemployment now accounts for 35.5% of total unemployment, a reduction of 0.6
percentage points on the year.
A26 Working age inactivity (16-64) was down by 130,000 over the year with the
inactivity rate falling by 0.4 percentage points to 21.9 percent. The fall in activity
has been driven by a decline in female inactivity which is down 93,000.
A27 Youth unemployment (16-24) fell by 102,000 in the second quarter of 2014 and
down 206,000 on the year,the fastest decrease since records began. The youth
unemployment rate stands at 16.9%, down 2.1 percentage points on the year.
Excluding people in full-time education (FTE), there were 502,000 unemployed 16-
24 year olds, with a corresponding unemployment rate of 14.5 per cent.
A28 The claimant count (the number of people claiming Jobseeker’s Allowance) has
fallen for twenty-one consecutive months and is down 420,000 in the year to July
2014, the fastest annual decline since December 1973.
Table 4 summarises these statistics:
Table 4A: Labour market statistics summary (Levels in 000s, rates in %)*
2010 2011 2012 2013 2014
6Q2
Employment level
29,019 29,166 29,519 29,896 30,597
(All aged 16 and over)
Employment rate
70.5 70.5 71.1 71.7 73.0
(All aged 16-64)
Unemployment level
2,476 2.564 2,548 2,460 2,077
(All aged 16 and over)
Unemployment rate
7.8 8.1 7.9 7.6 6.4
(All aged 16 and over)
Youth unemployment level
932 985 992 954 767
(All aged 16-24)
Youth unemployment rate
19.8 21.1 21.2 20.8 16.9%
(All aged 16-24)
Claimant Count 1,496 1,534 1,585 1,421 1,008**
* The latest public and private sector employment figures available are for the first
quarter of 2014. These show that private sector employment rose by 355,000 on the
quarter and was up by 795,000 over the year. This more than offset the fall in public
sector employment which decreased by 11,000 on the quarter and by 16,000 over the
year. This takes into account of major reclassifications where large bodies employing
large number of people have moved between the public and private sectos.
** Latest monthly data used (July 2014)
Public and private sector earnings
A29 Earnings growth in the private sector continues to be weak and over the period
since 2008 average earnings growth in the public sector has generally exceeded
that in the private sector. While private sector pay growth has improved since 2009
(about 1-2 per cent p.a.) we are yet to a return to growth rates seen before the
recession (about 4 per cent p.a.). Even after controlling for individual characteristics
IFS study finds that the pay differential between public and private sector workers
still continues to be in favour of the former and above the pre-recession trend.
A30 Average total pay growth (including bonuses) decreased by 0.2% in the three
months to June 2014 compared to the same three month period in 2013, the first
time the rate has been negative since May 2009. This was mainly due to an
unusually high growth rate in April 2013 as some employers who usually paid
bonuses in March paid them in April last year to benefit from the lowering of the tax
rate in April 2013. Regular pay growth (excluding bonuses) rose by 0.6% over the
same period. Inflation as measured by the Consumer Price Index increased by
1.9% on the year to June, meaning that real pay growth continued to be negative
over this period.
Average total private sector pay has recovered somewhat from its large decline in
2009 but remains mostly weak, growing by just 2.0% in 2010 and 2.6% in 2011,
compared to above 4% prior to the recession. Private sector pay growth weakened
7to 1.4% in 2012 and 2013. Total private sector pay stengthened in the first quarter
of 2014 and grew by 2% but decreased to -0.1% in the second quarter of the year.
A31 Public sector (excluding financial services) average regular pay was 2.3% in 2010
and 1.8% in 2011. While this recovered slightly in the middle of 2012, growing by
2.3% in the third quarter of 2012, it weakened towards the end of the year and
continued to weaken in 2013 growing by 0.9%. Pay in 2014 has picked up slightly,
reaching 1.5% in Q1 before falling to 1.2% in Q2.
A32 The sharp drop in bonuses for the whole economy seen in 2009 put more
downward pressure on total pay (pay including bonuses). While there were some
tentative increases in the levels during 2010 and 2011, it has remained mostly
subdued. Whole economy bonus pay growth has seen large fluctuations during
2013 with a fall of 4.9% in March 2013 but an extremely large single month
increase in April 2013 of 44.7% corresponding to the shift in the timing of annual
bonus payments. The base effects of the shifting of bonus payments meant that
bonus payments were particularly weak in the second quarter of 2014, down -
10.8%. This has been a large drag on private sector pay in particular.
A33 Table 5 sets out the differences in regular and total pay growth across years in the
public and private sector.
Table 5A: regular pay (excluding bonuses) and total pay growth 1
Total Pay, Regular pay,
annual growth annual growth
All Private Public2 All Private Public2
2009 -0.1% -0.9% 2.8% 1.7% 1.2% 3.0%
2010 2.4% 2.0% 2.2% 1.9% 1.5% 2.3%
2011 2.5% 2.6% 1.5% 2.0% 2.0% 1.8%
2012 1.4% 1.4% 1.7% 1.6% 1.8% 1.6%
2013 1.2% 1.4% 0.8% 1.0% 1.1% 0.9%
2014 Q2 -0.2% -0.1% 0.9% 0.7% 0.9% 1.2%
A34 Since the introduction of the pay freeze and the policy of pay restraint, average
earnings in the public sector (as measured by the ONS) continue to display positive
growth for a number of reasons: the provision of £250 to those earning £21,000 or
less during the two years of pay freeze, the fact that some three year pay deals only
ended in September 2011, and an upwards pay drift due to continued constrained
recruitment.
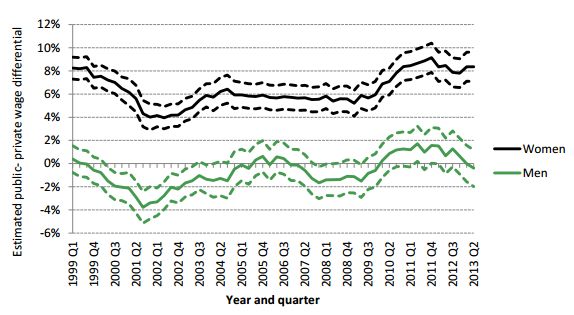
A35 In addition the public-private sector pay differential based on average hourly
earnings controlling for worker characteristics, as published in the IFS report
1
Source: ONS, AWE; HMT calculations annual percentage change for quarter one.
2
Public sector pay excluding financial services
8(December 2013) shows that the public sector premium still remains above its pre-
recession level.
Figure 1: Public-private hourly pay differential controlling for individual
characteristics, IFS (December 2013)
Public sector pensions
A36 When considering changes to remuneration, it is important to consider the overall
value of the public sector reward package. As set out above, pay in the public
sector continues to be above that of the private sector on average. However, there
are many reasons aside from pay that may drive an individual’s decision as to
whether they will work in the public or private sector.
A37 One major factor in the overall reward package is pension provision. In the last few
decades pension provision in the public and private sectors has diverged, in
response to pressures around longevity, changes in the business environment and
investment risk. This has led to a sharp decrease in the provision of defined benefit
schemes in the private sector. Around 85% of public sector employees are
members of employer-sponsored pension schemes, compared to only 35% in the
private sector.
A38 Following a fundamental review of public service pension provision by the
Independent Public Service Pensions Commission, the Government is introducing
key changes to the pension element of the remuneration package. New public
service pension schemes will be introduced in April 2015, which will:
calculate pension entitlement using the average earnings of a member over
their career , rather than their salary at or near to retirement;
9 calculate pension benefits based on Normal Pension Age linked to the
member’s State Pension Age; and
include an employer cost cap mechanism,which will ensure that the risks
associated with pension provision are shared with scheme members to
provide backstop protection for the taxpayer.
A39 The changes being introduced through the Public Service Pensions Act 2013 will
save an estimated £65 billion by 2061-62.
A40 Wider changes to public service pension provision have also taken place.
Progressive increases in the amount that members contribute towards their public
service pension began in April 2012 and were phased in over three years, with the
final increases made in April 2014. Members are now contributing an average of
3.2 percentage points more. This will deliver £2.8 billion of savings a year by 2014-
15.
A41 Protections from the impact of the contribution changes have been put in place for
the lowest paid. Those earning less than £15,000 will see no increases; and those
earning up to £21,000 (£26,000 for Teachers) will not see increases of more than
1.5 percentage points by 2014-15.
A42 Public service pensions will remain among the best available and will continue to
offer members guaranteed, index-linked benefits in retirement that are protected
against inflation. Private sector workers buying benefits in the market would have to
contribute over a third of their salary each year to buy an equivalent pension.
A43 Putting together the evidence on pension provision and pay levels – and
recognising that there will be significant variation between and within individual
workforces – the overall remuneration of public sector employees is above that of
the market. The Government is therefore clear that any changes to public service
pensions, including the progressive increase in contributions from 2012-13, do not
justify upward pressure on pay.
10You can also read